ACV vs ARR: Formulas, Tips, and Tricks for 2022
Revenue analytics is a crucial part of understanding how well your SaaS is doing. There are a ton of different metrics that you can use to measure your business’s current situation. ACV and ARR are two of the most important ones, right after Monthly Recurring Revenue (MRR).
In this article, I will go into detail about these two metrics so that you have a better understanding of your revenue analytics.

What is ACV?
Annual Contract Value (ACV) takes the average value an ongoing customer brings to a business in a year. This metric is mainly used by SaaS businesses operating on an annual or multi-year subscription basis, though businesses that use monthly subscriptions and different plans can use the Annual Contract Value by projecting their monthly revenue to a year as well.
What is ARR?
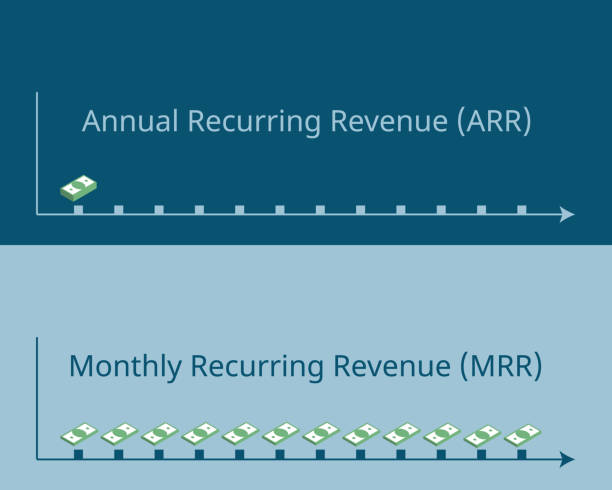
Annual Recurring Revenue (ARR) is the annual version of the MRR. Put simply, ARR is MRR*12.
When should you use ACV?
Annual Contract Value is not often used as a metric to measure growth: it’s used more as a means to measure customer success on a case-by-case basis. You could use ACV:
- To measure the success of your marketing team in terms of demand generation: if the ACV is high for a customer or for multiple customers, they are creating demand and getting a lot of people to sign contracts.
- To calculate the revenue brought by a single customer in order to understand the value they bring to your business,
- To compare the revenue generated by customers in different contracts more accurately.
Based on what you want to measure, you may include or exclude one-time contract charges. Excluding them may result in a better comparison between customers, but it may create a distorted image in terms of your long-term marketing success.
When should you use ARR?
Annual Recurring Revenue is the metric you should go to while measuring the yearly growth of your company. This metric is less focused on individual cases since it’s just the sum of all types of recurring revenue in a year (as explained below in the calculations.) You can use ARR:
- To make future predictions and investments: you’ll need to know how much revenue you’re expecting in a year or in multiple years,
- Since ARR only takes into account revenue from subscriptions, and not one time purchases, it can be used to determine the success of a subscription model,
- Comparing the ARR of different years tells you about your different marketing decisions’ impacts.
If your subscriptions have non-standard lengths, such as 8 months or 9 months and 30 days, your ARR may not give you a logical picture. You may need to adjust the calculations accordingly or use a similar SaaS marketing metric, MRR.
How do you calculate ACV?
Calculating Annual Contract Value is pretty easy. The equation is:
ACV = Total contract values / Total years in contract
Let’s assume that two customers signed up to your company with different plans:
- Customer X chose a $420 per year plan for 2 years. One-time fee for this plan is $70.
- Customer Y chose a $200 per year plan for 2 years. One-time fee for this plan is $50.
PS. If you charge a one-time fee (for set-up or training), your ACV for the first year will be higher than the other years in a multi-year subscription plan.
Here’s what your ACV will be when you look at both customers at the same time:
- ACV for the first year = ($420 + $70 + $200 + $50)/2 = $370
- ACV for the second year = ($420 + $200)/2 = $310
As you can see, the ACV for the first year is obviously higher than the second year because of the one-time fee for the transaction in the first year. You could also measure the ACV of X and Y separately, which would look like:
- ACV customer X = ($420 + $70)/2 = $245
- ACV for customer Y = ($200 + $50)/2 = $125
How do you calculate ARR?
Annual Recurring Revenue is the sum of the amount each customer pays you in a calendar year.
This is the equation for ARR:
ARR (annual recurring revenue) = Total annual revenue – Nonrecurring revenue
We can look at an example with three different customers with different subscription plans.
Customer A: Chose the plan to pay $1500/year for 1 year
Customer B: Chose the plan to pay $1200/year for 2 years
Customer C: Chose the plan to pay $1700/year for 3 years
In this scenario, ARR value will be:
Year 1: $1500 + $1200 + $1700 = $4400
Year 2: $1200 + $1700 = $2900
Year 3: $1700 = $1700
If you were to calculate ACV in this example, the result would be:
Year 1: ($1500 + $1200 + $1700)/3 = $1466.6
Year 2: ($1200 + $1700)/2 = $1450
Year 3: ($1700)/1 = $1700
ACV is the average of all subscription revenue. ARR is the sum of what each customer pays for the subscription plan in a year. They have similar points about functions but there are these little nuances.
Typical ACV for SaaS Businesses
It seems like there is no specific “Typical ACV value” or structure for SaaS businesses. There is a huge variation in subscription models, pricing, business to the customer versus business to business sales, and own calculations of the companies.
Research shows that values and requirements vary tremendously according to the scale of companies and the actions they take.
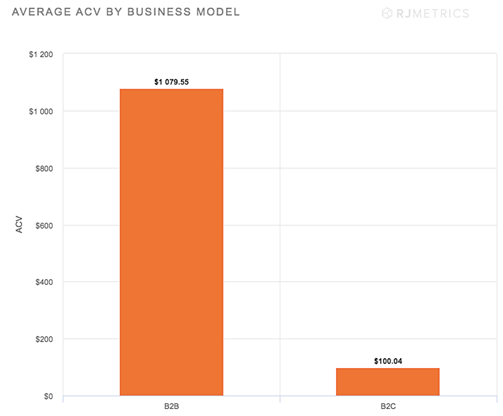
Let’s look at a study of RJMetrics. This study indicated that the ACV value differs a lot between B2B and B2C. According to the research, the average ACV of B2C SaaS companies is $100, while for B2B it is $1,079.
Other revenue metrics that you should track
MRR:
MRR measures the monthly recurring revenue a SaaS gets from subscriptions.
CAC (Customer Acquisition Costs)
CAC refers to the total amount you spend to obtain a new customer – including all the sales and marketing expenses that you pay to get those customers.
ACV is directly proportional to CAC.
A good CAC ratio for your company depends on the customer lifetime value of your business.
CAC and LTV (customer lifetime value) go together in this path:
CAC
Measures the cost to acquire a customer
LTV (Lifetime value)
It is a prediction of the aggregate contribution of an average customer to the company generally during the lifetime of the customer. The lifetime value of a customer.
But if you have more than one customer –hopefully- you will be in a need to use two more metrics to benefit LTV completely in your analysis. They are Churn Rate and Average Revenue Per User (ARPU).
Churn Rate
Churn rate refers to the number of customers who unsubscribed or stopped their payments for the subscription of your service. This cancellation information will keep you updated about the current situation of your SaaS company.
Example: If the number of subscribers was 1000 last year and lost 70, your churn rate is 7%.
ARPU(Average Revenue Per User / Unit)
Measures the overall revenue generated per user or unit. Total revenue of your business / the total number of customers you have in a given duration.
Example: If you have 1000 accounts in your company, and from 500 of them, you made $20 per year, and from the other 500 you made $30 per year, then your ARPU is $25 yearly.
Tools to track ARR
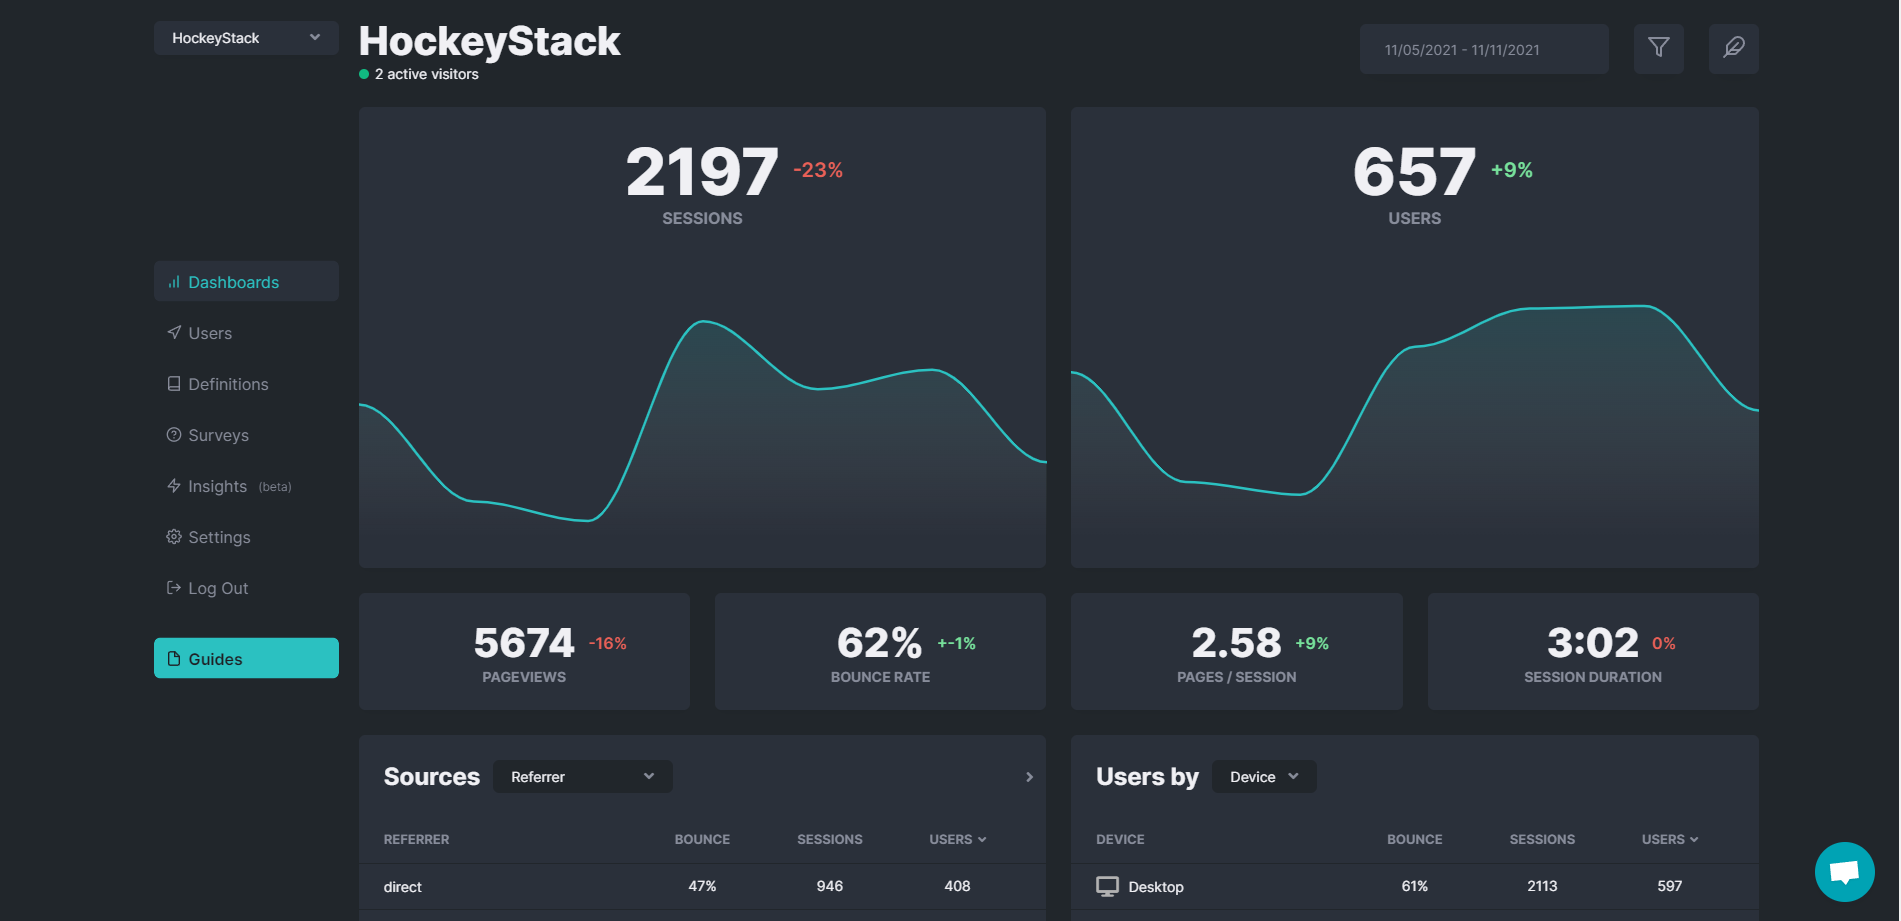
HockeyStack
- Price: Has a free forever plan
- Capterra rating: 4.9/5
HockeyStack is an end-to-end analytics tool for SaaS companies. It unifies marketing, revenue, sales, and product data into one dashboard with no code so that you can understand what really drives revenue at your SaaS. It’s completely no code, and it doesn’t require any setup.
HockeyStack has one-click integrations with Stripe and Paddle to track ARR, MRR, and other revenue metrics. Moreover, you can integrate with HubSpot to uncover invaluable insights and answer questions, such as:
- What is the average LTV of a blog post?
- Which marketing channel brings the most engaged users?
- What is the demo close rate of my blog posts?
- What is the average churn rate of users who signed up for a blog post?
- What are the common sales objections of users who signed up from my ad campaigns, blog posts, or top-of-the-funnel content?
and many more.
Start using HockeyStack for free!
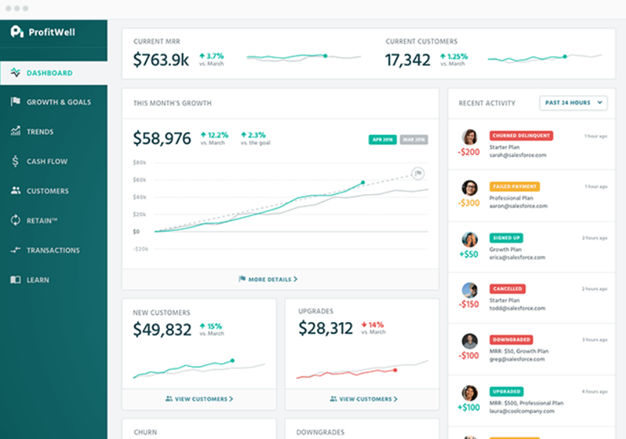
Profitwell
- Price: Free
- Capterra Rating: 4.7/5
Profitwell provides you to have revenue automation products that automatically reduce cancellations, optimize pricing, and give you accurate, free revenue reporting. It provides absolutely accurate, real-time subscription reporting and analytics, incredibly detailed analytics for subscription-based businesses. From MasterClass and Zenefits to Shipt and Vice, over 20,000 recurring revenue companies depend on ProfitWell to track their businesses.
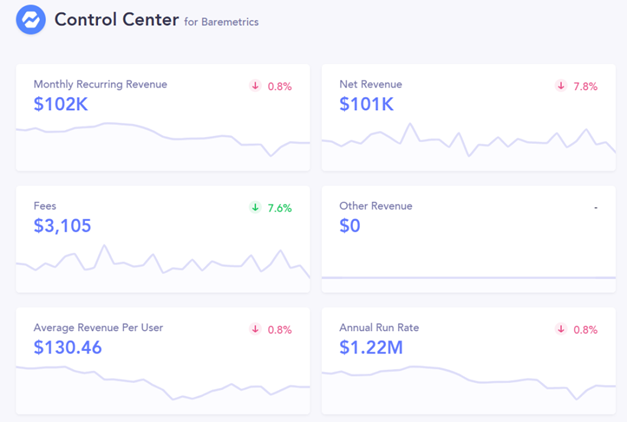
Baremetrics
- Price: Free trial is available. Subscription plans start from $29/month
- Capterra Rating: 3.3/5
Baremetrics is a tool that provides metrics, forecasting, analytics, insights and engagement tools for teams using Stripe, Braintree, Chargify, Recurly, and more. With zero configuration it is able to give you important business metrics like MRR, LTV, Churn, and much more:
1. Customizable Dashboard
2. Data Import/Export
3. Data Visualization
4. Financial Reporting
5. Forecasting
6. Sales Reports
7. Scheduled / Automated Reports
8. Search/Filter
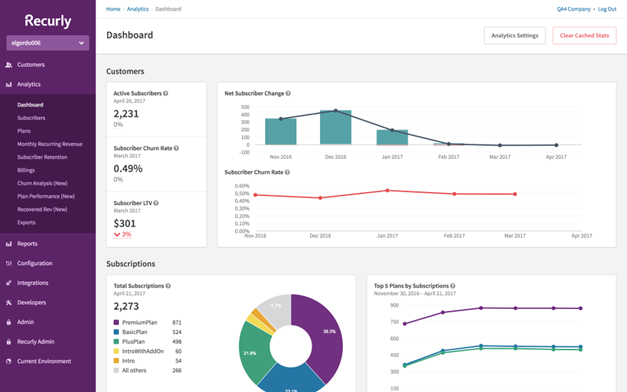
Recurly
- Price: Free trial is available. Subscription plans start from $149/month
- Capterra Rating: 4.5/5
Recurly is an all-in-one subscription management & billing platform which allows corporate businesses and middle-scale companies to manage recurring billing processes without complexities and procrastinations. With its multiple gateway support, unique gateway routing, and intelligent retry functions, your existing revenue will be always protected with Recurly. You can determine the price that you need with the multiple billing models that support it. Also, its global tax report will let your automated billing systems and productivity increase. And this will lead simplify revenue accountancy and allow you to collect your revenue faster.
Conclusion
Now you had an exact insight into the background of the ACV and ARR metrics which is important for subscription-based SaaS businesses. You are sure now to use these metrics to destroy some confusions -if they exist- about annual and multi-year transactions for the team performance of your company and efficiency of your own core management and computations for sustainable stronger future plans. To enlargen these keys and spread more information as well as motivation for better,
Strategy for sales and successions of your clients for the image side,
Product/ plan development for the marketing side of the company can be inspirational and useful for long-term regular revenue management. The better analysis will allow us to bring better future planning with good investment decisions even from today. The better you understand today’s results, measure performance, and your team’s soul, the better you can have tomorrow’s beginning and you can control your impact for the big picture.
FAQ
ARR is critical for both the management side of the SaaS company and the image on the investment side for the potential and existing investors.
As I mentioned before, ARR is a metric to analyze the financial health of the company by managers. And this annual value is useful for long-term strategies.
From the investors’ point of view, the predictability and stability of your current ARR will let the investors compare your company with peers and your current state with other periods of time.
With these in mind, ARR is a good metric for long-term strategies. For the short term, you can look at your MRR.
Month-over-month (MoM) is a metric that shows the change in the value specified as a percentage of the previous month’s value.
Month-over-month growth is often used to measure the growth rate of monthly revenue, active users, number of subscriptions, or other key metrics. It lets you measure how much revenue grew from one month to another on a percentage basis.
There are no certain benchmarks for monthly growth rate for a SaaS company as you can predict from the article. However, we have some goals and rules of thumb suggested for SaaS companies of different sizes at different stages of growth.
According to Jason Lemkin, Venture Capitalist, and Founder at SaaStr:
Double-digit MoM MRR Growth, on average, “is always good once you hit some traction.” More specifically Jason suggests that to “build something big…you have to at least have the potential to go from $1m – $100m in ARR in 7 – 10 years”. To achieve that result over 7 years you would need to grow MoM MRR at a compounded rate of 5.8%. “The best SaaS companies get from $2 – $10m in 5 quarters or less”, says Lemkin. This implies a compounded MoM MRR growth rate of 11.5%. In general, Lemkin says, SaaS company’s achieving MoM MRR growth of 20% are outliers; 15% Mom MRR growth is “Frickin Awesome” and 10% MoM MRR growth is “strong”.


