B2B SaaS Product Metrics Every SaaS MUST Track
The median revenue of the world’s 50 largest SaaS companies increased by 179% in 2020. This rates shows us how B2B SaaS products essentially dominate the market today. In such a situation, identifying and increasing the success of a B2B SaaS product is critical for companies.
So how is the success of a B2B SaaS product measured? Which B2B SaaS metrics should be based on this measurement? If you’re wondering about the answers to these questions, keep reading. This article will help you clear the doubts in your mind.
How do you measure the success of a B2B product?
The best way to measure the success of a SaaS is to use a variety of metrics. By using a few metrics to determine the success of your SaaS product, you can get access to a lot of valuable information that you can use to analyze everything from the feature that users engage with the most to the expectations that different users have before they start using your product. In other words, thanks to SaaS product metrics, you get access to holistic information about your product and user habits.
Let’s look at the metrics you should consider to measure and improve product success.
Why tracking product metrics important?

Product metrics matter because you make better product decisions with them. It would be best if you had product metrics to manage the production process well and make the best decisions. The main reason is that product metrics reveal what your users are adopting about your product and especially which features. Therefore, if product marketing and product management teams make decisions and generate insights around these metrics, they can create the product that will resonate the most.
Stickiness
In the simplest terms possible, stickiness is a metric that shows how many users ‘stick’ to using your product. You can use the stickiness ratio to determine how often your product is used, observe the activity of your users, and resolve to what extent you will encourage them to use your product frequently.
How to calculate stickiness?
Stickiness is calculated as Daily Active Users (DAU) divided by Monthly Active Users (MAU). In other words, stickiness answers how long your active users remain active during the month. For example, if your product has a Stickiness rate of 35%, this shows you that 35 of your 100 users actively use your product at least once a day. Therefore, it is better to consider the Stickiness metric than focus only on the DAU or the MAU because the stickiness ratio is a more inclusive measurement consisting of these ratios.
Why is stickiness important?
A good Stickiness ratio has many advantages for your company. Increasing your stickiness is key to reducing your churn and having a successful SaaS company in the long run. In addition, increasing your stickiness rate gives you more up and cross-selling opportunities. Active use of your product is a sign of user satisfaction. User satisfaction also increases the likelihood of additional purchases and upgrades.
Retention

Retention rate measures your users’ continued enjoyment of your product. In other words, it helps you identify current users who are loyal to your product for a certain period of time. Since retaining your existing users is less costly than attracting new users, this ratio is crucial particularly in SaaS companies.
How to calculate retention
To calculate the retention rate, you need three data:
- Current users, you had at the beginning of your base period
- Total number of users you have at the end of your base period
- Users who have just started using your product in this period, that is, your new users
When we name these data as B, E, and N, respectively, the retention formula will look like this:
Retention = [(E – N) / B] x 100
For example, you have 100 users at the beginning of June. If you have 130 users at the beginning of July and 70 of these users started using your product in June, then your retention rate is 60%.
When calculating your retention rate, the most important thing is to ensure that you do not include your new users. Since the retention rate is all about determining the number or rate of users who continue to use your product, including your new users will lead to a misleading result.
Why is retention important?
According to a report by Bain & Company, if you manage to increase your retention rate by 5%, it is possible to increase your company’s income between 25% and 95%. This data alone proves how important the retention rate is for your company. In addition, while the probability of making a new sale to your current users is 60% on average, this rate is between 5% and 20% for your new users. For these reasons, a high retention rate will significantly increase your company’s revenue.
Active Users
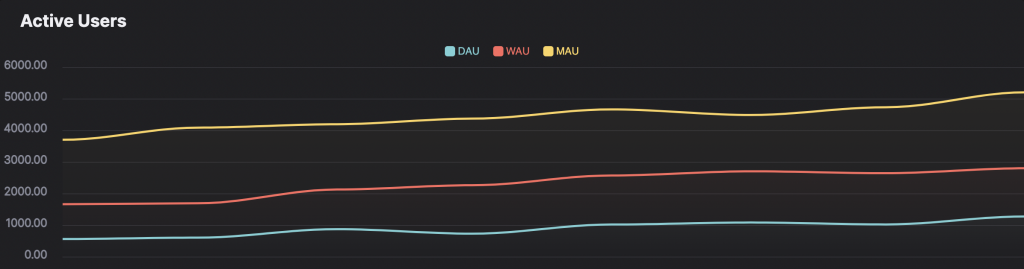
The active user metric is a metric that helps you determine the number of users who actively interact with your product during the period you specify. More active use of its product by more users is an essential criterion for a healthy SaaS company. The standards required to identify a user as “active” differ from company to company. So it all depends on the products your company puts out and the services it provides to its users.
The active user metric is generally calculated in three different ways: Daily Active User (DAU), Weekly Active User (WAU), and Monthly Active User (MAU). As their names suggest, these calculations are calculated based on daily, weekly, and monthly user activity.
How to calculate active users
You can decide on a time period to calculate your active user count and calculate it, but the easiest way is using a SaaS product analytics tool that automatically calculates it for you.
Why are active users important?
Active users are important because they indicate how critical your product is for your users. If you have achieved or if you are on your way to reaching product market fit, then your users will need to use your product more actively, preferably even daily. This will reduce your churn & allow you to get power users who will give you a good rating in NPS surveys.
Feature Engagement
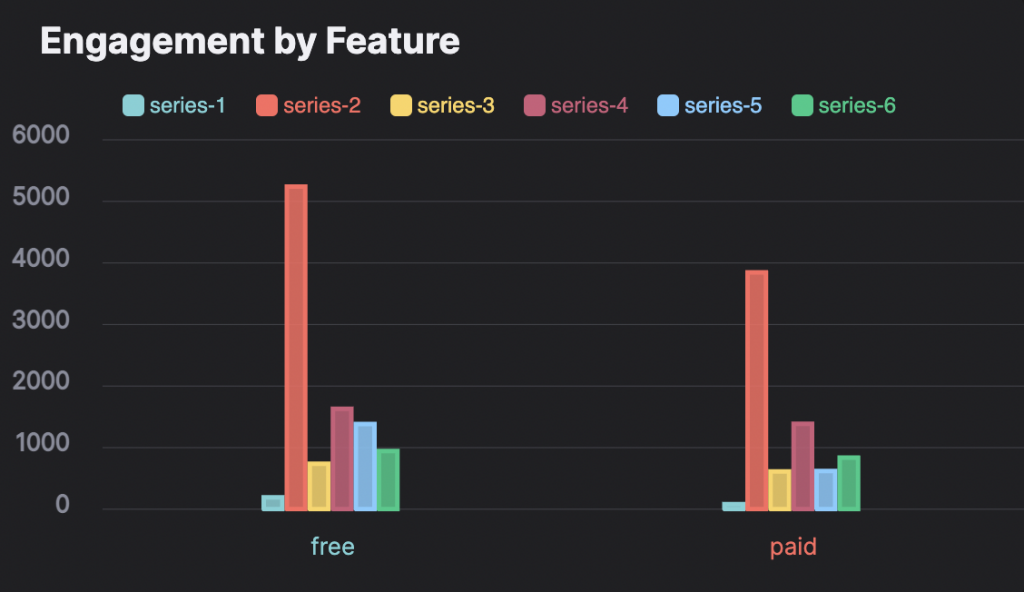
Feature engagement is a metric that helps you determine how and how often your users interact with your product’s features. In this way, you can choose which parts add more value to your SaaS company. As a result, you can improve or change the weak features of your product compared to others. If you don’t track your feature engagement, it becomes complicated to determine what strategies you need to increase the chances of prospects using your product.
How to calculate feature engagement?
Measuring the feature engagement rate helps determine how your product’s features affect engagement. First, identify a few parts of your product that you think will stand out the most and start with these features. If you want, you can also start with the features you added recently. Then, determine the percentage of users who actively use the part you have chosen daily, weekly, and monthly. Finally, you can analyze the feature engagement rate by comparing this rate with the overall engagement rate of your product.
Why is Feature Engagement important?
Feature engagement is essential for identifying which features make users engage more and which parts are relatively weak for engagement. After determining this, you can analyze the reasons for the success of the features that users are most in-demand and decide which strategy you should follow to improve the features that are not used much.
Feature Adoption Rate
Feature adoption is a metric for measuring the usage of certain features of your SaaS product. This metric makes it easy to determine which features of your product bring you the most loyal customers and which component is not preferred.
If you want to learn more about Feature Adoption, check out this article.
How to calculate the feature adoption rate?
To measure the feature adoption rate, you should implement the feature adoption funnel. The feature adoption funnel has four phases:
Exposed is the stage where your users interact with the feature you specify.
In the Activated phase, users activate this feature.
In the Used step, users actively use this feature once.
Finally, Used Again is the phase where users are using this feature repeatedly.
Why is Feature Adoption important?
Feature adoption indicates how much value your user base gets from a feature. If your users are interested in and use a product, some elements in this product may not be used very often. In such a case, new users may not be aware of this feature. Or this feature may not add value to them. Either way, you need a new strategy to help users find out about these features or realize the utility in them. Feature adoption helps you with this. In addition, it is also effective in regulating your feature adoption retention rates. Users will continue to use a product especially if they can benefit from every feature of it.
NPS
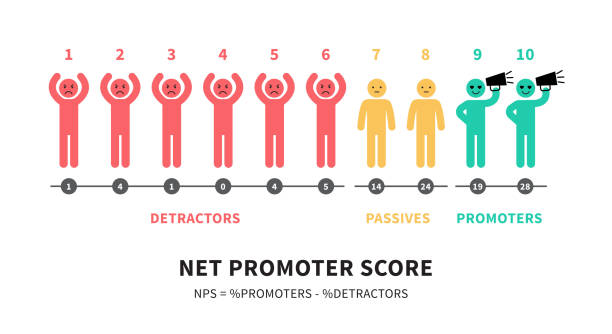
Net Promoter Score (NPS) is a metric that measures the customer experience of your users based on how likely they are to recommend your product to others. With this measurement, you can determine how loyal your user audience is to your product and draw a path accordingly.
How to calculate NPS?
NPS is measured by how much your users recommend you to others on a scale of one to ten. The users are then put in three different categories: promoters, passives, and detractors. Promoters are your users who give you 9 or 10 points. These users are satisfied with your service and will likely recommend you to someone else. Passives give you 7 or 8. This group is happy with your service, but they are not entirely loyal to you. Detractors gave you a score between 1 and 6. This group will most likely not recommend you to anyone else. They are likely to denigrate your product because they are not satisfied with your service.
The NPS ratio is found by subtracting the percentage of promoters from the percentage of detractors. The NPS rate can range from -100 to 100.
Why is NPS important?
NPS is simply an indicator of your company’s growth. A product with a higher NPS than the industry average creates a positive cycle for the company, contributing to the development of your company. In addition, as your product is recommended to others by people who use it, the number of people using that product will increase day by day. According to Nielsen’s report, 92% of people prefer personal recommendations to advertisements when choosing a product. That means that the higher the NPS rate, the more potential customers.
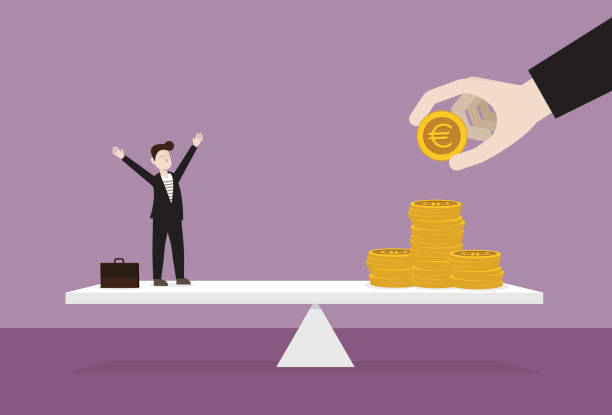
ARPU

The average revenue per user (ARPU) is a financial metric that measures the amount of profitability a product generates from each user. Especially in SaaS companies, it is beneficial for determining the profit obtained from users who benefit from different pricing.
How to calculate ARPU
To calculate the ARPU, you should first determine the period for which you want to track data. ARPU can then be calculated by dividing the total revenue generated in that period by the total number of users. Monthly periods are generally preferred for this calculation.
Why is ARPU important?
ARPU is essential for companies because it allows you to see how much revenue you generate per user on average in a certain period. Regularly calculating ARPU for your users with the lowest and highest income in SaaS companies with different pricing allows you to observe your situation in different product segments, take action accordingly, and monitor the changes in your average income from the beginning of the period.
Sessions per user
For a SaaS company, how actively its users use the website is essential data. The Session per User ratio is also ideal for determining the density of traffic on your site. A high session per user rate indicates that you have good in-site traffic. That is, users actively use your site.
How to calculate session per user?
Session per user is calculated by dividing the number of sessions by the total number of users. The average session per user ratio ranges from 1.2 to 1.6. If your balance is less than 1.2, you may need to review something about your website. If it’s higher than 1.6, you have a session-per-user ratio of more than 80% of all websites on average.
Why is a session per user important?
The session per user ratio indicates how much your website attracts users. Therefore, it is essential to pay attention to this ratio. If you have a high rate, it suggests that your website is well organized and exciting; in other words, it has been created to allow your users to use it more than once. You can determine which parts of your website users interact more actively and create a plan for other factors in such a case. On the other hand, if you have a lower session per user rate than other companies in the industry, there may be elements on your website that you need to change and fix.
Time to value
Although the time to value is often overlooked, especially in SaaS companies, it is one of the essential metrics that will help you stand out from your competitors. It’s a metric that measures the time it takes a user to get value from your product. The shorter your Time to Value, the more straightforward it will be for users to realize the value your product adds to them.
Why is time to value important?
Time to value is necessary because customers are too impatient to find what they expect, especially in the SaaS industry. They want to see what they’re hoping for as soon as possible when they sign up for a trial or make a purchase. If you want your company to be known as a reputable company that gives its users the value they expect, you should keep your time to value ratio short. If your time to value gets longer, your users can search for another solution instead of your product.
Customer Acquisition Cost
Customer acquisition cost (CAC) is a metric that expresses the expenses required to acquire a new customer for your SaaS business. CAC is often used with customer lifetime value (LTV) to measure the value your users add to the company and product. The formula for CAC is as follows:
CAC = (Sales and marketing expenses) / Number of New Customers
Why is customer acquisition cost important?
Measuring the cost of customer acquisition is especially important for increasing the return on investment (ROI). Using customer acquisition cost, you can determine which channels and products bring the most ROI at the most cost-effectiveness.
Another reason why customer acquisition cost is crucial is that using this metric correctly will increase your profit margin. Identifying the spending required to attract each user will help you identify the right product strategies that will earn you the most revenue.
Conclusion
In conclusion, the success of your B2B SaaS product depends on the results of various metrics. Although all these metrics address different aspects of your product, they cannot be considered separately from each other. In addition, data obtained with one metric can be an input for another metric. For this reason, if you want to ensure the success of your product, it is vital to give importance to these metrics and create a strategy according to the results of these metrics.
FAQ
B2B SaaS stands for Business to Business Software as Service. B2B SaaS products usually consist of cloud-based software that will work in various fields such as CRM, accounting, and data visualization.
KPIs (Key Performance Indicators) are indicators used within the target framework that you will use to help your companies achieve their long-term goals. It enables you to define your strategy and focus on that strategy. On the other hand, metrics monitor your company’s business processes. Standard business metrics that do not rely on a critical metric.


