Churn Rate vs Retention Rate: An Ultimate Guide
Do you want to make long-term plans for your company’s subscribers? Would you like to know through which metrics you can analyze your user base?
In this article, I will discuss your users’ churn and customer retention rates. Understanding these terms is essential for SaaS marketing.
What is the difference between churn rate and retention rate?
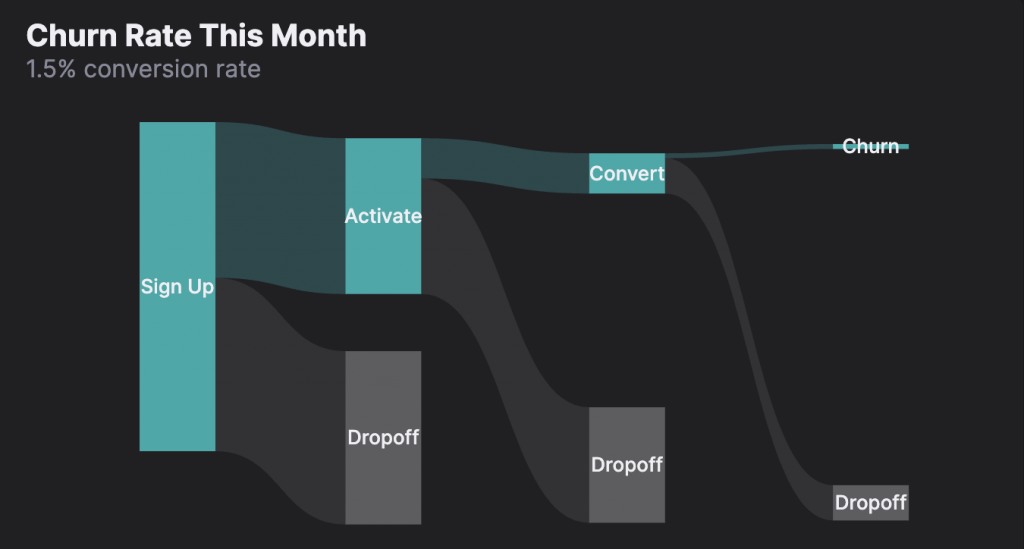
Customer churn rate is the rate of people that sign up for your product and then leave in a given time. On the other hand, the customer retention rate is the rate of people subscribing to the service you provide.
As you can see, the customer churn rate is harmful since it refers to the number of people who do not subscribe to your service. On the other hand, the customer retention rate refers to the people that actively subscribe to your services.
Increasing your user activation rate will reduce your customer churn rate and increase your retention rate.
However, you must note that utilizing professionals like HockeyStack is the surest way to increase your retention rate.
Metrics you should track to calculate churn and retention rate.
Before calculating your churn and retention rate, you must learn the basic terminology related to the subject. Here is a shortlist of product management metrics that you can use to track your churn and retention rates:
Customer Lifetime Value
Customer Lifetime Value (sometimes referred to as CLV or LTV) is the net profit you can have related to your entire business relationship with your customers. This term helps determine which customers would benefit in the long run.
Repeat Purchase Ratio
Repeat Purchase Ratio, also called RPR, refers to the ratio of customers returning to your service provider’s services again. That is interlinked with your customer’s lifetime value. Although this term was first used for products, it applies to services on a subscription model.
Net Promoter Score
Net Promoter Score, sometimes referred to as NPS, is the possibility of your customers recommending your services to other individuals. That is related to your user activation rate and your marketing strategies.
Average Order Value
Average Order Value often referred to as AOV, is the average spending one customer makes through multiple purchases. That enables you to detect customers for whom marketing would be more profitable.
Time Between Purchases
Time Between Purchases is aimed at calculating how often a customer decides to employ your services. This allows you to measure how happy your customers are and are inclined to try your competitors.
Loyal Customer Rate
Loyal Customer Rate refers to the number of people that have purchased your services within a time. The difference between this with the repeat purchase ratio is the time you set for calculating this metric.
Individual marketing technics like email marketing is essential for increasing your loyal customer rate.
Customer Growth Rate
Customer Growth Rate refers to how much your customer base has grown within a given period (days, weeks, months). This rate depends not only on how many new customers you can reach but also on how many existing customers you can retain.
Share of Wallet
Share of wallet, often referred to as SOW, is the monetary amount your customers share with you instead of your competitors in the same sector. You can increase this metric by providing multiple services and options and gain an edge over your competitors.
Customer Acquisition Cost
Customer acquisition cost refers to the average price of gaining a new customer. This calculation is usually done annually but can be done quarterly if desired. This is a term that is useful for both marketing and sales departments.
Engagement
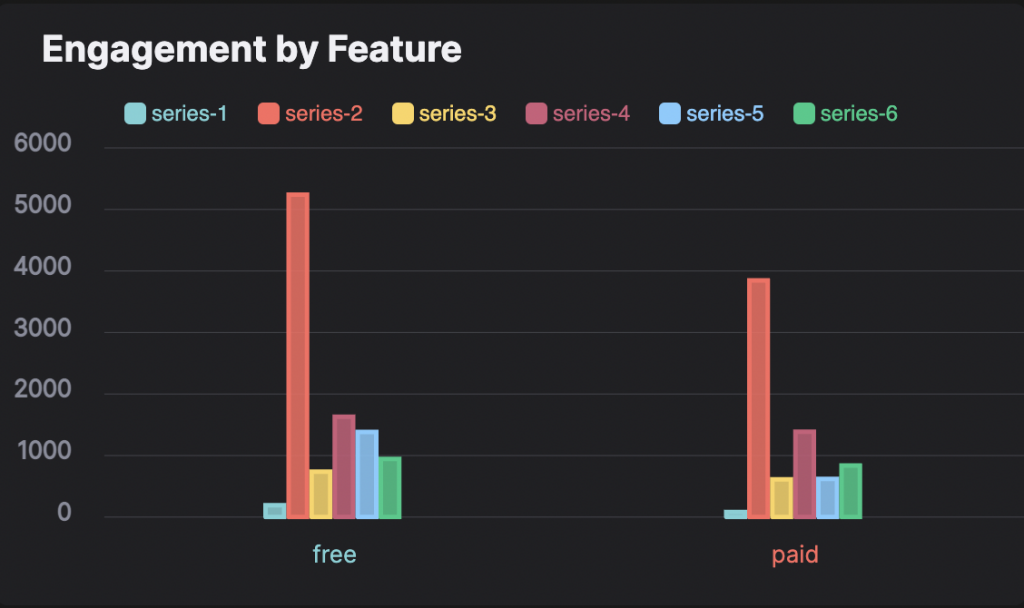
The number of critical actions like subscribing or creating an account is defined as engagement. This metric should be at the center of your marketing strategy. This metric is directly related to your user activation rate and active subscriptions.
How to Calculate Churn Rate
Before calculating your user churn rate, consider how often you need this calculation. It is more sound to measure it more often, even daily, for a relatively big company with a more extensive user pool. However, a smaller company that works for a smaller user base can utilize two to three calculations per year.
There are multiple ways to calculate your user churn rate, and picking the most useful one for your service is vital for accurate results. Utilizing the correct method will enable you to:
- Be precise with your user churn and retention rate calculations.
- Plan your long-term goals.
- Increase your marketing reach through accurate planning.
The Simple Way
The simplest way to calculate your user churn rate is to divide the number of churned users you have in a certain period by the number of users you had at the beginning of the said period. We can formularize the said calculation like this:
I will put some examples below to explain how to calculate the user churn rate in this way:
| Churned Users | Total Number of Users | Churn Rate |
| 100 in a year | 1000 at the beginning of the year | 10% Annually |
| 200 in a month | 4000 at the beginning of the month | 5% Monthly |
| 10 in a day | 1000 at the beginning of the day | 1% Daily |
There are specific pros and cons to this method. One important pro is that it is straightforward. You need to have only two types of data, your total number of users and the number of churned users, to calculate your churn rate.
However, this simplicity brings with it specific problems. If you are a new competitor in the industry, this calculation method can overlook the number of activated users who decide not to use your service any longer. This can also be the case for companies with a higher marketing reach.
In the case of a company with a solid base growing at a specific rate, this might not be a problem. However, You must note that a company at a higher level will probably want to calculate its user churn rate according to some other metrics. This is where different ways of calculation come in.
The Adjusted Way
The adjusted way takes the rapid growth within a month due to special reasons to calculate your Churn rate. This is especially important for services that can see a seasonal boom.
Calculating your churn rate is dividing the number of your churned users by the average number of users you have had in a certain period. The average number of your users is calculated by adding them on the first and last days of the given period and dividing it by two.
It must be noted that this way of calculation is best used at monthly levels. Using it daily, weekly, or yearly might not be as used every month.
We can formularize the said calculation as follows:
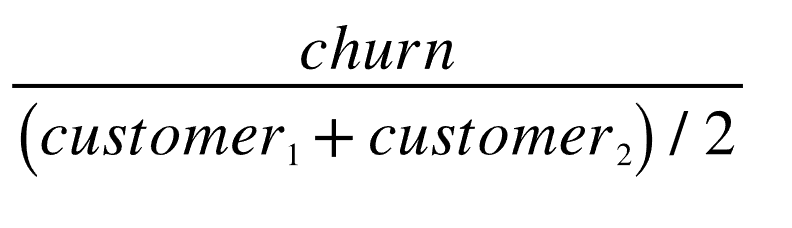
I will put down a three-month user churn rate calculation according to the adjusted way:
| March | April | May | |
| Existing Customers | 10000 | 10050 | 10200 |
| Existing Churn | -100 | -150 | -375 |
| New Customers | 200 | 1000 | 400 |
| New Churn | -50 | -225 | -25 |
| The net number of Customers | 10050 | 10675 | 10200 |
According to the adjusted way for user churn rate calculation, the statistics would be as below:
March-April: 125/10025=0,014
April-May: 375/10125=0,037
These statistics show that the percentage of churned users has more than doubled in one month.
The Predictive Way
You must note that calculating your churn rate can affect your planning for the future. Thus, a new model regarding how to make predictions regarding the future was developed.
This method also takes into account how many inactive customers you have. This is especially useful for calculating your active number of users and how to increase the ratio to increase your user activation rate.
Here is a model explaining how this calculation is done:
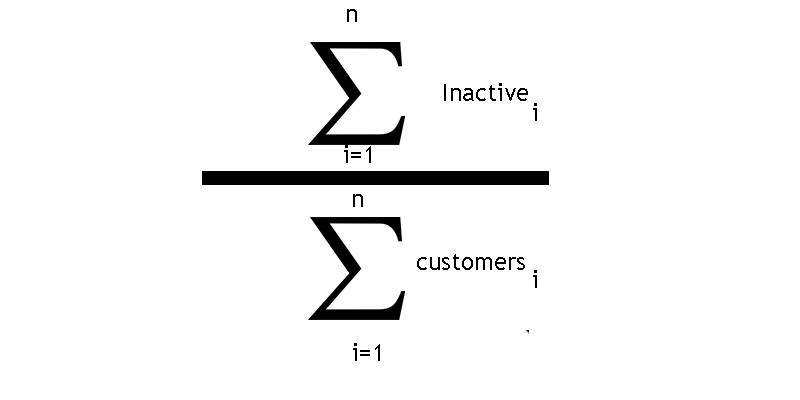
Inactive customers represent how many customers are active on day one while not busy on the n+1 days. You can decide how many days it will be. If you have two thousand customers on March 1 and want to see how many of these customers will churn away on April 1. You need to divide these numbers by the number of customers in March.
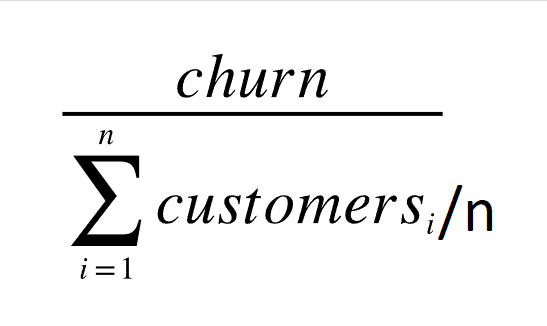
The Shopify Way
A churn number affected by the growth number is prone to misinterpretation. Therefore, Shopify has developed a new method to overcome this problem.
This method works especially with SaaS companies that experience high growth rates for specific periods or companies that recently got established and experience a boom due to this fact.
The calculation process for this is relatively simple. First, one has to divide the number of users that have churned by the sum of the number of users in a certain period which is again divided by the number of days in a certain period.
I know that many calculations are mentioned, and they look scary. So I will put another model for you to understand the process better.
What’s a reasonable churn rate?
According to multiple pieces of research, average user churn rates range from 2%-10%. Thus the companies would want to have the churn rate around the lower end of this spectrum and consider this good.
However, you must consider that your establishment’s churn rate will depend on many factors ranging from the type of service you provide for them to the target audience. Here are some examples of leading companies’ churn rates:
2. Hulu has an average churn rate of 4.9% monthly, according to the statistics.
3. According to statistics, Disney+ had an average churn rate of 2.3% in late 2020
Note that these are the leading companies in their respective sectors, and even these companies see fluctuations in their churn rates from time to time. Therefore, it is normal for an average service provides to see different churn rates and experience fluctuations.
How to Calculate Retention Rate?
The retention rate is the number of people that use your services after a certain period. You can think of this as the opposite of your churn rate. You need this statistic to increase your user activation rate as high as possible.
N-day retention
N-day retention refers to the users who return to the service you provide them after a specific number of days. For example, if only a quarter of your users returns after three days, your 3-day retention is only 25%.
Do not forget that you can decide when to start your n-day. It can be the day when users downloaded your app; it can be when they applied for a subscription. This is entirely up to you.
This is especially important if you want to calculate your user retention rate for a certain period. For example, companies that provide services that experience a seasonal boom can benefit from this method.
Here are some N-day user retention calculation examples:
| Number of Users at the N-day | Number of Users on Day 1 | Number of Users on Day 2 | Number of Users on Day 3 |
| 1000 | 500 | 400 | 300 |
| 1200 | 400 | 300 | 200 |
| 500 | 400 | 250 | 100 |
According to these statistics, the 2-day retention rate for the first company would be 40%, while its 3-day retention rate would be 30%.
The second company has a 1-day retention rate of 33%, a 2-day retention rate of 25%, and a 3-day retention rate of 16%.
The third company has a 1-day retention rate of 80%, a 2-day retention rate of 50%, and a 3-day retention rate of 20%.
Pros:
- Precise.
- Easy to calculate.
- You can use it comparatively.
Cons:
- It is limited to daily calculations.
- Can not calculate long-term trends.
- Prone to misinterpretation.
Unbounded retention
Unbounded retention is aimed to show you the percentage of users who return at a date or any time after that designed date. This is especially useful if your service does not rely on daily interaction.
This is the inverse of your churn rate. So adding your unbounded retention to your user churn rate will equal your entire user base.
However, this method comes with specific problems. One of the most important is that following unbounded retention for a long time might result in overlooking the different seasonal trends in your work field.
Pros:
- Helpful in making generalizations.
- It can be beneficial for services that do not rely on daily interactions.
Cons:
- Prone to overlooking seasonal trends.
- Not valid for short-term analysis.
- Not suitable for services that rely on daily interactions.
Bracketed retention
Bracketed retention is a combination of N-day retention and unbounded retention since it enables you to pick two dates and calculate the user retention rates between this period. This method will allow you to calculate your user retention rates daily, weekly, or even monthly.
To calculate your unbounded retention rate pick a date and add every user who uses your service afterwards. Here are some possible periods you can choose to calculate your unbounded retention rate for your users:
- 1-7 Days (Short Term)
- 7-30 Days (Mid-term)
- 30-60 Days (Long-Term)
What is a good retention rate for SaaS?
In SaaS marketing, a net revenue retention rate above 100% is considered good. However, the median net retention rate is around 100%, while SaaS companies that operate for medium and small businesses aim for about 90%. This is usually tied to the limitations of the sector they operate in.
The highest net revenue retention rate is attributed to the Enterprise SaaS, around 125%. By checking out SaaS Content Marketing Examples from the biggest SaaS companies, you can adapt their tactics to improve your user retention rate.
Conclusion
SaaS companies need to understand their user metrics to react to changing times more efficiently. Evaluating your user retention and churn rates with the help of professional companies like HockeyStack is principal to succeeding in the field you are operating in.
FAQ
SaaS companies’ ideal annual churn rate varies between 5% and 7%. On the other hand, this rate is between 10-15% for early start-ups.
Factors such as average subscription length, customer acquisition cost, and lifetime value greatly impact companies’ churn rates.
When the new revenue from your customers surpasses the revenue you lose from cancellations and downgrades; you have a negative churn rate. A negative churn rate should always be an important priority for your SaaS service provider.
Yes, they are the opposites of each other. Although applying the calculation methodology of both is useful for analyzing seasonal effects that affect your user base. However, note that this opposition is closely related to how one calculates user churn and retention rates.
Your customer retention rate is the percentage of people that keep using the services you provide after a certain period. There are different ways to make the calculation and the rates can change drastically depending on the method you utilize.


