Top 9 Customer Analytics Tools & Software for 2022
Customers are a business’s top priority. If you don’t gather and analyze data about your customers, you’ll be missing out on important insights that can help you satisfy their needs better.
With customer analytics tools, you can identify, attract and retain the most profitable customers. These analytics tools help you make sense of your customer data and find out the most desirable customers, reduce churn, and increase customer engagement.
In this article, I’ll introduce you to the top customer analytics tools, their key features, and user reviews to help you make an informed decision for your business.
Qualtrics

Qualtrics is a web-based research software that is used for conducting survey research. It helps you design, distribute and report surveys easily. By analyzing the results, you can gain insight into consumer preferences and make your business more customer-centric.
Features
1. Sample Surveys and Question Types
Qualtrics offers an abundance of sample surveys that you can customize and question types that you can choose from. Types of questions include matrix table questions, rank order questions, loop & merge questions, and more.
2. Email Messages
Besides tracking respondent participation, Qualtrics lets you send invitations and reminders to participants through the Email Messages (EX) feature.
3. Raw Data Exports and Visualizations
You can easily export raw data in various formats and use visual statistic representations for your data.
Pricing
The pricing of Qualtrics is subscription-based. Prices of packages range from $1,500/year to $5,000/year. How much you pay depends on factors such as the features you use, the number of team members using the software, and the size of your business.
There is also a free trial for 30 days that includes 300 responses, unlimited questions per survey, three active surveys, and 22 question types.
Reviews
- Syed R., a research assistant at an enterprise, says that what he likes most is the ease of use, UI/UX, design, and versatility. He writes,
“The software is easy to learn and intuitive. The design is easy on the eyes and in line with modern websites which gives it a nice feel and makes it pleasing to use. The software is also versatile, as we use it to keep track of research participants, administer surveys, and create unique consent forms for participants.”
- John G., who is the owner and CEO of a small business, says:
It’s a bit expensive compared to other competitors in the market. This price always seems to be rising each year without much change or improvement to qualtrics itself.
- James K., an owner of a small business, writes:
“Qualtrics software has an amazing user experience, with loads of templates that make it easy for me to develop my surveys.” and “The mobile app version of Qualtrics does not work very well when you use it to collect data offline.”
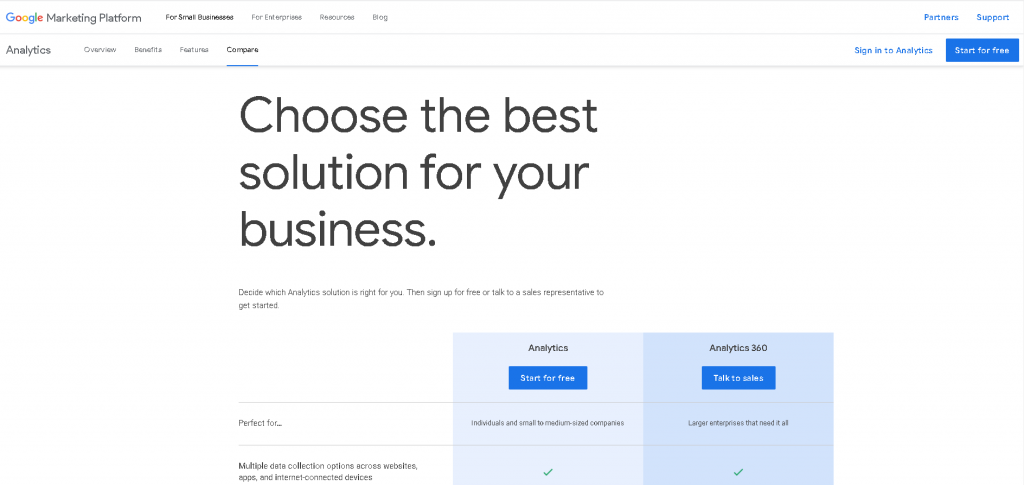
Google Analytics
Google Analytics (GA) is the most commonly used web analytics software. It was launched on November 14, 2005, after Google acquired Urchin (developer of the tool).
GA provides insights on website traffic and visitor behavior. This includes how users interact with your content and how many of your visitors convert. It also produces reports to help you evaluate the performance of marketing campaigns and track conversions and purchases.
Features
1. Automatic Data Collection
GA starts to automatically collect data once you add a piece of Javascript code to your website. Once a user visits a page with the code, it tracks data and sends it to GA. The reports of the data are also immediately accessible.
2. Reporting and Visualization
GA auto-generates reports for different uses. There are advertising, audience, behavior, real-time data, and conversion reports. With visualization features, you can create chart representations for reports to make data analysis easier and share with your team.
3. Integrations with Tools and Platforms
GA can easily be integrated with other Google products and partnered products to increase efficiency. Some useful integrations include Google Ads, Shopify, Facebook, Google AdSense, Search Ads, and Data Studio.
Besides the desktop application, GA can also be used on mobile and tablet through its app.
Pricing
The standard version of GA is free, and it provides all the features needed for small and medium-sized companies.
GA 360 is the paid version suitable for large enterprises that need features such as higher hit limits, segment overlap, and custom funnels.
Reviews
Users have mixed reviews about Google Analytics. Here are some of them:
- Caitlin O., a foundations and grants manager at a mid-market business, wrote:
“I like how easy it is to change date ranges to view sets of data with google analytics and easily translate these to visuals. I also like how easy you can integrate google analytics with other platforms.”
- Matt L., who is a database manager at a mid-market company, says:
“The report options sometimes are limited. They don’t dive into demographics maybe as much as you would like them to. I also think the mobile version is harder to use than some other platforms.”
HockeyStack
HockeyStack is a no-code analytics and attribution tool for SaaS companies. HockeyStack can help you uncover the entire user journey all the way from the time someone discovers your product to when they make a purchase and beyond.
The best part about the tool is that visualizations are possible without connecting to any third party tools. This means that whether you’re planning to create a funnel mapping out all of the touchpoints of each user segment or get a complete breakdown of the top pieces of content that drive revenue, it’s all possible with HockeyStack.
Here are some questions that you can get answers to with HockeyStack:
- How many users ended up on a blog series?
- How effective was internal linking in the progression of the customer journey?
- How many users dropped off after the free trial?
and more.
By providing answers to these questions, HockeyStack allows SaaS businesses to get rid of fragmented data and start understanding what really affects their revenue.
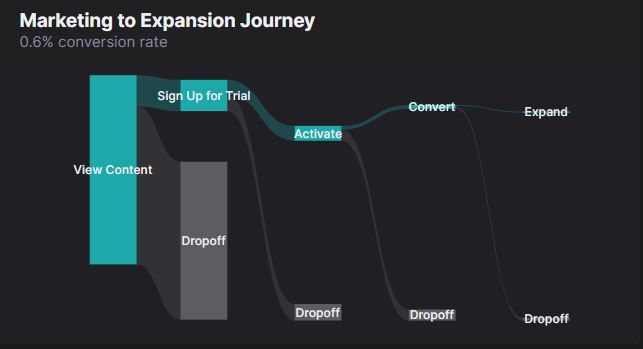
Let’s take a look at some of HockeyStack’s dashboards in action:
Here, we have a funnel showing how many users drop off after each stage in the journey.

You can also find out how many signups were driven by each piece of content:

You can even view a complete marketing to expansion journey: without typing any code or connecting to any additional tools
HockeyStack’s Features
HockeyStack comes complete with a number of features and capabilities including:
- Step-by-step user journeys to analyze points of friction and optimize the user journey
- Custom dashboards to improve visualization of data
- Funnels and goals to track each microconversion
- Insights to understand key elements of your data
- Surveys to gather customer responses and uncover their true opinions regarding your products and services
- Revenue analytics to identify which channels and pieces of content drive revenue
- Segments to group customers based on similar traits such as behavior or demographics
and more
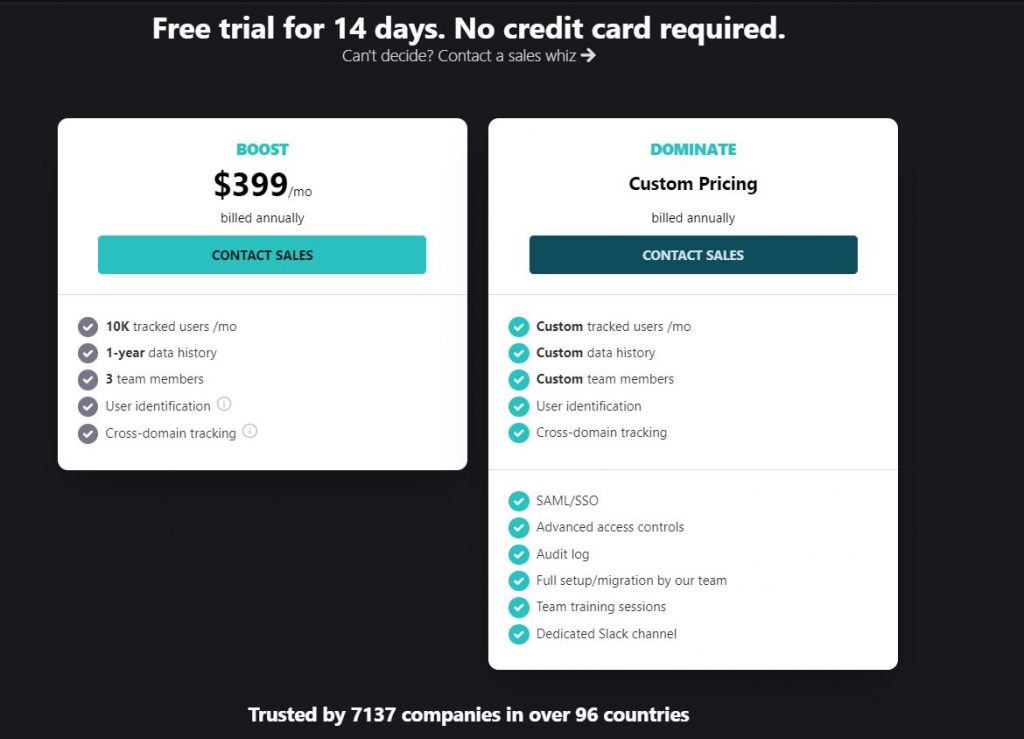
HockeyStack Pricing
HockeyStack two plans, both of which have a 14-day trial with a 30-day refund guarantee.
You can check out the pricing page here.
HockeyStack Integrations
- Paddle
- Stripe
- Hubspot
- Pipedrive
- Mailchimp
- Crisp Chat
- Salesforce
- Zapier (coming soon)
Kissmetrics
Kissmetrics is a product and marketing analytics tool that provides behavior-based analysis to help you understand users. It emphasizes that data is more than just numbers that are represented in a chart and presented to your boss. Each number is a representation of something, such as a user or action, that is important for your key metrics and overall business growth.
Kissmetrics was founded by Neil Patel in 2008, and it is based in San Francisco, CA.
Features
1. Key Metrics
You can easily see important metrics such as new trial starts, new subscriptions, churn rate, trial to signup conversion rate, and MRR.
2. Populations and Cohorts
Kissmetrics lets you track power users and discover the features they use the most, determine the best customers and track other cohorts.
3. Customer Activity Reports
The reports give you information such as most viewed pages, feature usage over time, and features being used by different customer plans.
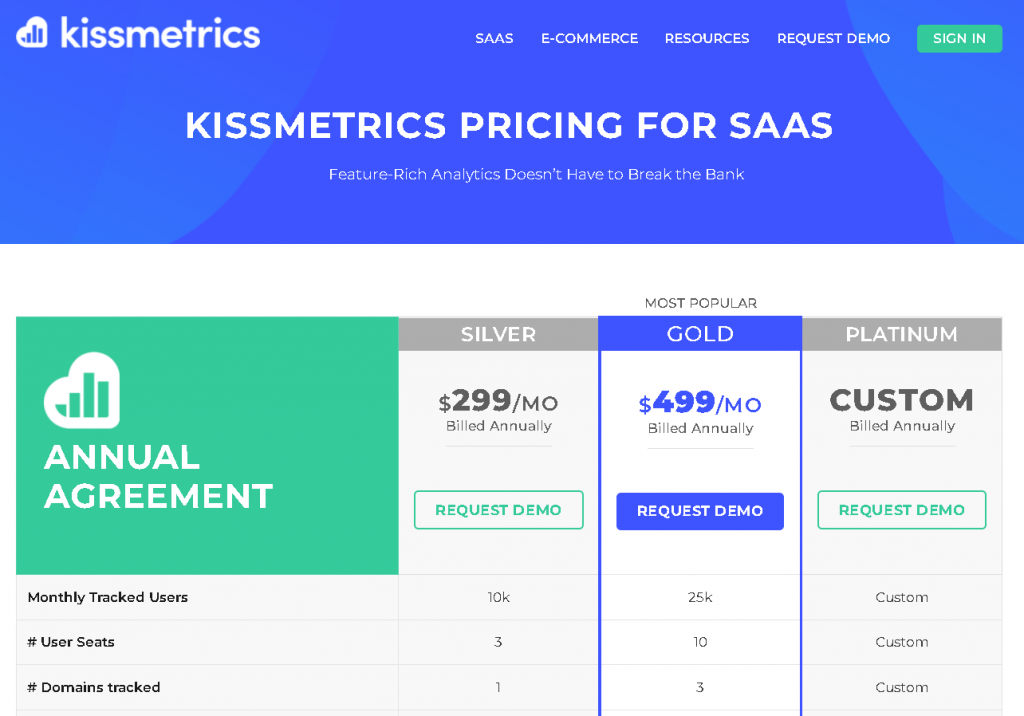
Pricing
Kissmetrics offers a free trial and three pricing plans.
The most popular is the Gold plan, priced at $499/month. It tracks 25k users monthly and has 10 user seats.
The Silver plan tracks up to 10k users for $299/month and has 3 user seats. Kissmetrics also provides a custom plan.
Reviews
- Santiago C, digital marketing manager at a small business, writes that the main reasons he recommends Kissmetrics are
“1. How easily you can change from first touch to last touch attribution. It has never been so easy to discover the origin of a visit versus assisted conversions.
2. How you can fully understand groups of users behavior with the populations’ report.”
And what he dislikes about the tool is,
“The fact that everytime you want to export a report (which you do most of the time), you need to wait for an email. This makes things super slow.”
- Tamara A., software developer at a small business, says that Kissmetrics has “easy API”, it’s “easy to add data” and “live feature is awesome”. She also adds that it’s “not easy to do reports on metadata fields”.
Sprout Social

Sprout Social is a social media management tool founded in 2010 by CEO Justyn Howard. It helps businesses manage customer interactions and obtain actionable insights. Users can publish content, track and analyze their social presence, and engage with their audience.
Features
1. Social Media Publishing
The editor tool on Sprout Social is used to create text and image-based content that you can post on social media platforms. You can also store text, images, and videos in the asset library and import them into the editor. Sprout Social also has a calendar used to view future posts by channel and date.
2. Social Media Engagement
Sprout Social offers engagement features for more effective community management and customer support. An example is the Smart Inbox, which is a platform that gathers all recent activity on your social media channels into a single stream. It can be used to respond to messages from customers, turn messages into tasks and mark them as complete.
3. Social Media Analytics
The reports and metrics offered by Sprout Social help monitor the performance of your social media programs. There are performance reports, competitor reports, engagement reports, and team and task reports that measure performance in different areas.
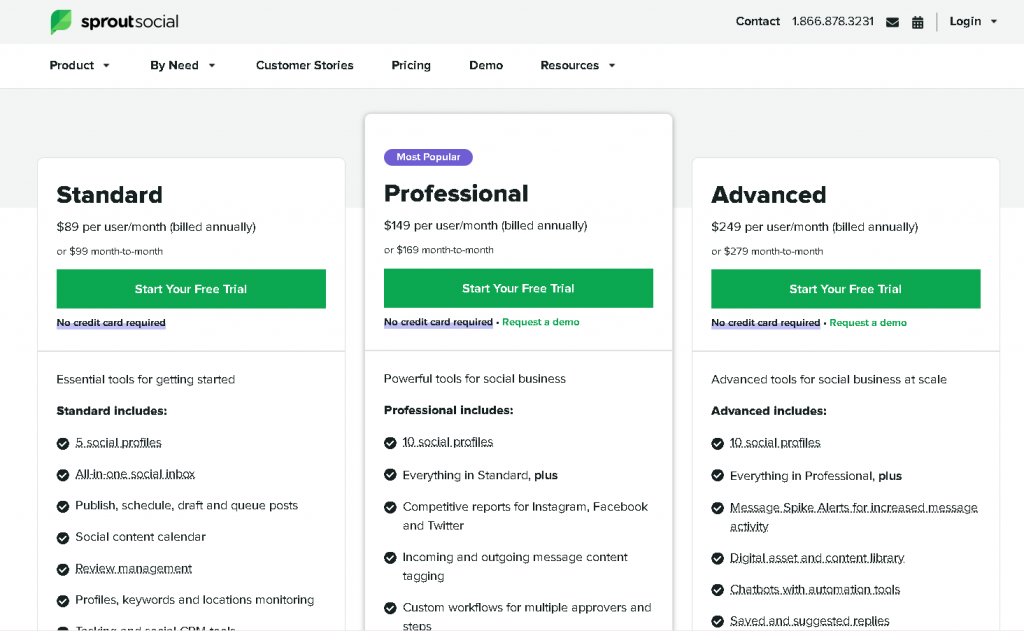
Pricing
Sprout social pricing starts with the Standard Plan from $89/user/month to manage 5 social media platforms. The Professional plan manages 10 social media platforms and costs $149/user/month. For advanced tools, there is the Advanced plan that costs $249/user/month.
Reviews
- Hrag S., digital marketing manager of a large company, writes,
“I like the scheduler the best, it is better than the free one that comes with Facebook/Instagram and supports so many other platforms. I feel like this is definitely their strongest feature.”
Moreover, he writes,
“The reporting really needs a ton of work. For example, they made us upgrade to the most expensive premium package in order to be able to split organic vs paid traffic data. However, on Facebook, our paid traffic data is still polluting out organic data.”
- Jessica G., account executive at a mid-size company, says,
“I’m getting great benefits from using it frequently for advertising space and the idea of getting clients; we always do multiple advisories on how to manipulate campaigns. Sprout Social’s support is fast, efficient, and attentive.”
She adds that
“It would be easier for new users to adopt internal guides to orient them and save time in continuous training.”
Intercom

Intercom is a customer communications platform founded in California in 2011 by Irish designers and engineers Eoghan McCabe, Des Traynor, Ciaran Lee, and David Barrett.
Intercom helps strengthen customer relations through features such as bots, apps, and product tours. It offers conversational support, engagement, and marketing solutions for early start-ups, small businesses, and enterprises. It has integrations with over 300 apps.
Features
With Intercom, you can have access to key features such as the Live Chat, Support Bots, and Product Tours.
1. Live Chat
The Live Chat feature of Intercom enables you to chat directly with customers and saves chat history so that customers can come back to it later.
2. Support Bots
The Resolution Bot offered by Intercom resolves 33% of common questions. It uses machine learning so that customers can get answers when your team is offline and provides suitable answers to new and repeated questions.
3. Product Tours
Intercom also offers code-free product tours with interactive guides to onboard users to your product.
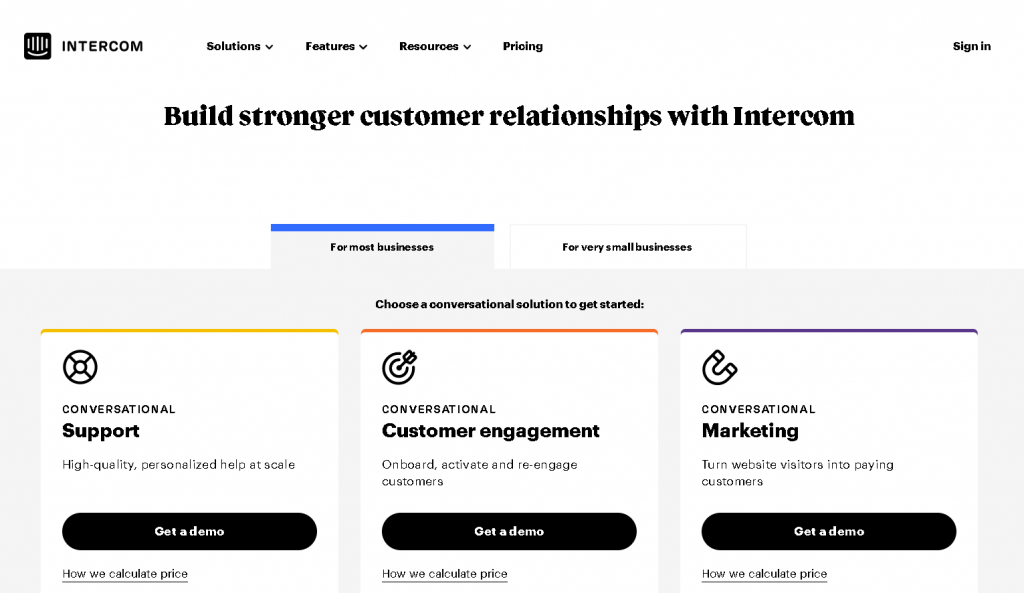
Pricing
There are 3 solutions offered by Intercom: conversational support, conversational customer engagement, and conversational marketing. Each solution and its available add-ons have pricing based on the number of seats and people reached. Seats give teammates access to different features, and people reached are the number of unique people you’ve reached in the past month through Outbound messaging.
To better understand how pricing works, you can check this guide by Intercom.
Reviews
- Alejandro D., COO of a small business, says,
“The UI is very nice. It’s easy to use and easy on the eyes. We use Intercom mostly for customer support, to send push notifications, and to send emails. All of these functionalities work really great.”
- Jacques R, customer success manager of a small business, writes,
“Powerful tools for communicating efficiently. Support inbox is brilliant and new messaging series function helps orchestrate messaging campaigns.”
- A user in IT and services writes,
“It isn’t easy to build custom, fixed segments. This is something that I’d like to do without using the public API. It would also be nice if the Intercom Messenger were less intrusive. We have had to design around it, which hasn’t been a great experience.”
Zoho CRM
Zoho CRM is a customer relationship management platform founded in 1996 by Sridhar Vembu and Tony Thomas. It is headquartered in Tamil Nadu, India.
Zoho offers sales and marketing automation tools. It is a cloud-based tool suitable for small, medium, and large businesses. It offers real-time reports and insights to measure sales performance and conversational AI to find information from CRM data.
Features
Some of the most prominent features of Zoho are sales team automation, platform customization, and marketing automation.
1. Sales Team Automation
Zoho automates routine sales, marketing, and support processes. These include scheduling sales appointments, tracking contacts, and keeping updates on sales opportunities.
2. Platform Customization
Another key feature of Zoho is the customizability variety it offers for various applications. You can customize the layout for different processes, customize filters and views to find CRM data you need, perform test customization to language localization, and more.
3. Marketing Automation
The marketing automation tools offered by Zoho help increase leads generated from your marketing campaigns through marketing communication tools.
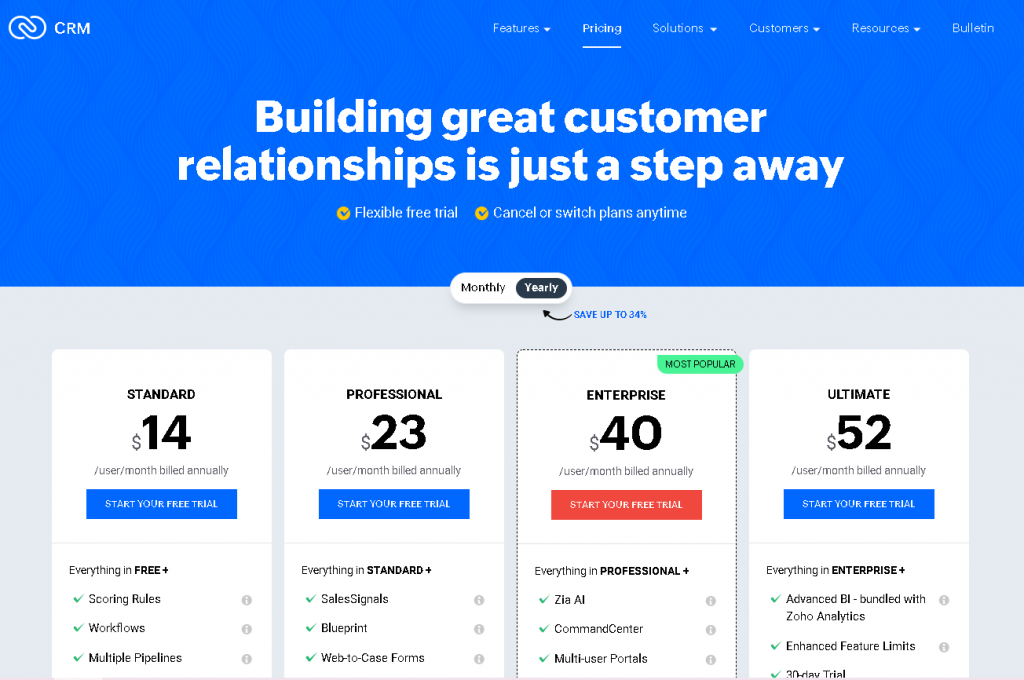
Pricing
Zoho has a free plan for 3 users, which has limitations on the number of custom lists and email notifications.
For additional features such as sales forecasting and schedule reports, you need the Standard plan that costs $14/user/month.
The Professional plan costs $23/user/month. It has more advanced features such as higher customer fields/modules and unlimited custom reports.
The Enterprise plan costs $40/user/month and includes everything in Professional plus additional features such as Zia AI.
The Ultimate Plan, priced at $52/user/month, offers full reporting features and customization options.
The prices mentioned above are what you’ll pay if you choose to pay yearly. You can also choose to pay monthly, but it would be more costly.
Reviews
- Mark G., director of operations at a small business, writes,
“Zoho CRM is cost effective and fully integrates into my Google Suite (calendar, mail, etc). All information flows in either a 2-way or 1-way synch, depending on my personal needs. It also integrates with our in-house portal, which houses partner information. Reports are easy to run and save as well as filter based on specific needs.”
- Akib P., business development lead at a mid-size company writes,
“Probably due to the complex code behind the UI sometimes it feels sluggish and takes time to respond to things. Also, the Mobile app doesn’t allow for full access to the features available on the desktop version.”
Omnisend

Omnisend (formerly Soundest) is an all-in-one marketing automation platform for e-commerce businesses. It was established in 2014 by Rytis Lauris and Justas Kriukas.
The core strengths of Omnisend are its advanced email marketing capabilities. It offers various email templates and sends automated, relevant emails to customers. Omnisend has integrations with e-commerce tools such as Shopify, Shopify Plus, Bigcommerce, Magento, and WooCommerce.
Features
1. Advanced Email Marketing
Omnisend allows you to integrate multiple channels such as email, SMS, and web push notifications within the same automation workflow for seamless communication. It also has pre-built messages to welcome, confirm orders and shipping information, etc.
2. Reports
Omnisend generates performance reports and advanced reports. Performance reports are campaign and automation reports and built-in message reports that help you determine sales drivers. Advanced reporting shows you the KPIs, best performers, and performance across channels.
3. Segmentation
With segmentation features, you can segment customers based on customer lifecycle, average order value, and purchases.
Pricing
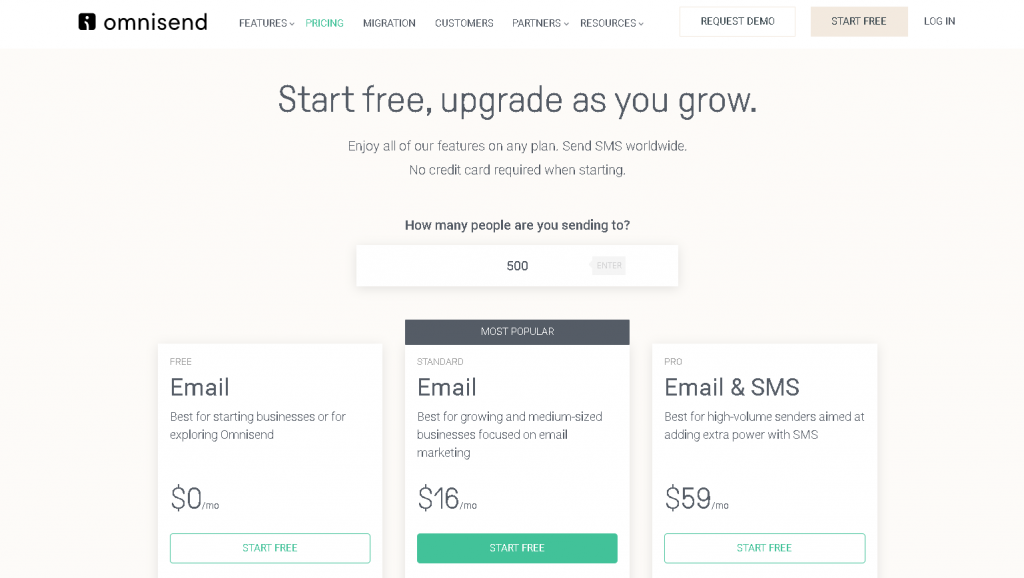
With Omnisend’s Free plan, you can send up to 500 emails and 500 web push notifications per month.
The costs of the Standard Plan and Pro plan depend on the number of messages you send per month.
The Standard plan starts at $16/month. The Pro plan has unlimited email sends and starts at $59/month.
Reviews
- Andy. E, a digital marketing analyst of a small company says,
“Omnisend offers us the ability to upload a large number of contacts to our account and create in-depth automation workflows at a low cost. For our business, having the ability to retargeting job seekers via email on a consistent basis has been a game changer for our team.”
- Mary W., content marketing manager of a small business, writes,
“I’d love to be able to create custom landing pages that we could link to when running campaigns. I also dislike that the price of plans significantly increases when adding subscribers.”
Zonka Feedback

Zonka Feedback is a feedback collection software. It allows you to easily create, distribute, and report on surveys. You will receive detailed real-time reports complete with graphs and analysis. You can browse, filter, and save reports. As a user, you can tag your responses, assign tasks to the team, and close the feedback loop. By reviewing the analytics, you can contact dissatisfied customers, take action, and prevent churn.
Features
1. NPS reporting and dashboard
With Zonka Feedback you can plan daily, weekly, and monthly feedback digests that include a thorough overview of the replies received, a score, and CX Metrics (NPS, CES, and CSAT) so that you can keep informed. You can view the total NPS for each question option and conduct an in-depth Feedback Analysis based on your customer loyalty score.
2. Reporting and analytics
Zonka Feedback allows you to view the performance of your metrics over time, including Net Promoter Score, Customer Satisfaction Score, and Customer Effort Score, on a weekly, monthly, quarterly, and yearly basis. You can also use the Trends Report to track and improve existing processes and services by analyzing growth and scores over time.
3. Collecting feedback
With Website Surveys, you can collect post-transaction, exit intent, and general website visitor feedback. Email surveys and in-signature emails can be triggered by using the Feedback button, a link, or embedded questions. SMS Surveys also allow you to reach out to any customer with a smartphone and get real-time feedback.
Pricing
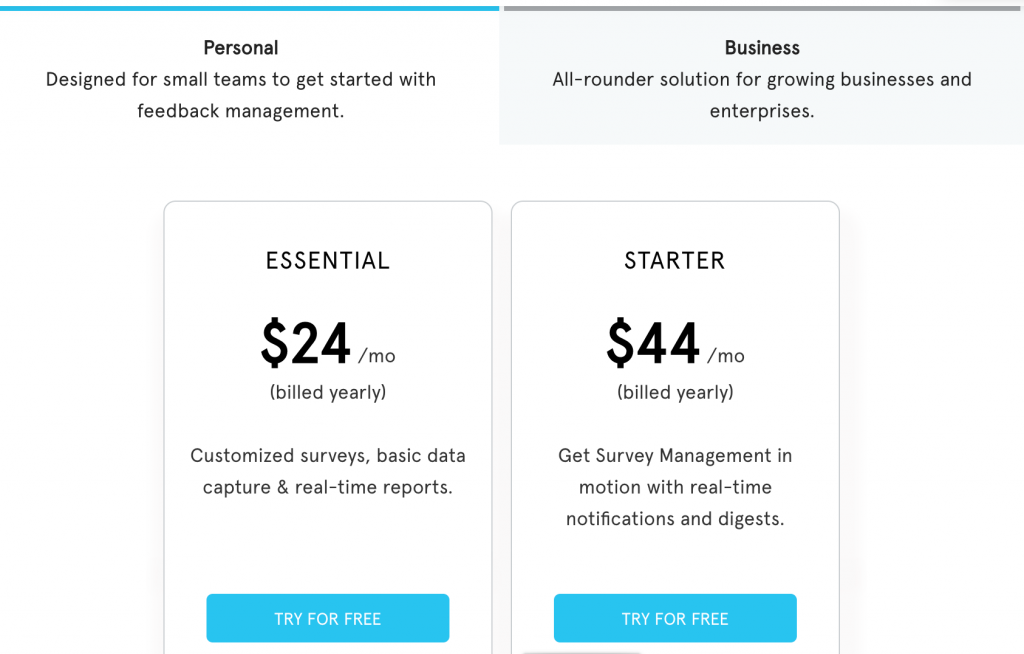
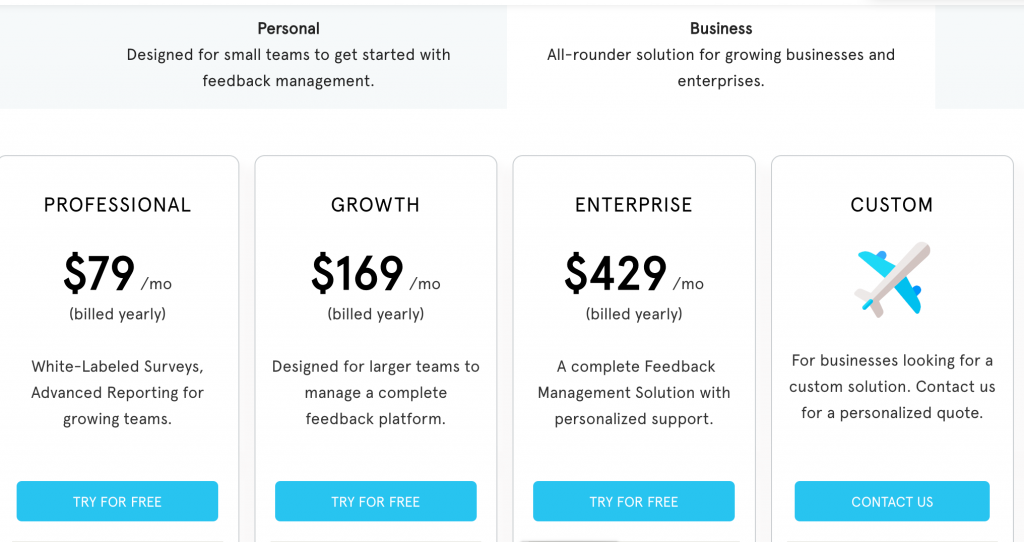
Zonka Feedback pricing falls into two categories:
Personal Plans
Essential plan $24/month.
Starter plan $44/month.
Business Plans
Professional $79/month.
Growth $169/month.
Enterprise $429/month.
Custom plans.
Reviews
- Shefali V., Director Of Operations at AMAZON WOOD PVT LTD
“Zonka Feedback is a very modern-looking Survey Software with extremely good-looking surveys and feedback forms.” - Vinit R, Health City Cayman Islands
“Zonka App has really really helped us a lot to improve our feedback collection and analysis system.” - Rafael H., Founder & CEO at Reteamly
“What I love— the integrations are almost endless! Helping the system to tie in seamlessly with our current toolset.”
Conclusion
With the right customer analytics tool, you can offer customers the best experience and grow your SaaS business. When choosing a tool, you should consider the source of customer data you need, your company size, and overall business objectives.
A customer analysis tool is software that provides customer data to help marketers make better decisions on how to identify, acquire, and retain the best customers.
There are two main types of customer analysis: behavioral analysis and demographic analysis. Behavioral analysis gives information about consumers’ buying habits, what influences their purchases, and how they feel about alternative products. Demographic analysis studies factors such as the age, gender, and income of customers.


