What is a Data Analytics Stack? Beginner’s Guide for SaaS Companies
Today, data is the guide for most decisions in companies. These decisions can range from launching a new product and research and development to creating promotional offers and developing personalized marketing and advertising campaigns, etc.
Businesses always need data at their disposal to make accurate and successful decisions about the examples above. The problem is, that the volume of data is often more than they know how to use or manage. And their data is scattered across platforms most of the time. What these companies need is a data analytics stack to turn that data into insights and valuable business intelligence.
If you want to learn more about data analytics stacks, here is a beginner’s guide for your SaaS company.
What is a Data Analytics Stack?
Data is one of the most valuable assets your organization has. But pieces of raw data by themselves don’t have much worth. Data must be compiled, organized, cleaned, and analyzed to generate value.
As I mentioned above, an analytics stack is an integrated system of applications that collect, combine, analyze, and realize the value of your data. In a nutshell, an analytics stack is a mechanism that turns your raw data into business intelligence.
Data-driven businesses place as much importance on having a dependable analytics infrastructure as they do on having the data itself—and they continuously improve their infrastructure to support their analytics efforts, thanks to their analytics efforts to have an edge against the competition.
Data Wrangling vs. ETL: Two Sides of the Same Coin?
Organizations now have more information at their fingertips than ever before. And, in many cases, more information than they know what to do with. So how can you turn this data into insights you need for smarter business decision-making?
The answer is systematic data preparation and cleansing. You might have come across the terms data wrangling and ETL before. Yet although they are closely related, they are not the same thing.
So, here are 3 critical differences:
1. Types of users
The users of ETL and data wrangling are usually different. Business users such as data analysts and marketing/product managers, people who know the data well, use data wrangling tools to question and explore data. So, many data wrangling software feature functionality for non-technical users.
ETL tools, however, are aimed towards IT personnel, whose job is to ensure data proceeds smoothly from source to target. Most of these tools come with features and capabilities that make it easy to make sense of data without a lot of technical knowledge. This is why even though ETL tools are aimed towards IT professionals, business users are likely to use ETL tools just as much in the current business landscape.
2. Types of data
The data itself is different depending on whether it’s being used for data wrangling or ETL.
ETL works best with structured data such as data from relational databases. Working with unstructured data can be more difficult as it is hard to define an automated process that can be used for data transformation.
Data wrangling can work with a wider variety of raw data as it requires a larger amount of manual effort. Many data wrangling tools take advantage of machine learning, artificial intelligence, visualization, and human-computer interaction.
3. Use cases
Data wrangling is more exploratory in nature, helping small teams answer necessary questions. It can help uncover new connections and trends in large amounts of data.
ETL is a systematic process that extracts and transforms your enterprise data either at regular intervals or whenever you want, ensuring that it is ready for analytics and reporting inside a data warehouse, a database, or even other formats like Excel or CSV files.
Data Volumes Are Exploding: What Does That Mean for Data Analytics?
Data volumes are getting bigger and bigger each day. With tons of data coming in constantly, you need quick analytics to make sense of all that data, and make sense of it fast. With quick access to insights, you can make important decisions for your business in the dynamic business landscape.
Your business needs to adapt to the changes in the market in order to grow and thrive. This is why simplifying the entire process of gathering and leveraging insights is crucial.
What Does the Modern Data Analytics Stack Look Like?
Data analytics stacks have been around since the early 2000s. But when you look at the modern examples of them, you will notice that no-code tools are getting popular.
Actually, if you check google trends, you’ll see a stark interest in no-code automations recently.
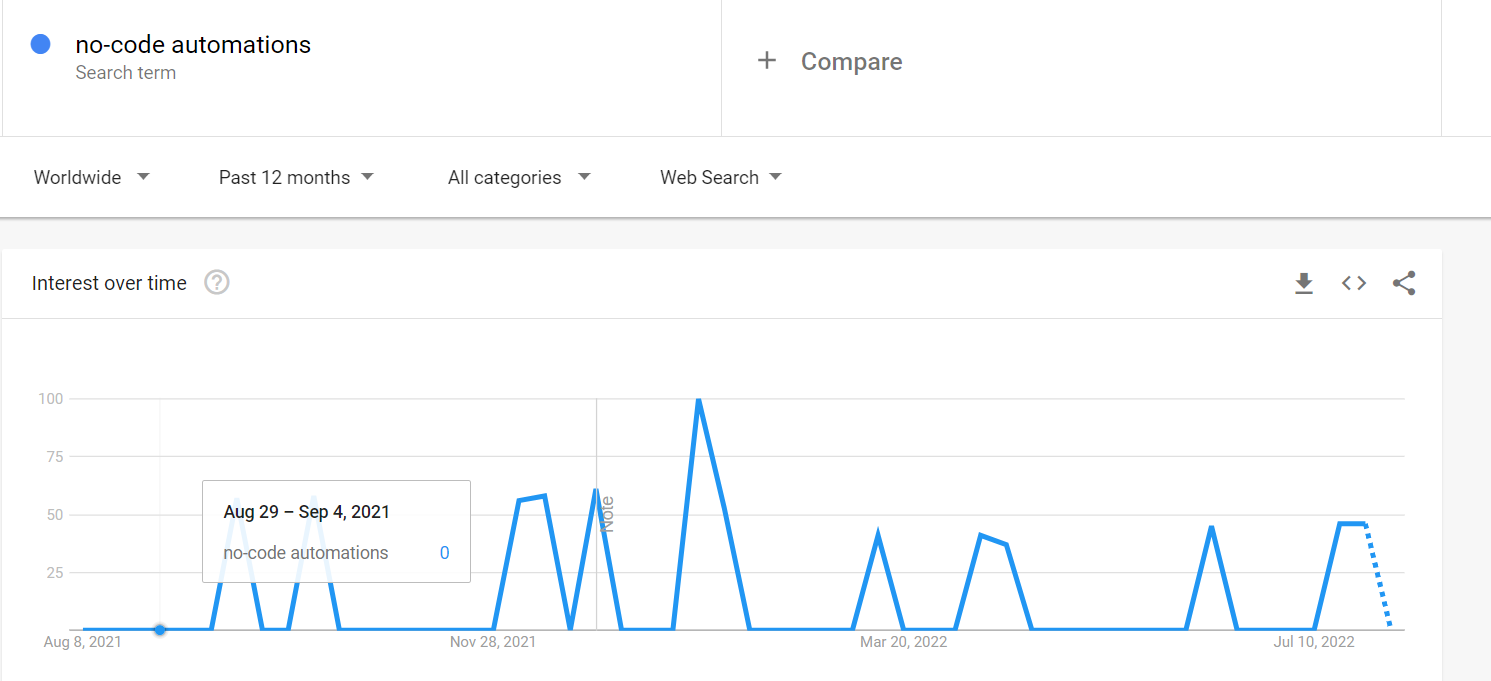
A modern data analytics stack must offer you no-code functionality with an easy-to-use simple design for this very reason.
When’s the Right Time to Focus on Data Analysis?
The sooner, the better. Really. There is no specific or most effective time to focus on data analysis, as you can always use more analyzed data to provide insights at any point in your business.
No matter where your business stands, analyzing your data will always benefit you in ways such as getting insights into your business, your customers, ways you can improve, etc.
You don’t need to wait to make sense of your data and leverage it to your benefit especially since there are no risks involved. Delaying this analysis, however, may harm your business as your competitors definitely won’t wait to leverage insights that data analysis offers.
Collecting, Consolidating and Storing Data
Data is the main asset that sets your data analysis efforts in motion in the first place. Without properly collected data, things can get complicated very fast.
You can collect your data with several methods such as surveys, observations on your organization, documents and records, etc.
Once you have collected this data, as I mentioned above, you can use data wrangling or ETL to consolidate and clean up your data to make it easier to unify that data.
But where do you store all these heaps of data? You may think of data silos at first but that may be an obstacle to your business. A data silo is a collection of data that one team or department can access but not the rest of the organization.
By this definition, data silos may seem harmless at first glance. However, data silos cause disruptions in interdepartmental collaboration and information sharing. Data quality suffers due to inconsistencies in data in different silos. To improve collaboration in your business, data silos are definitely not a good idea.
So what should you do?
With the help of a tool like HockeyStack, you can unify all your data with a single tool in minutes without typing any code.
HockeyStack allows you to combine all your data and easily track it from a single platform with dashboards that will enable you to uncover great insights.
From product to marketing and even sales, HockeyStack allows you to collect and analyze data from all your departments on customized dashboards. It collects all this data effortlessly in a single location, preventing data gaps between departments.
Presenting & Using Data
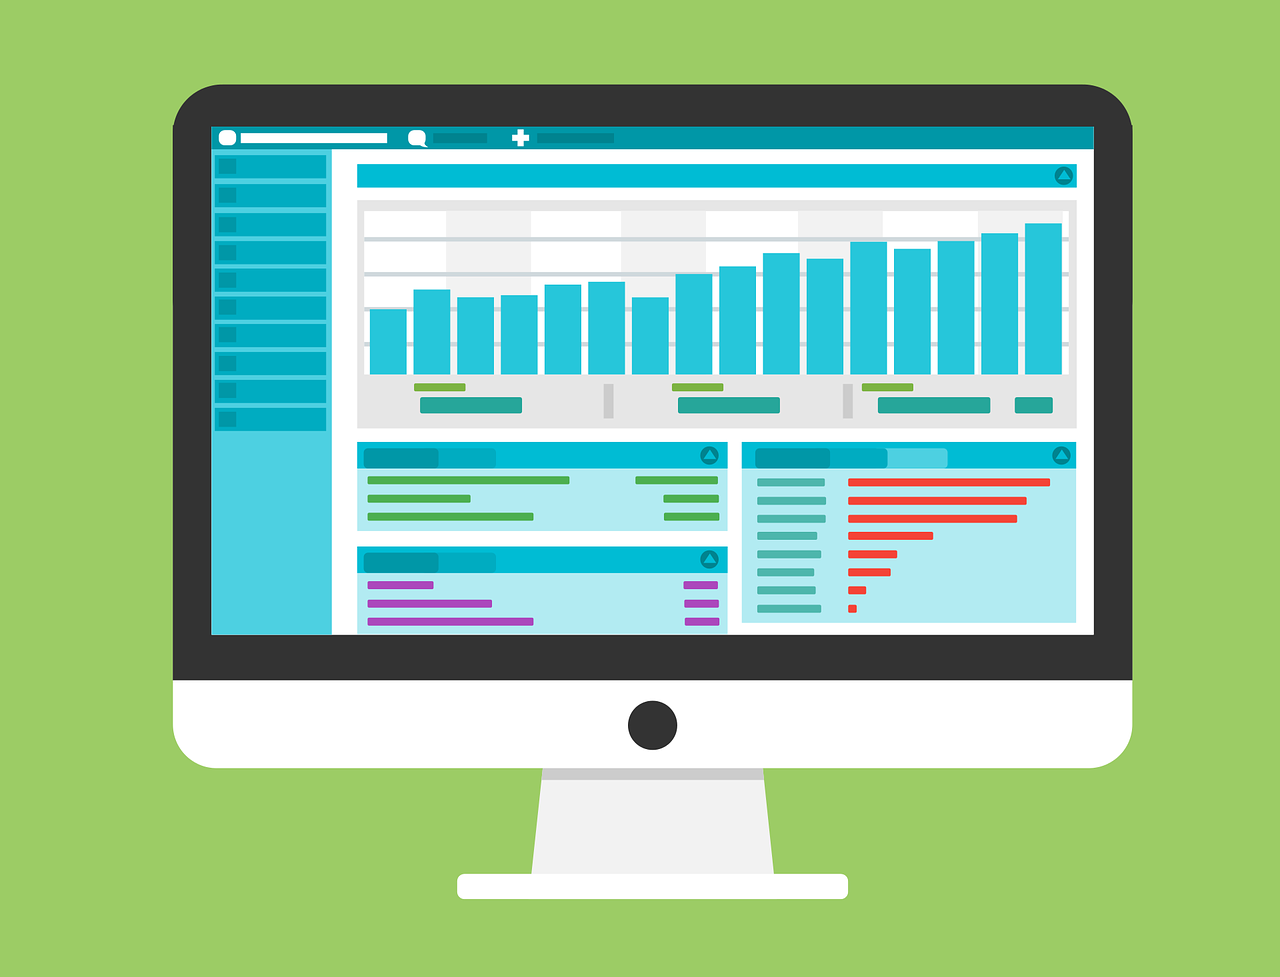
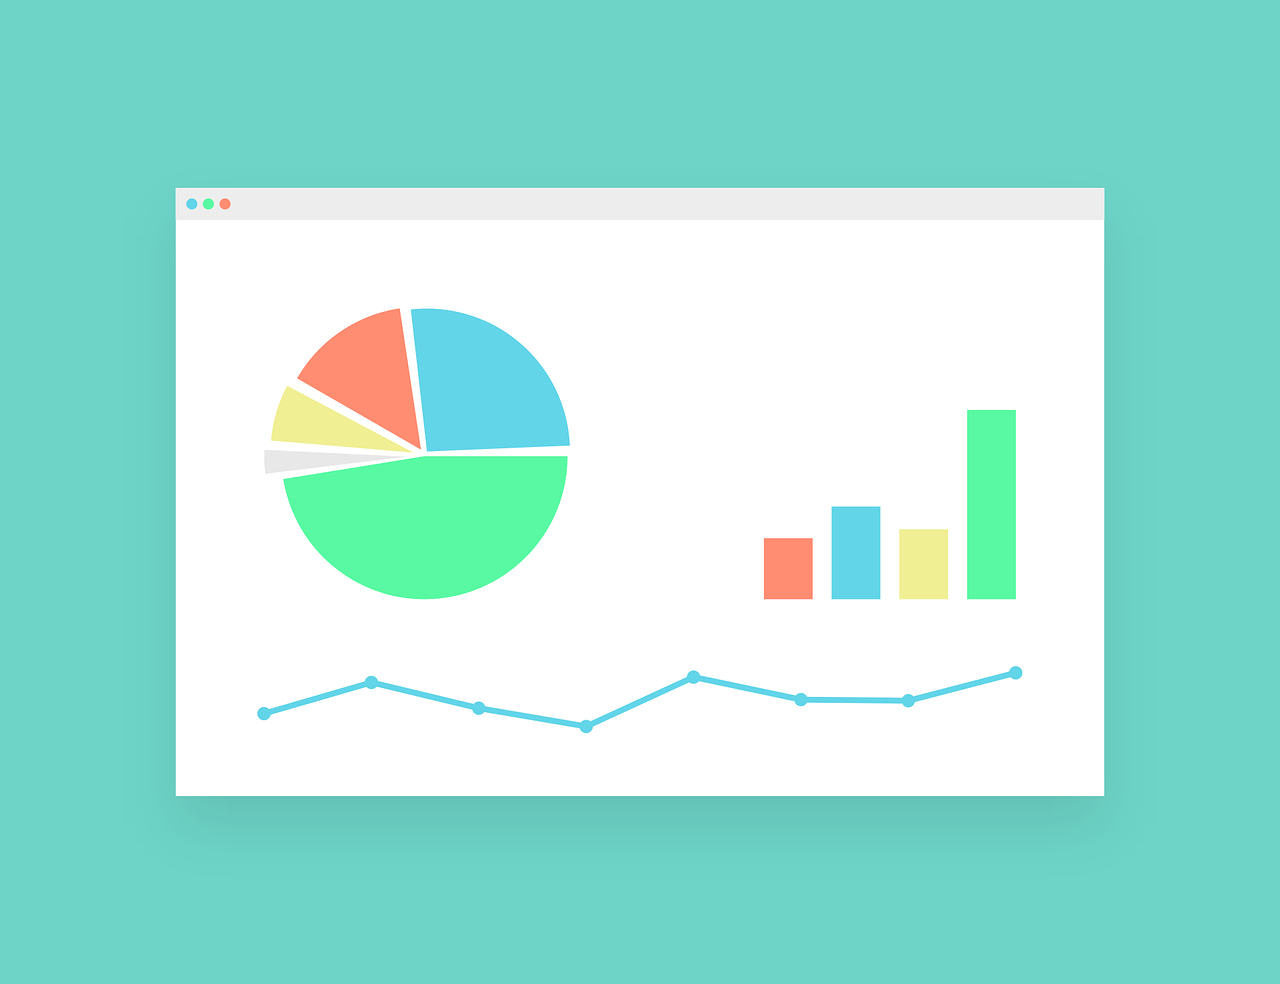
Everyone loves to create one or two good-looking charts and graphs for their presentations because visualizing data is fun, easy to look at, and easy to make sense of.
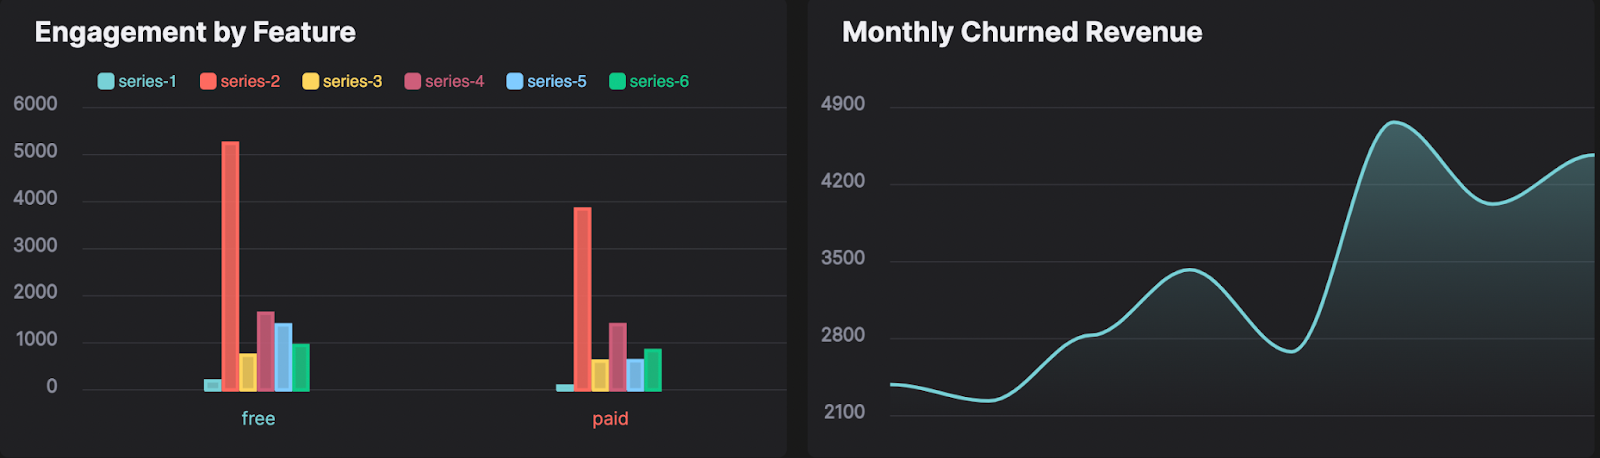
This is why visualizing your data with the help of dashboards and funnels which are easy to make sense of is important.
You can’t expect yourself or an employee to sit in front of a computer screen and work with endless numbers and countless data, and not get bored or maybe make occasional mistakes.
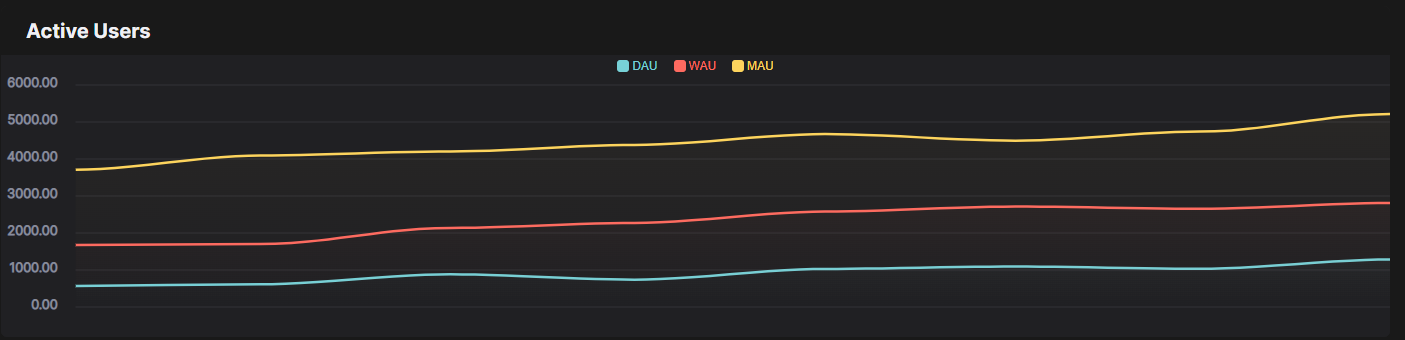
Data, when visualized, becomes far more digestible to the human brain. It helps you make connections and see spikes of numbers you otherwise maybe wouldn’t notice right away.
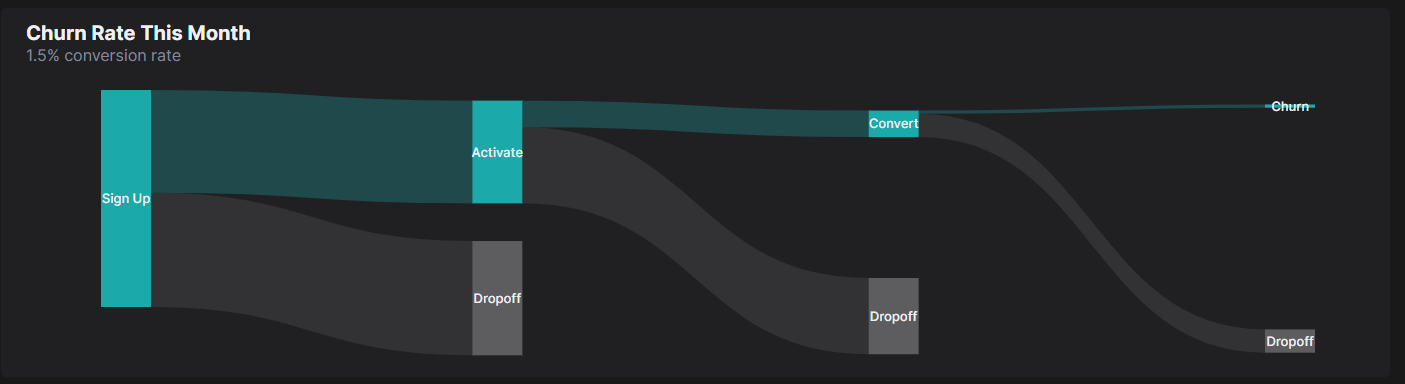
This is where HockeyStack can help you. With HockeyStack, you can create all kinds of dashboards that will enable you to see your data and the condition of your business in a glance, without boring you whilst working on it. For SaaS companies, as data-driven businesses, a data analytics stack can be an essential asset. Because, the amount of data they need to deal with on a daily basis is very hard for one or a group of people to do without the help of a data analytics stack without things getting out of hand, very fast.
Start leveraging a data analytics stack today and see your data neatly collected and organized in one place.


