8 Databox Alternatives: Which One Is The Best?
Unifying fragmented data is critical at SaaS companies. The more data silos in an organization, the more the inconsistencies and lack of visibility into processes. To mitigate this, SaaS companies look for data analytics tools such as Databox to access all of their data in one place.
That said, while Databox offers numerous features and capabilities to collect and unify your data, there are still reasons why companies might look for alternatives to Databox.
In this article, I will help you find the best Databox Alternative for your SaaS.
HockeyStack
HockeyStack is an end-to-end analytics and attribution tool for SaaS companies. The tool is completely no-code and can be set up in just 5 minutes.
HockeyStack gives you the unique ability to unify data from product, marketing, sales, and revenue departments to understand the complete picture of your processes. This means that you can create customizable dashboards with any metrics of your choice, allowing you to understand what drives revenue and make amends to your pipelines to minimize friction in conversion.
Let’s take a look at some dashboards you can create with HockeyStack.
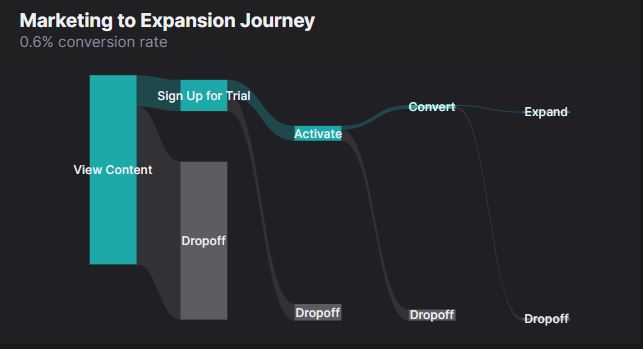
Here, we have a dashboard showing the marketing to expansion journey:
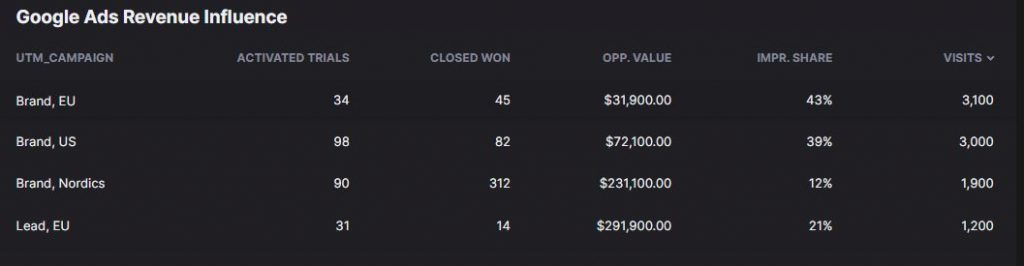
A chart showing the influence of Google ads on conversions:
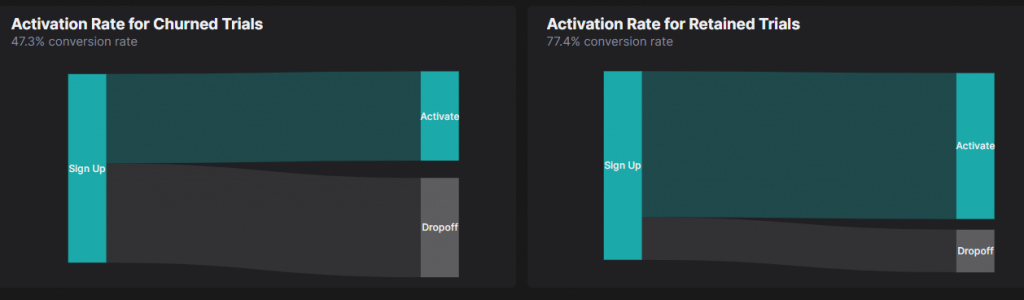
The activation rate based on different customer segments:
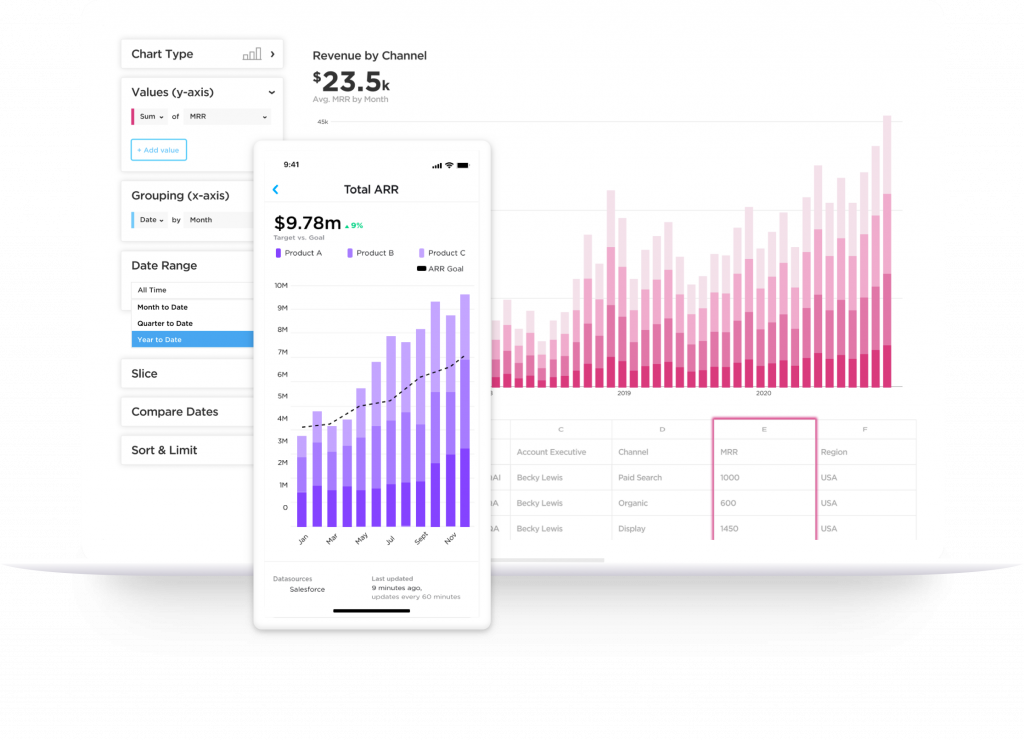
And the complete sales funnel showing how many customers move on to the next stage:

HockeyStack’s Features
HockeyStack comes with a number of features including:
- Step-by-step user journey to understand the top performing touchpoints for conversions and points of friction
- Custom dashboards with the ability to populate your data on to an existing template or create a new template from scratch
- Goals to ensure that you have complete visibility of each micro and macro conversion
- Surveys to uncover dark funnel data and hear about issues straight from your customers to maximize retention
- Segments to understand how different user groups engage with your business and improve your personalization efforts
and more.
HockeyStack Pricing
HockeyStack has 2 paid plans: Boost and Dominate. These plans have a 14-day trial with a 30-day refund guarantee.
You can check out the pricing page here.

HockeyStack Integrations
- Paddle
- Stripe
- Hubspot
- Crisp
- Mailchimp
- Pipedrive
- Salesforce (coming soon)
- Zapier (coming soon)
HockeyStack Summary
The unique benefit of HockeyStack is its ability to unify your marketing, revenue, sales, and product data using no code. This allows you to uncover unique insights that you wouldn’t be able to by using multiple tools as they cause you to have fragmented data.
- You can integrate your payment processor, CRM, and customer support tool and build every single dashboard that you can think of, using all sales, marketing, revenue, and product metrics.
- You can create funnels, goals, and surveys, which are rare to get with other tools on this list.
- You don’t need any developers, tracking is cookieless, and the script is small, so it doesn’t increase your site loading time.
Google Data Studio
Google Data Studio is an extension of the Google Marketing Platform aiming to convert user data into customizable reports and dashboards. It is founded on March 15, 2016, and emerged as a part of the Google Analytics 360 suite. In 2016, a free version of the platform has been announced for individuals and small businesses.
The purpose of the platform can be summarized as visualizing data online to gather insights. By using features and additions in this Databox alternative, you can create impactful reporting, collaborate with your teammates and share them with other people.

Main Features of Google Data Studio
- Dynamic and Secure Data Connections
- Calculated Metrics
- Customization
- Data Control
- Dynamic Controls
- Real-time Collabration
- Built-in Sharing
- Report Templates
- User Administration
Integrations of Google Data Studio
Integrating with diversified platforms is critical while choosing an alternative. Since Google Data Studio is an extension of Google company, it utilizes from the collaboration of Google. Due to that, it has a wide catalog of integrations such as:
- Cloud Spanner
- Campaign Manager 360
- Cloud SQL for MySQL
- BigQuery
- Extract Data
- Google Ad Manager
- Google Analytics
- Google Sheets
- Youtube Analytics
- Search Console
- Google Surveys
Pros of Google Data Studio
Cloud-Based and Managed
It differs from competitors as it is grounded as a cloud-based service. Other than that, the customer is not required to manage any installation since the system is completely managed.
Wide Integration with Other Google Platforms
Maybe its biggest advantage is its vast interaction with Google ecosystems such as Google Analytics, Google Sheets, and Google Surveys. That interaction gives a big easiness while creating research and reports.
Live Connection is Encouraged
It is based on the live data connection. That means you are not required to have the specific advanced quality to manage the flow of fresh data. Whenever a access is refreshed on the dashboard, you will see the latest data. In addition to that, if the flow gets too fast for you, you can manage the settings of the flow of data.
Cons of Google Data Studio
Does Not Support Excel
Because it is a Google extension, it does not support standard business intelligence formats like Excel. Instead, it uses Google services. But you can convert data to Excel while using a CSV file.
Comprehensive Visualization is Not Encouraged
Basic visualization and reporting are easy with Google Data Studio. However, it does not support the flexibility and customizability of visualization. So lack of visualization can be considered as a disadvantage of Google Data Studio.
Slow Speed of Live Data Connection
As the complexity of functions in the system increases, the speed of dashboard flow gets slower. It can be concluded as a side effect of live connection systems and in cases where performance is critical, you may need a scheduled extract to get things better.
Pricing of Google Data Studio
There is currently only one version of the platform, and it is free. Also, other free Google services like Google Analytics and Google Sheets come within it. However, it has some limitations and boundaries while collaborating with Google services.
Grow
Grow.com is a no-code full-stack business intelligence platform founded in 2014 by Kevin Sandhu and Daniel Cowx. It supports everyone in an organization to make data-driven decisions. Firstly, it started as a technology-based online consumer lender. Currently, it has various important partnerships with important companies.
Grow.com aims to connect and amplify business data to bring insights to customers. In order to do that, it combines three features: ETL, data warehousing, and visualization in an easy use platform. If you are a new started or growth-oriented business, Grow.com is a great platform in the sense of accelerating the real-time growth of your company.
Main Features of Grow.com
- Data Column Filtering
- Marketing Analytics
- Ad Platforms
- Supports Databases
- CRM
- Data Visualization
- Automodeling
- Collabration / Workflow
- Integration API’s
- Data Transformation
Integrations of Grow.com
- Airtable
- Amazon Redshift
- Asana
- Fresh Books
- Google Ads
- Hubspot
- Active Campaign
- BigCommerce
- Campaign Monitor
- Chargify
- Constant Contact
Pros of Grow.com
Friendly Pricing
Firstly, a free trial of the platform is available to display the capability of the platform whether it fills your requirements. Other than that, plan A is designed as a category that all the necessities are in the plan, however; there is no unnecessary feature in it. Therefore, it is created due to the budgets and needs of companies.
Wide Range of Dashboards for Specific KPI’s
With the help of Grow.com, you can create specific dashboards for different purposes like marketing or accounting. The dashboards in it provide a decision ability based on fast and on-demand.
Combining Data Gathered from Myriad Sources
Grow.com gathers and stores data taken from various types of sources and allows you to process it. In addition to that, the platform is compatible with multiple operating systems such as Windows, Mac, and Android. Due to that, switching the device while using the platform is not difficult.
Cons of Grow.com
Speed of Software
The software of the platform can cause some issues in some manner. For example, certainly pulls errors while refreshing. If you are a fast-data-driven business, you have the possibility to deal with the slow speed of software.
User Interface Issues
Some users concluded that some user interface problems can be faced. Some of the SQL syntax aiming to auto-completing does not work. Also, sometimes text widgets disappear after dragging them onto canvas.
Price of Grow.com
The platform offers a free trial. Other than that, the category of pricing starts from $1500 per month. For a specific catalog of prices, you need to contact with Grow.com sales team.
Why Not Simplify Your Analytics?
Track key metrics, identify trends, and mitigate risks with greater visibility into your marketing, sales, and product data
Try HockeyStack Today!
DashThis
DashThis is a digital marketing reporting tool specifying the needs of the platform in it. The feature that differs DashThis from competitors is you can choose your needed tools and features in it, so you do not face any extra stuff.
DashThis is compatible with more than 30+ products. The platform aims to save the customer’s time and create their reports in the blink of an eye. To do that, it just needs your defining information so it can bring a solution to your reporting and customization.
Main Features of DashThis
- Historical Snapshots
- Email Reporting
- Real-time Updating
- Score Cards
- Reports Interface
- Steps to Answer
- Data Collection
- Customer Insights
- Multi-user Access
- Brand Optimziation
Integrations of DashThis
- Adform
- Ahrefs
- Bing Ads
- Brightcove
- Callrail
- Campaign Monitor
- Clickmeter
- Comscore
- Facebook Ads
- DoubleClick Search
- Formstack
- Google Ads
Pros of DashThis
User Friendly
A lot of customers concluded that DashThis is easy to use and has various and flexible function categories. In addition, its price is compatible with the functions it offers.
Wide Connectivity and Support
DashThis offers wide connectivity with other platforms. It can be listed as one of the most important advantages since that will carry the company to a higher level in the future. In addition, customer support is satisfying due to customers.
Collection and Visualization of Data
Unlike competitor platforms, DashThis consolidates all the collected data in itself and presents it in the form of impressive good looking graphs. A user can create beautiful charts and graphs like a pro in one or two clicks.
Cons of DashThis
Low Level of Dashboards to Display
Even though there are various data sources and reports to present, the need for a few dashboards is displayed. If you want to show your social media traffics, advertising avenues, and analytics another type of dashboard, you may counter problems.
Editing Widgets
Sometimes editing widgets can be difficult that you need to start from scratch. But it is a problem being worked on by DashThis.
Price of DashThis
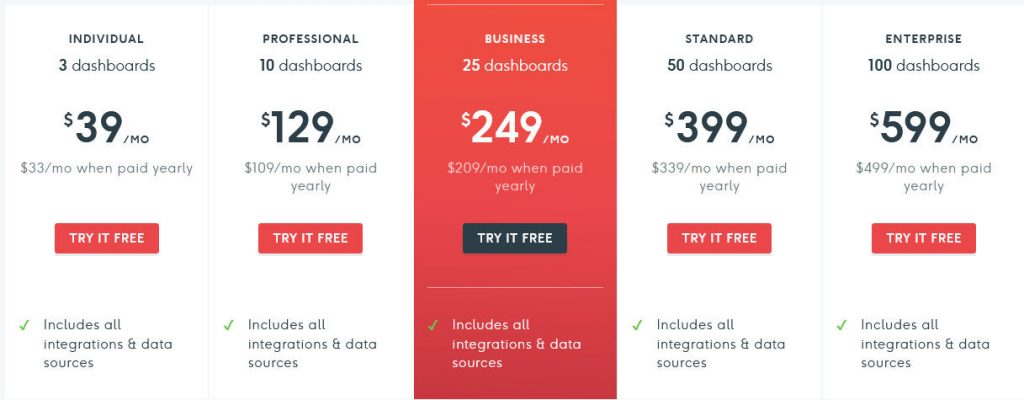
It offers a free trial for 15 days and it does not require any credit. Other than that, it presents five different pricing categories classifying as monthly or yearly. Also, each pricing category has a different amount of limited dashboard numbers. You should consider all of these factors while deciding.
AgencyAnalytics
AgencyAnalytics is a marketing reporting platform specified for agencies. The main purpose of the platform can be concluded as automating client reports of agencies in the shortest time. To display your full marketing impact, it impresses the customers with amazing insight reports and live marketing dashboards.
The platform is trusted by 4500 growing agencies and it integrates with more than 60 other reporting platforms to collect the most trusted data. It presents SEO tools designed to automate your agency. It offers features like tracking rankings and monitoring backlinks.
Main Features of AgencyAnalytics
- Automated Reports
- White Label
- Custom Dashboards
- Client and Staff Management
- SEO Tools
- SERP Rank Tracking
- Multichannel Tracking
- Competitor Analysis
- Link Building
- ROI Tracking
Integrations of AgencyAnalytics
- Google Analytics
- Google Ads
- Shopify
- Active Camapign
- Adroll
- Ahrefs
- Baclink Monitor
Pros of AgencyAnalytics
Reliable and Advanced
It is considered one of the most reliable platforms for agencies by its users. Due to its huge integration category and advanced services, it consolidates its reliability between the sector.
Easy Function Usage
To provide the best user experience, AgencyAnalytics keeps its usage simple. Although it offers complex and various functions, its usage is quite simple so customers can create reports in the lowest time interval.
API to Integrate
It provides specific APIs to integrate with your own system. In that way, you can create and convert insights in an effective way.
Cons of AgencyAnalytics
Widget-Based Dashboards
You can customize each customer account dashboard and have the ability to give them access.
Small Packages
The users expressed that packages are small and allow monitoring only multiple URLs.
Price of AgencyAnalytics
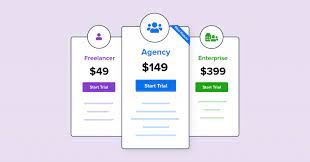
AgencyAnalytics presents a free trial in it for 14 days requiring no credits. It has a subscription price model and offers three pricing models: freelancer, agency, and enterprise. Each of them has different target groups and limitations.
Cluvio
Cluvio is a cloud analytics platform for startups allowing create dashboards and reports due to SQL and R. The platform is trusted by more than 1800 companies. The aim of the platform can be summed as utilized to perform numerous processing in Data Lake.
You can use SQL and R for analyzing data and creating insightful graphs in a few clicks. It highly focuses on the success of your business and provides various comprehensive solutions to manage that. In addition, it bases its data on actual real sources.
Main Features of Cluvio
- Painless Collabration
- Database Almanac
- SQL Snippets
- Suggested Visualization
- SQL Alerts
- Data Protection
- Sharing Email
- Sharing Dashboards via Link
Integrations of Cluvio
- MySQL
- Microsoft SQL Server
- Oracle
- Amazon Redshift
- Google Bigquery
- Amazon RDS
- MariaDB
- PostreSQL
Pros of Cluvio
Embedded Analytics
Cluvio provides hidden insights and detailed analysis to accelerate the revenue and growth of your company. Especially if you are a start-up focused on large-scale growth immediately, that advantage will benefit you a lot!
Wide Selection of Chart Types
It offers a wide category of charts and data visualizations to customers. In that way, you can create various good-looking charts and graphs.
Full-featured SQL and R Server
With the help of SQL and R editors of the system provides, you can manage code completion, formatting, syntax coloring.
Cons of Cluvio
Difficult Usage At Times
Sometimes using SQL and R servers can be difficult. It does not handle the emoji sections well. Some users concluded that more “click-through” capabilities are needed for easier usage. Also, more control over permissions and roles can be a good extension for a better user experience.
Pricing
Although it is a platform founded for small businesses, the pricing can be a little more at times for them. Check the needed features and your budget well before deciding.
Price of Cluvio
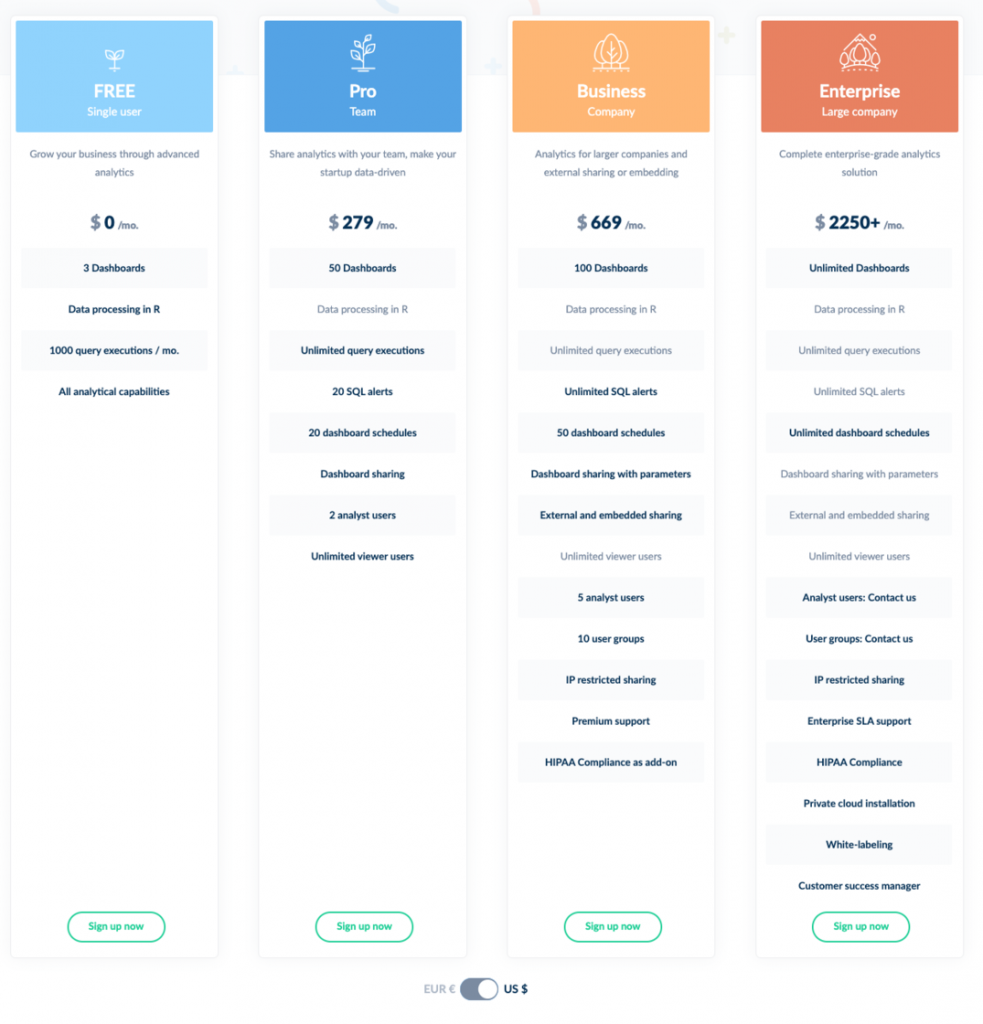
Clivio offers four different pricing categories to customers: The first one is free and it is designed for starters in designing. It includes more than 250.000 free templates and 100 design types. Other than that, it has three other different categories that mainly focus on larger businesses.
Whatagraph
Whatagraph is an analytics tool for the performance of reporting and monitoring. It tracks gathered data from different channels. It aims to reach marketing professionals in the sense of visualizing and analyzing data and creating cross-channel reports.
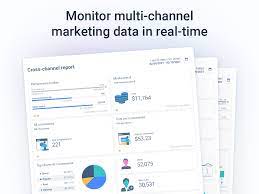
Customers mainly use Whatagraph for tracking campaign results from various channels. The platform provides visualizations, reports, and data insights in the manner of leading your company’s success. It offers some features that you may not find in other competitor tools such as monitoring multiple channels at once or styling reports based on your needs.
Main Features of Whatagraph
- Monitoring Multiple Channels at Once
- Delivering Reports Automatically
- Style Reports As You Wanted
- Building Reports in 10 Minutes or Less
- Transfering Custom Data From Any Source
- Collabrating with Teammates
- ROI Tracking
- Spend Management
- Multichannel Tracking
- Campaign Updates
Integrations of Whatagraph
- Google Ads
- Google Analytics
- Mailchimp
- Google Sheets
- BigCommerce
- Klaviyo
- Shopify
- Ahrefs
Pros of Whatagraph
Ease of Setup
It has simplicity of use. When you sign-up, you will be able to begin to use the platform in one minute. Customers concluded that it is a very beneficial advantage since it saves hours of attempting to create reports for clients.
Comprehensive Tracking
Whatagraph added some new features like real-time live reporting for better user tracking. In that way, you can track campaign performance and make changes due to that in a more detailed way. In addition to that, it has weekly, daily, and monthly reporting options so that you can set up the following performance in the needed cases.
Support of Team
The platform has a tech and sales team that is accessible and available at any time you want. In the case of encountering a problem with the tool, they will respond and solve your problem in the shortest time you mentioned.
Cons of Whatagraph
Multi-Calendar Reporting
It can cause some multi-calendar reporting issues in a few cases. A client concluded that while he was displaying all data in one report comparing monthly and yearly cases, the system of software had some hiccups. However, the tech team of the platform paid attention and the problem was solved in minutes.
Price of Whatagraph
The platform has three pricing models: Professional, Premium, and Growth. Professional and Premium models have free trails for you to understand it is suitable for you. The models have annual paying systems and start from $119 per year. That option has the limitation of one user and fifteen data sources. The other two options also offer extra features and more comprehensive service.
Klipfolio
Klipfolio is an analysis tool made for upgrading the analysis of your company to a higher and more dynamic level. It can be considered as a modern BI platform aiming to provide better solutions to businesses. It is used by thousands of businesses.
Other than that, it gathers metrics in one place without the need for coding. You can check the custom options to consolidate your data from every channel that can be imagined.
Main Features of Klipfolio
- Reports Interface
- Score Cards
- Dashboards
- Calculated Fields
- Automodeling
- Data Discovery
- Collabration and Workflow
- Integration API’s
Integrations of Klipfolio
- Slack
- Gmail
- Mailchimp
- Google Sheets
- Airtable
- Freshdesk
- YouCanBook.me
- ActiveCampaign
Pros of Klipfolio
UI / UX
The UI/UX that the platform provides has been praised by many clients. The visual appeal of Kipflio is considered as one of the most beneficial ones in the industry. The dashboards that it presents will impress you as a business leader!
Power Metrics
It gives you the opportunity to decide from 100s of curated instant metrics. Due to its wide category of integration, its metrics are trusted by various types of customers.
Cons of Klipflio
Chart Elements
The opportunity to alter charge elements has limitations. A customer stated that: “Data source limit of 10mb acts as a limitation for a lot of clients working on Excel/CSV files.”
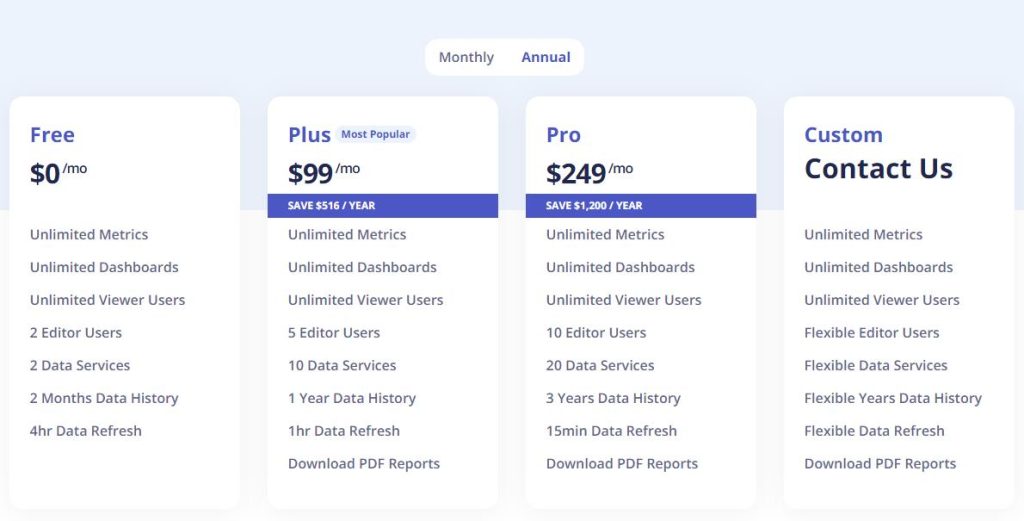
Price of Klipfolio
It has three pricing options. The first one is completely free and includes features like unlimited metrics and dashboards and unlimited viewer users. Other than that, the pricing starts from $99 per year.
Conclusion
If you are unsatisfied with the features or pricing models of Databox, you can check the platforms I have listed below. Even though you are not sure or confused about the options, you should not decide before examining all the pros and cons of the listed tools. However, if you are still not satisfied with the listed options, HockeyStack will help you get informed about diversified tools and platforms. Do not forget to check it!
FAQ
Databox is used by its users in the sense of accessing data from other platforms and leading the companies in marketing purposes.
It uses some cookies to store and sometimes track user information.


