Top 6 Dreamdata Alternatives For 2023
Attribution tools allow marketers to understand which channels, campaigns, content, and ads drive the most revenue to optimize performance and improve ROI. For this reason, SaaS companies rely on a variety of attribution tools such as Dreamdata to add more dimension to their revenue and use their findings to tweak their future strategies.
Dreamdata, a B2B revenue attribution tool founded in 2018, helps users build B2B customer journeys and determine the highest drivers of revenue. Like any other software, however, Dreamdata has its downsides, such as a lengthy setup according to user reviews, challenges with data verification, and the need for a tool like Looker to visualize your data other than the templates Dreamdata has.
If you feel like Dreamdata is not the best revenue and marketing attribution tool for your business, keep reading to learn about other great Dreamdata alternatives.
1. HockeyStack
HockeyStack is an end-to-end analytics and attribution software trusted by over 7000 companies.
This means that in addition to revenue attribution, HockeyStack also offers a range of functionalities and capabilities including the ability to create funnels to view the customer journey, surveys, and even measure MRR all without the help of external data visualization tools.
Here’s a look at how that works:
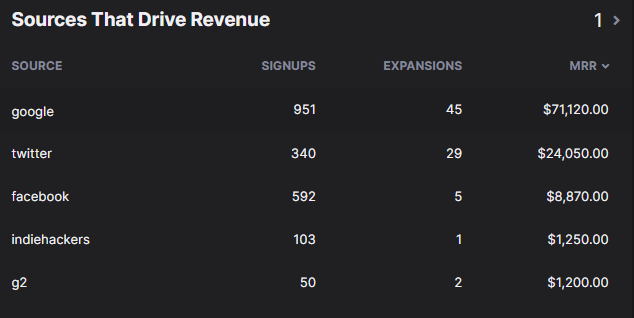
The screenshot above shows how Hockeystack can show users exactly where their signups come from, how many customers expand as they progress down the funnel, and what each revenue channel means in terms of MRR.
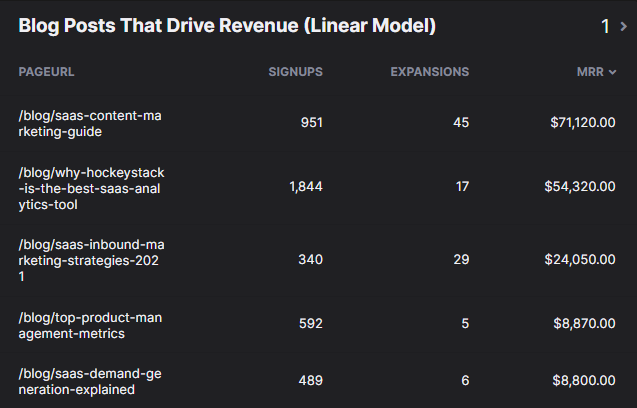
The tool can also be used to create and visualize numerous other dashboards such as:
A breakdown of the top content pieces driving revenue:
A customer journey showing how many users convert and expand among other metrics:

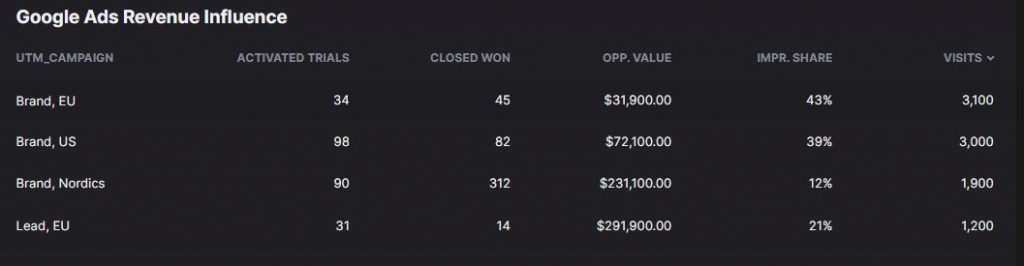
And even greater visibility into how your paid social campaigns translate to revenue:
HockeyStack’s no-code interface and quick setup are just some of the reasons why thousands of companies rely on it for their analytics and attribution needs. The tool can be set up in just 5 minutes and comes complete with integrations to all your favorite marketing and sales tools, allowing you to create a single source of truth instead of fragmented data.
Using the information that HockeyStack can uncover, you can improve your content marketing strategy, optimize your content according to what resonates best with your audience, and streamline the customer journey to improve MRR.
Here’s what else Hockeystack can help you with:
Surveys To Uncover The Dark Funnel
Customers can find out about your company through countless different sources including word of mouth, private messages on social media platforms, and even after an influencer casually mentioned how much they love your product in a TikTok video. Unless you understand how your customers are reaching you, chances are you won’t be able to offer them the content they’re looking for or be able to replicate this influx of traffic.
With Hockeystack, you can create and send out comprehensive surveys that help you tap into the true sources of your traffic.
One great part about HockeyStack’s surveys is that you can use the responses in your dashboards, meaning you can correlate responses with actual sales, product and marketing data.
You can filter by responses to analyze their journeys, check out which features they use, what NPS score they gave, or their LTV.
Retroactive Tracking
HockeyStack’s tracking is retroactive, which means you don’t need to create your goals, funnels, segments, or dashboards now. You can set them up whenever you want, and you won’t lose any data.
Liberating departmental data
Hockeystack’s integrations with CRMs, sales tools, and email marketing tools allow you to get a holistic and complete view of all organizational data, allowing you to make more accurate decisions.
HockeyStack Pricing
HockeyStack has two pricing plans, both of which come with a free 14 day trial. You can check out the pricing page here.
HockeyStack Integrations
- Paddle
- Stripe
- Hubspot
- Crisp Chat
- Mailchimp
- Intercom
- Pipedrive
- Chameleon
- Salesforce
- Zapier (coming soon)
2. HubSpot Attribution
HubSpot is a CRM software founded in 2006 that provides sales, inbound marketing, content management, and customer service solutions.
The Attribution features of HubSpot show marketers how different marketing channels and strategies affect sales. It provides attribution reports that give insight into interactions in the contact’s journey. Besides reports, the marketing attribution models of HubSpot let you assign credits to the interactions based on specific rules for different models.
HubSpot Attribution Features
The attribution report you will need is based on what you want to measure. It may be how your marketing and sales generated leads, what efforts led to the greatest number of deals, or how much revenue you generated through leads. HubSpot offers three types of attribution reports to measure the above:
1. Contact create attribution
This attribution report measures all the interactions up to the point the lead was created. You can see interactions divided based on how much they contributed to creating the contact. This report helps you understand the marketing efforts and channels – blog posts, ads, social media posts – that are the most effective in generating leads.
For contact create attribution, the following models are available:
- First interaction: assigns the full credit to the first interaction
- Last interaction: assigns the full credit to the last interaction
- Linear: assigns equal credit to each interaction that occurred before becoming a contact
- U-shaped: assigns 40% of the credit to the first interaction and 40% to the interaction that marks becoming a contact. The remaining 20% is for interactions in between.
- Time decay: assigns more credit to the latest interactions
2. Revenue attribution
This report measures all the interactions up to the point the lead became a customer. The interactions are divided based on the amount of revenue generated, which helps you identify what marketing efforts led to the highest revenue.
For revenue attribution, the following models are available:
- First interaction: assigns the full credit of the closed won deal to the first interaction
- Last interaction: assigns the full credit of the closed won deal to the last interaction
- Linear: assigns equal credit to each interaction that resulted in a closed won deal
- U-shaped: assigns 40% of credit to the first interaction and 40% to the interaction that marks becoming a contact. The remaining 20% is given to the interactions in between.
- W-shaped: assigns 30% of credit to the first interaction, 30% to the interaction that marks becoming a contact, and 30% to the closed deal interaction. The final 10% is distributed evenly to all other interactions.
- Full path: assigns 22.5% of credit to the first interaction, 22.5% to the interaction that marks becoming a contact, 22.5% to the final interaction in creating the deal, and 22.5% to the closed deal interaction. The final 10% is distributed evenly to all other interactions.
- Time decay: assigns more credit to the latest interactions.
3. Deal create attribution
This report measures each interaction in the customer journey and lets you identify the marketing campaigns that led most to new deals.
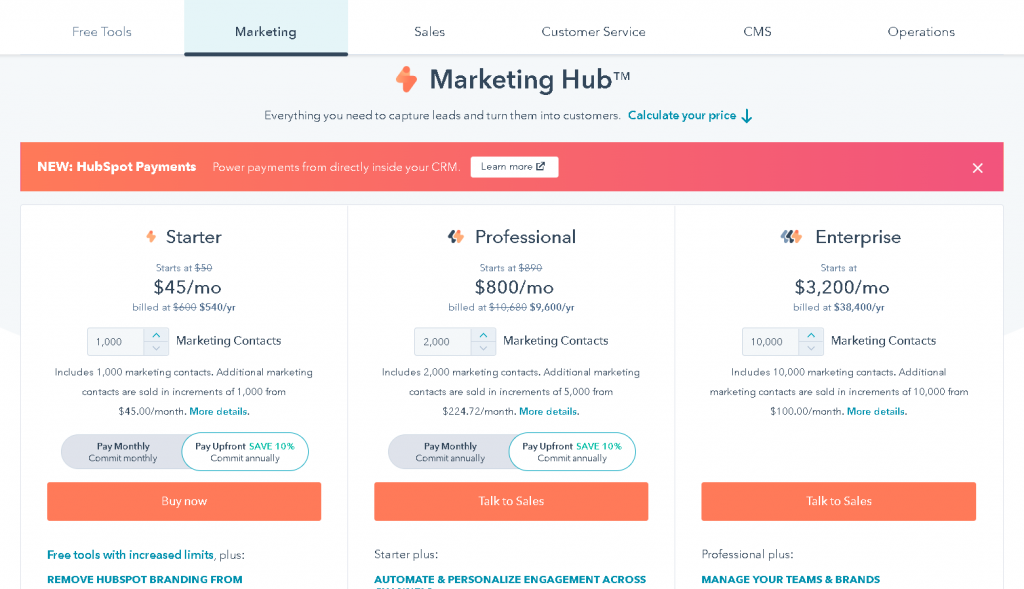
HubSpot Attribution Pricing
Hubspot’s pricing is based on the hub category. The categories are free tools, marketing, sales, customer service, CMS, and operations. Unfortunately, the attribution reports are not a basic feature offered for small and medium-sized businesses. The reports are a part of the Enterprise plan in the marketing hub, which starts at $3200 per month.
3. Ruler Analytics
Ruler Analytics is a marketing attribution platform for businesses of all sizes. It tracks customer journeys and matches each sale with the right source of the channel, campaign, or keyword. It was founded in 2015 by Daniel Reilly and Ian Leadbetter.
Ruler Analytics offers the following single and multi-touch attribution models:
- First click
- Last click
- Time decay
- Linear
- U-shaped
- W-shaped
It also offers the last non-direct attribution model that assigns full credit to the last interaction channel while ignoring direct traffic.
Ruler Analytics Features
1. Metrics
Ruler Analytics provides various useful metrics to help you measure your marketing and make improvements. These metrics include the number of clicks to your site, the number of live chat sessions, the total number of leads, and the lead conversion rate.
2. Reports
There are several different reports that show you the metrics above. These reports include the Source report, the Keyword report, the landing page report, UTM reports, and usage reports.
The Source report shows the platforms and channels that generate the highest quality leads and sales. The Keyword report shows the revenue generated from your keywords so that you can improve your paid advertising. The landing page report shows the highest-performing pages from different multi-touch attribution model types.
3. Lead Conversion Data
You can track different types of marketing data to understand your leads better. These include form fills, phone calls, and live chat conversations.
Ruler Analytics Pricing
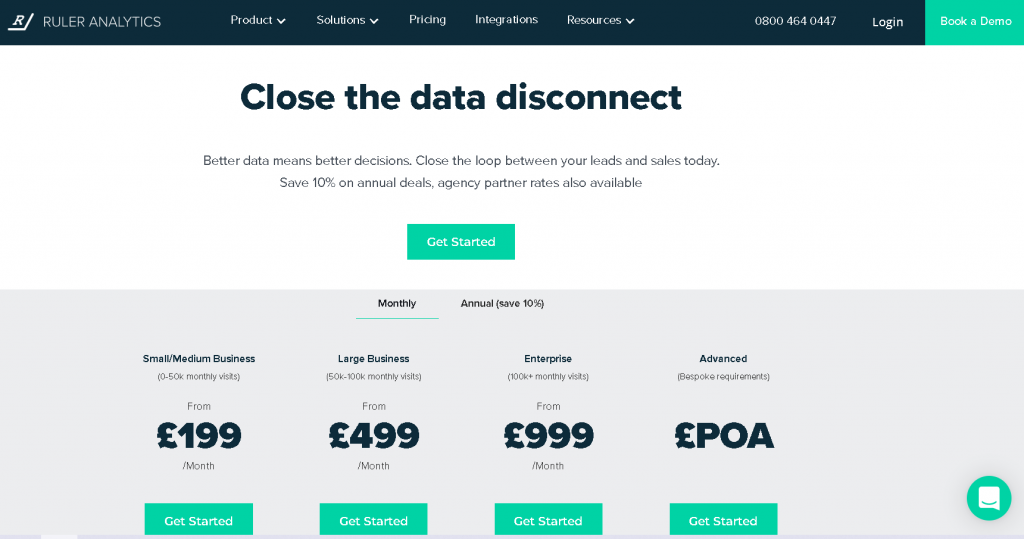
The pricing of Ruler Analytics starts from £199 for small/medium-sized businesses that have 0-50k monthly visits.
For plan for large businesses with 50k-100k monthly visits starts from £499/month, and the plan for enterprises with 100k+ monthly visits starts from £999/month. For custom requirements, they also offer an advanced plan.
All plans have access to standard features under marketing attribution, integrations, and call tracking.
4. Google Analytics
Google Analytics is a free software offered by Google that helps you identify patterns to understand user behavior. It provides a variety of metrics, including metrics for analyzing users, traffic sources, content, and conversions. You can also create custom reports and track social media campaigns.
Google Analytics Features
1. Conversion Tracking
Using the Goals feature of GA, you can create the goals you want to track for specific pages. These goals are the conversions that you want users to perform, such as
- Starting a free trial
- Signing up for an email list
- Watching a video
- Making a purchase
You can also customize your goals and categorize them based on different factors, such as session duration and events.
2. Attribution
The attribution feature of GA provides information on how different channels impact sales and conversions along the user path. This allows marketers to understand the customer journey and identify the marketing channels that supply the greatest ROI.
GA has two types of attribution models. These are
- Rule-based models that assign conversion credit through rigid rules and independent of user behavior or type of conversion
By default, GA uses the last-click attribution model that gives full credit for a conversion to the last interaction. GA’s other rule-based models are first-click, linear, position-based, and time decay. So, you can use both single and multi-touch attribution.
- The data-driven model that assigns conversion credit based on data – such as time from conversion or type of device – for different types of conversions
3. Reports and Visualization
GA automatically generates reports that help you visualize and understand your marketing data more easily. There are advertising reports, audience reports, behavior reports, real-time reports, and conversion reports that you can use to understand user interactions, monitor your site activity, and analyze conversions.
With the visualization features, you can view the reports in charts and graphs that you can easily share with other team members.
Google Analytics Pricing
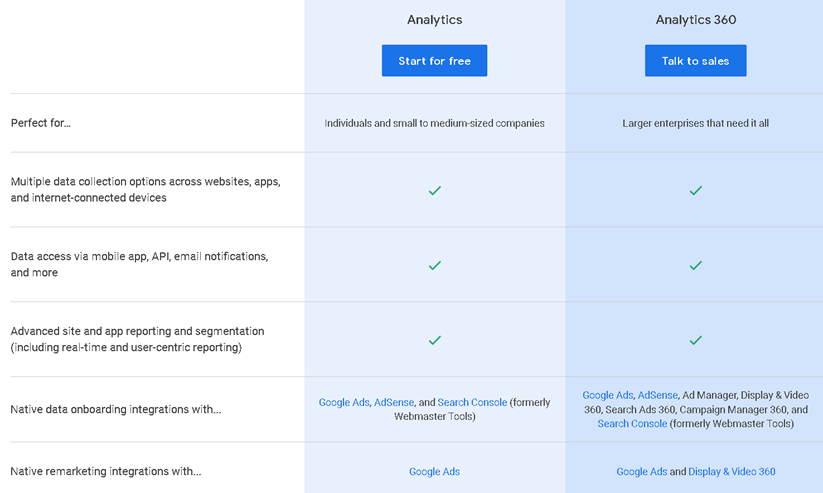
The standard version of GA is free, and its features are sufficient for the needs of most businesses.
The advanced version GA 360 is paid, and it has custom pricing. Some of the main reasons businesses invest in GA 360 are access to advanced analysis, custom funnels, and the data-driven attribution model.
5. Bizible
Bizible is a B2B marketing attribution solution founded in 2011 by Aaron Bird. It is used to track performance across different marketing channels, which helps marketers understand the most effective drivers of engagement and revenue and allot their marketing expenses accordingly. It’s also known as one of the competitors of Dreamdata, another popular marketing attribution tool.
Bizible assigns revenue to touchpoints, interactions that leads have with your site. The main types of milestone touchpoints in Bizible’s marketing attribution are first touch (FT), lead creation (LC), opportunity creation (OC), and closed won deal (CW).
The six of marketing attribution models offered by Bizible are based on these touchpoints. There are both single and multi-touch models available. They are:
- First touch: assigns the full attribution credit to the first interaction.
- Lead creation: assigns the full attribution credit to the point where the user gives their contact information, making them a lead.
- U-Shaped: assigns half of the attribution credit is to the FT and the other half to LC.
- W-Shaped: assigns 30% of the attribution credit to FT, LC, and OC, and the remaining 10% to touchpoints in between.
- Full path: assigns 22.5% of the revenue credit to FT, LC, OC, and CW, and the remaining 10% to touchpoints in between.
- Custom Model: this model allows users to choose custom touchpoints and their percentages of attribution
Revenue Attribution, Simplified
Identify your top performing marketing channels and discover the MRR of each piece of content without typing any code
Try HockeyStack Today
Bizible Features
1. Touchpoint Tracking
Bizible’s touchpoint-based data model lets you view the entire B2B buyer’s journey, including each account, opportunity, buyer, and funnel stage. You can also analyze the details of each touchpoint and capture engagement through different marketing channels.
2. Attribution Modeling
Attribution modeling allows you to assign factors such as revenue and ROI to their touchpoints. It also allows for customization of your attribution reporting and provides access to advanced features such as boomerang journey stages and ABM attribution.
3. Analytics and Reporting
Bizible has easy-to-use, pre-built dashboards that provide marketing attribution insights such as marketing spend, revenue and pipeline attribution, and ROI. You can also create and share CRM reports and answer business-specific questions through ad hoc analysis and your preferred software.
Bizible Pricing
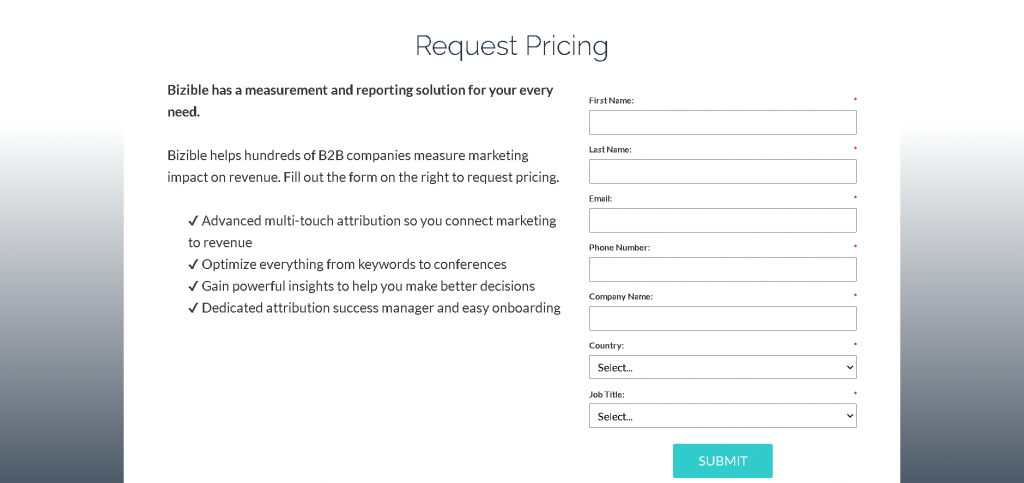
Bizible does not disclose pricing information; it can be requested by filling out a form.
6. Pardot
Pardot is a B2B marketing platform founded in 2007 that helps companies manage their sales and marketing campaigns. It integrates with one of the best CRM software, Salesforce, to provide advanced marketing automation.
Pardot automates tasks such as email marketing, customer behavior tracking, SEO, lead generation, and social marketing. By using the software, users can generate, nurture and score leads, track potential customers and marketing campaigns, and customize customer experiences.
Pardot Features
1. Lead Generation
One of the main features of Pardot is lead generation. It allows you to create landing pages to obtain the email addresses of users interested in your business and products. There are a variety of templates for the landing pages, and the layouts are customizable.
Other tools that Pardot offers for collecting email addresses are drag-and-drop forms, progressive profiling, and top-of-the-funnel (TOFU) content.
2. Lead Management
Pardot gives leads a score for every interaction. For example, a lead who fills out a form gets 20 points. The more actions the lead performs, the higher the score. By looking at the scores, you can identify the leads that are most likely to make a purchase. You can also set the completion actions that you want to be scored.
Pardot also offers an email feature based on triggers. A trigger can be based on time or interactions, such as a download, form filling, or lack of engagement for a long period. Emails are automatically sent to users for triggers, which can also be custom-set.
3. Email Marketing
Pardot has an intuitive email marketing tool that allows you to send customizable emails to recipients.
With the basic package, you can send up to 10,000 email addresses. There are many designs, templates, and personalization options for emails. The auto-responder emails you can build instantly send information that recipients request when filling out forms or landing pages.
The advanced email reporting allows you to see details about how recipients interact with emails, including click-through rates, open rates, and actions taken upon receiving emails.
Pardot Pricing
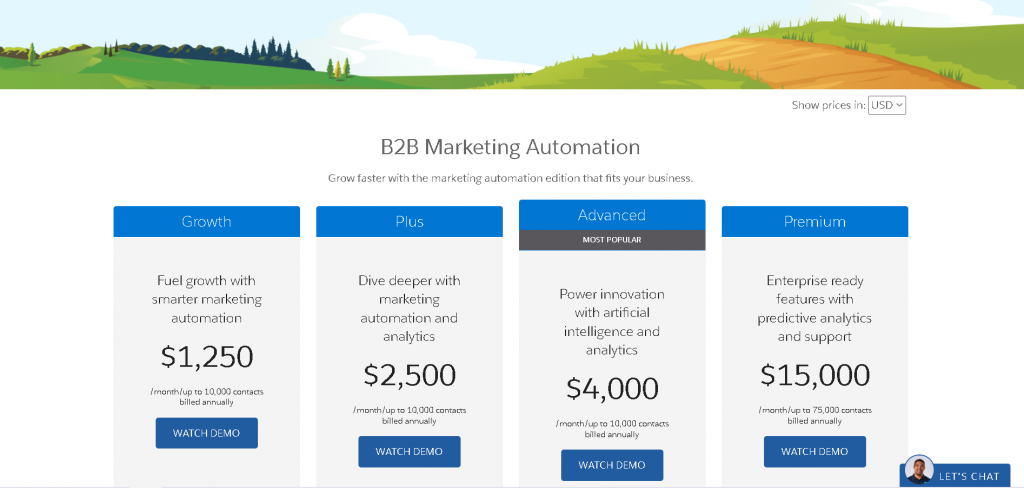
Besides a free demo, Pardot has four pricing plans.
The Growth edition has limited features for getting started. It costs $1,250/month.
For additional B2B marketing analytics features, the Plus edition costs $2,500/month.
The Advanced edition offers AI powered-capabilities and costs $4,000/month.
The Premium edition, suitable for complex marketing teams that need enterprise solutions, costs $15,000/month.
Conclusion
Marketing attribution is essential to determine what marketing channels, campaigns, and ads are the most effective so that you can know areas to focus on. By using the Dreamdata alternatives mentioned above, you can identify the most profitable marketing efforts, nurture and convert more leads, and increase revenue.
FAQ
Dreamdata has a rating of 4.8/5 on G2.
Dreamdata is suitable for B2B growth leaders in small and medium-sized companies with 50-500 employees.
Yes, it has a free plan with limited features suitable for companies starting on marketing attribution or testing the software.


