Google Data Studio Alternatives
Google Data Studio is a powerful digital marketing tool. It helps transform your data into a visual format, making it easier to analyze and interpret.
However, Google Data Studio has its limitations too, such as its lack of data sources and real-time updates. In this article, I will provide 6 alternatives to Google Data Studio to guide you into making a decision that better fits your SaaS.
HockeyStack
HockeyStack is an end-to-end analytics tool for SaaS companies. With HockeyStack, you can track and analyze data from the product, sales, subscription revenue, and marketing in one tool and get access to hidden insights, such as the LTV of a piece of content, or the churn rate of each marketing channel along with users’ reasons for churn.
HockeyStack allows you to build dashboards with no code using any metric you need from any department!
HockeyStack’s Features
HockeyStack offers these features with no code:
- Step-by-step user journey
- Custom dashboards
- Funnels and goals
- Attribution analysis
- Insights
- Surveys
- Revenue analytics
- Segments
and more
HockeyStack Pricing
HockeyStack has a free forever plan and 3 paid plans. Paid plans have a 14-day trial with a 30-day refund guarantee.
You can check out the pricing page here.

HockeyStack Integrations
- Paddle
- Stripe
- Hubspot
- Crisp Chat
- Mailchimp
- Salesforce (coming soon)
- Zapier (coming soon)
HockeyStack Pros and Cons
I might be biased, but this is an objective evaluation of HockeyStack’s pros and cons 🙂
HockeyStack Pros
The unique benefit of HockeyStack is its ability to unify your marketing, revenue, sales, and product data using no code. This allows you to uncover unique insights that you wouldn’t be able to by using multiple tools as they cause you to have fragmented data.
- You can integrate with Stripe, Paddle, and Hubspot and build every single dashboard that you can think of, using all sales, marketing, revenue, and product metrics.
- You can create funnels, goals, and surveys, which are rare to get with other tools on this list.
- You don’t need any developers, tracking is cookieless, and the script is small, so it doesn’t increase your site loading time.
HockeyStack Cons
HockeyStack generally lacks reporting features as it’s not focused on agencies and other reporting-based businesses.
- HockeyStack doesn’t have weekly e-mail reports
- The tool lacks some integrations, such as Salesforce, Mailchimp, and Zapier. (which are on the roadmap)
Looker
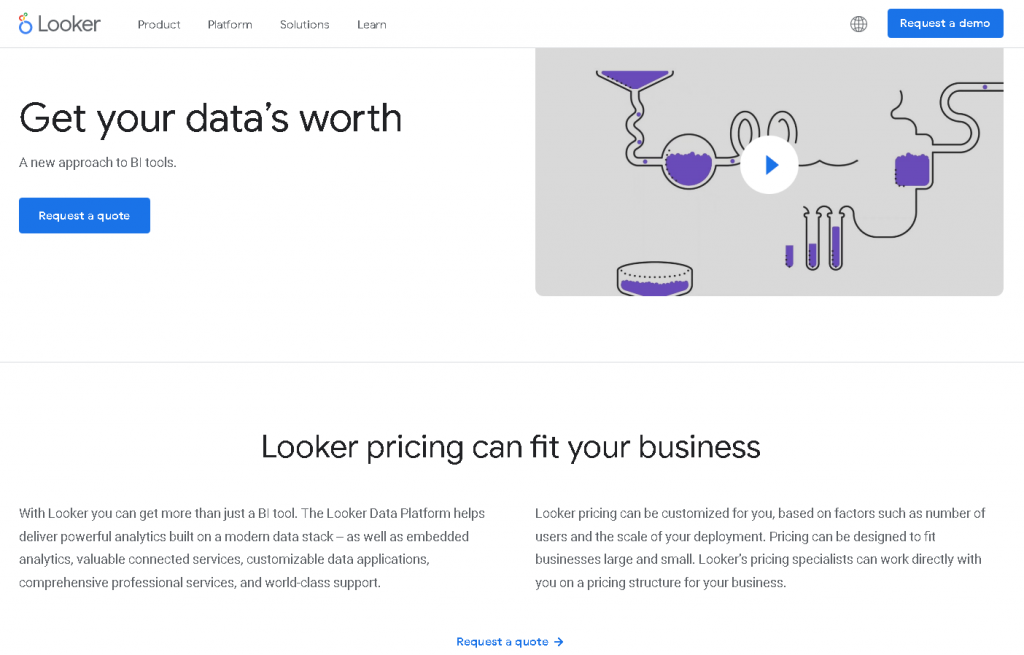
Looker is a cloud-based business intelligence tool that helps businesses visualize their data. It includes interactive dashboards, automation and distribution of reports, and custom data apps.
A unique feature of Looker is its innovative data modeling language called LookML. This feature is flexible and reusable, but it can also be a deterrent from using Looker as it is a new language and has a learning curve.
Looker was founded in California in 2012 by Lloyd Tabb and Ben Porterfield. Google acquired Looker in 2019, and it is now part of the Google Cloud Platform.
Features of Looker include:
- Reports (Reports Interface, Steps to Answer, Graphs and Charts, Score Cards, Dashboards)
- Self Service (Calculated Fields, Data Column Filtering, Data Discovery, Search, Collaboration / Workflow, Automodeling)
- Advanced Analytics (Predictive Analytics, Data Visualization, Big Data Services)
- Building Reports (Data Modeling)
Looker vs Google Data Studio
Key differences between Looker and Google Data Studio:
1. To integrate your data source with Looker, you need to use a SQL database. With Google Data Studio, a SQL based data source is not required.
2. For data modeling, Google Data Studio offers fields that you can customize after connecting your data source. On the other hand, Looker has its own language for data modeling called LookML. LookML is an evolved version of SQL that builds data models and makes analysis easier.
3. Looker has more deployment and training options than Google Data Studio.
Looker Pricing
Looker does not provide pricing information. You can customize pricing based on the size of your business, the number of users, and the scale of your development. Looker also offers a free trial.
Databox
Databox is a cloud-based business analytics tool that gathers various KPIs in one interface. It allows you to create custom dashboards when viewing this data.
Databox has integrations with Google Analytics, Salesforce, HubSpot, Facebook, Shopify, and other sources. It has a mobile app too.
An interesting feature of Databox is that you can stream your dashboards on your Smart TV. According to users, the downsides of the tool include its lack of data connectors and some UI inconveniences.
Databox was founded in Slovenia in 2011 by Davorin Gabrovec and Vlada Petrović. It is used by marketers, sales representatives, executives, and analysts.
Key features of Databox are:
- Performance Metrics
- Dashboard
- Analysis (Ad hoc Analysis, Profitability Analysis, Data Analysis, Key Performance Indicators, Trend / Problem Indicators)
- Ad Hoc Reports
- Ad hoc Query
- Budgeting & Forecasting
- Strategic Planning
- Data Visualization
- Data Mining
Databox vs Google Data Studio
Some differences between Databox and Google Data Studio:
1. Databox gathers all your data in one place, so you have simpler access to reporting than with Google Data Studio. Overall, Databox has less of a learning barrier due to its simplicity.
2. Databox supports iPhone and Android apps, while Google Data Studio is only web-based.
3. Databox has 65+ integrations, while Google Data Studio has 18 native integrations and 400+ partner connectors.
Check out all Databox alternatives!
Databox Pricing
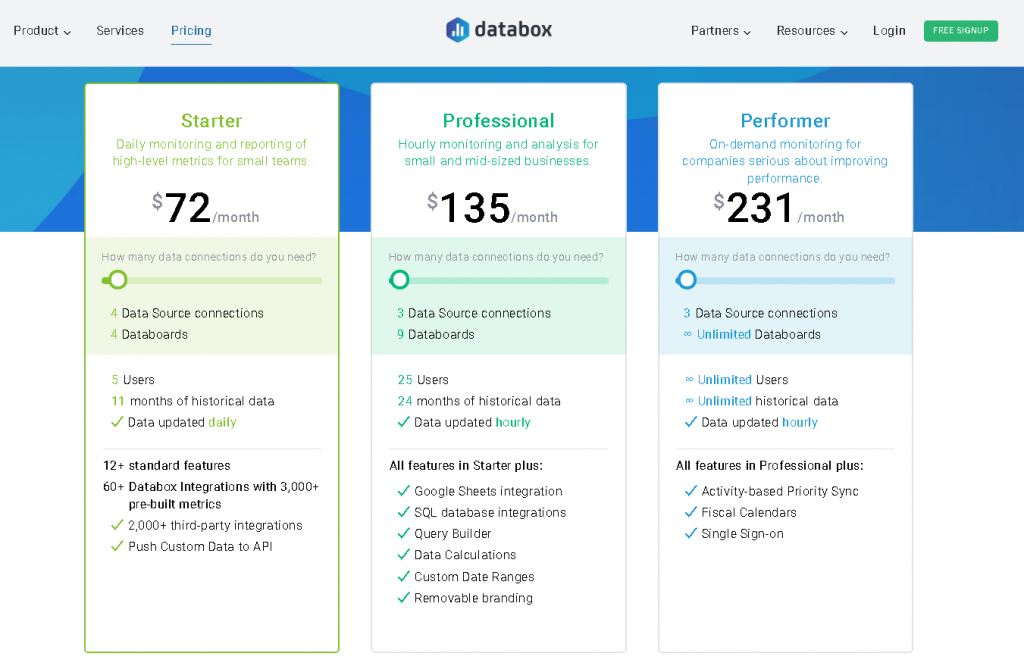
There are 3 pricing options for Databox.
The Starter plan for small teams syncs data daily and allows five users. The Professional program for small and medium-sized businesses syncs data hourly and is for 25 users. The Performer plan has hourly data updates and unlimited users.
Each plan can be customized based on the number of data connections you need.
In addition, there is a Free-forever plan that has standard features, 3 data source connections, and over 60 Databox integrations.
Klipfolio
Klipfolio is a business intelligence software that helps build dashboards and visualize different data services. It is a cloud-based tool that allows real-time monitoring and reports. It integrates with other BI tools such as Google Analytics, Facebook, Tableau, Domo, Looker, and Microsoft Power BI.
Klipfolio provides an intuitive and easy-to-use interface. A downside of the tool, like many others, is its learning curve, as it requires technical knowledge for some features.
Klipfolio was launched in 2001 by CEO Allan Wille.
Here is a summary of Klipfolio’s features:
- Reports (Reports Interface, Graphs and Charts, Score Cards)
- Dashboards
- Self Service (Calculated Fields, Data Discovery Collaboration / Workflow, Automodeling)
- Advanced Analytics (Data Visualization)
- Building Reports (Data Transformation, Data Modeling)
Klipfolio vs Google Data Studio
The main differences between Klipfolio and Google Data Studio:
1. Data Studio has more dashboard templates than Klipfolio, and if you’re working with Google connectors, building a dashboard in Google Data Studio is faster than with Klipfolio.
2. Klipfolio has password encryption feature when sharing dashboards which is not found in Google Data Studio.
3. Klipfolio has over 400 native integrations, while Google Data Studio has 18 Google connectors and 474 partner connectors.
4. Klipfolio has a mobile app and TV screen mode, which are not offered by Data Studio.
Check out all Klipfolio alternatives!
Klipfolio Pricing
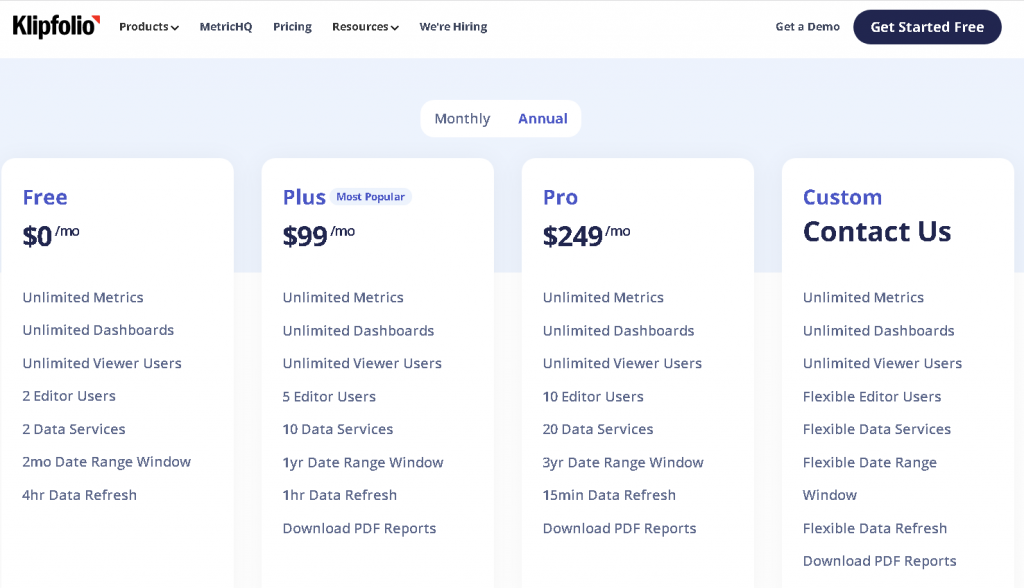
Besides a free trial, Klipfolio has four pricing options.
The Free version 2 editor users, 2 data services, and up to 2 months of date range window.
The Plus is the most popular version for $99/month. It includes 4 editor users, 4 data services, and up to 1 year of date range window.
The Pro version is for $249/month and has 8 editor users, 20 data services, and up to 3 years of data range window.
You can also customize your pricing plan.
Tableau
Tableau is a leading data visualization and business intelligence tool founded in 2003. It is used for reporting and analyzing large volumes of data. You can build customized dashboards and charts, graphs, maps, and stories to visualize data.
Tableau is most popular for the variety of dashboard visualizations it provides and its self-service analytics features. Many users of Tableau state that it has a steep learning curve and a high cost.
Tableau was founded in California by Pat Hanrahan, Christian Chabot, and Chris Stolte. It was acquired by Salesforces in June 2019.
The key features of Tableau include:
- Real-Time analytics: updates key metrics in real-time or at chosen intervals
- Tableau Dashboard: collects all the views and visualizations on a single dashboard
- Collaboration and Sharing: allows you to share your data with your team and company
- Live and In-memory Data: you can work with live connections or extract your data in-memory
- Data Sources: you can establish connections with a wide range of data sources
- Advanced Visualizations: offers a variety of charts and other visualizations for your data
- Accessibility: you can view dashboards on both mobile and tablet
- Revision History : enables access to previous versions of your content
- Licenses: Viewer, Explorer and Creator licenses offer different capabilities
Tableau vs Google Data Studio
Some of the main differences between Tableau and Google Data Studio:
1. In terms of data visualization, Tableau is more powerful than Google Data Studio. It offers a wide variety of graphs and charts that you can use by the drag-and-drop feature, while Data Studio has more basic visualizations.
2. Tableau supports both on-premise and cloud-based installation, while Google Data Studio is cloud-based.
3. The learning curve with Tableau is higher as it has features of higher complexity that require advanced analysis.
Tableau Pricing
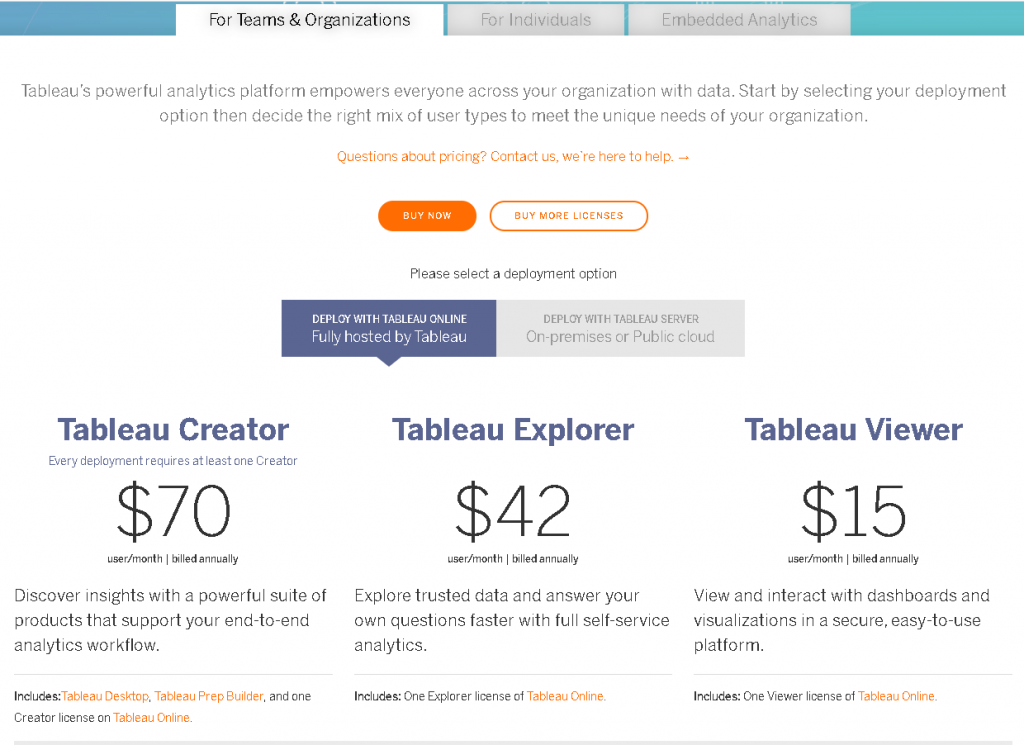
There are 3 subscription choices available for pricing.
Tableau Creator is $70 per user per month, billed annually. This license includes all the features and is for individual analysts and power users.
Tableau Explorer provides full self-service analytics. It is mainly for users who prepare reports for regular users. It costs $42/user per month, billed annually when deployed with Tableau online. On-premises use costs $35/user per month.
Tableau Viewer is designed for people who only view the reports without making changes, such as managers. It costs $15/user per month, billed annually when deployed with Tableau online. When deployed with Tableau server, it costs $12.
Holistics
Holistics is a self-service business intelligence platform. It offers both an interface with is SQL-friendly for data analysts and a non-technical one for other business users. It has a drag-and-drop interface that helps pivot your data and build interactive dashboards.
A key feature of Holistics is its automatic email reports feature. However, some features of Holistics are not as extensive as those of other tools. For instance, it doesn’t have custom visualizations.
Holistics was founded in 2015 by Huy Nguyen, Thanh Dinh Khac, and Vincent Woon in Singapore.
Some of the key features of Holistics are:
- Data Visualization and reporting (Interactive dashboard, Self-service exploration, Complex visualizations)
- Data Delivery (Send reports via email, Shareable links, Push to Google Sheets)
- Automation & Developer Productivity (As-code Data Modeling, Interactive SQL Editor)
- Data Modeling (Data Transform, Data Catalog, Data Lineage)
- User Access Control (User roles and groups, Resource access control)
- Security & Administration (Monitoring and debugging, Two-factor login)
- Client Reporting (Embedded analytics, White label)
Holistics vs Google Data Studio:
A comparison of Holistics and Google Data Studio:
1. Holistics is most suitable for growing small and medium-sized startups, while Google Data Studio is also used by large enterprises.
2. Holistics is generally liked by users but it has some limitations as a new and lesser-known tool. It lacks the Drill-Down feature which can be found in Data Studio.
3. Holistics is a paid service, while Google Data Studio is free to use.
Holistics Pricing
Holistics has a 14-day trial that includes all functionalities.
There are 4 pricing plans available. The Entry plan is for 200 Objects (up to 50 reports) and 10 Users. It costs $100/month.
The Standard plan is for 600 Objects (up to 150 reports) and 20 Users. It costs $250/month.
The Professional plan is for 800 Objects (unlimited reports) and 20 Users. It costs $500/month.
There is also a custom plan for enterprises.

Conclusion
Though Google Data Studio is a popular software with appealing features and visualization capabilities, it is not the strongest BI tool, and therefore may not be the most suitable one for your SaaS.
Important things you should consider when choosing a tool include functionality, customization capabilities, training requirements to start using the tool, and pricing.
Each of the alternatives provided has its unique capabilities and downsides, so it’s important to be aware of what these can mean for your SaaS before making a decision.
FAQ
What is Google Data Studio used for?
Google Data Studio is used to build customizable and interactive dashboards and reports that you can analyze and share with your team. You can also track performance metrics and optimize your marketing performance.
Is Google Data Studio free?
Google Data Studio is completely free.


