Top SaaS Customer Retention Metrics To Track in 2022
Increasing your SaaS customer retention rate by 5% may increase your profits by a rate up to 95%. Since most revenue and profit of SaaS companies come from retained customers instead of new ones, it’s a great idea to look into improving customer retention.
Customer retention is your brand’s ability to turn existing customers into repeat and engaged buyers. Any action you take towards improving customer loyalty is, essentially, about customer retention. Customer retention, which is made up of many smaller metrics that I’ll mention below, is vital for SaaS companies, as revenue is directly dependent on the size of the subscriber base. If your existing customers stop renewing their subscriptions and switch to a competitor, you lose the backbone of your brand’s funds. In short, customer retention reduces churn and keeps your company afloat.
However, most brands still fail to focus on customer retention and instead direct all their attention to acquiring new customers. This is illogical since acquiring new customers is nearly 25 times more expensive than retaining existing ones.
So, how do you improve SaaS customer retention? Fortunately, a few metrics can come in handy to measure your customer retention success. While the metrics may change slightly depending on the type of company and industry you’re in, they’re generally a great starting point for improving customer retention.
In this article, I’ve compiled the top metrics with definitions, formulas, and examples that can help you.

SaaS Customer Retention Metric #1: Monthly Customer Churn Rate
What is the “customer churn rate,” and why is it important?
Customer churn rate is the percentage of customers that cancel their subscriptions or stop buying from you in a specific time frame—the appropriate time frame changes based on the service you provide. For example, an airline will check yearly churn because people tend to buy tickets one or two times a year. When it comes to SaaS, though, the most appropriate time frame to calculate churn rate is usually a month. Subscriptions are often renewed monthly, and people need SaaS services monthly rather than yearly or daily.
As I’ve said before, your retained customers are the people who keep your SaaS company going. An acceptable annual churn rate is between 5 to 7%, which translates to a monthly churn rate of about 0.5%. Any higher than 3% means losing more than 3 out of 100 of your customers each month. If you start with 100 customers at the start of the year, you’ve lost approximately 30 of them by the end of the year. So, to grow your customer base, you wouldn’t need to acquire a new customer–you’d need to make up for the 30 existing customers you lost and then acquire new ones that’ll grow your company.
In summary, you need a low customer churn rate to grow your company without spending all your revenue on acquiring new customers. Besides, if you’ve lost many of your subscribers, chances are you won’t have the funds to acquire new customers either. By keeping a close eye on your monthly customer churn rate, you will know precisely when to revamp your customer retention strategies to ensure that more people stick around and continue using your product.
How do you calculate your monthly customer churn rate?
(# of Lost Customers ÷ Total # of Customers at the Start of the Month) x100
The formula above gives the monthly customer churn rate. For example, if you had 500 customers at the start of this month and lost 10 of them, your customer churn rate of the month would be (10 / 500) x 100 = 2% (a relatively high rate.)
Of course, calculating your monthly churn rate once in a while will not do. You need to keep track of your rate by doing this calculation each month. With the help of an analytics tool like Hockeystack, you can dive deeper into your churn rate numbers to understand why the trends look the way they do, use the survey feature to get customer feedback and use the analytics feature to reveal the patterns of customers and get the complete picture of your customer lifetime value.
SaaS Retention Metric #2: Monthly Customer Retention Rate
What is the “customer retention rate,” and why is it important?
The customer retention rate is the rate of customers you’ve kept after a specific period. They are customers who stay with your brand and continue engaging with your products. Again, this period is a month for most SaaS companies for the reasons I’ve mentioned above.
Your monthly customer retention rate is a neat little summary. It shows you how well your customer service has been doing and how good your product has been working based on customer satisfaction. However, it’s important to remember that this rate is just a rate. It doesn’t tell you everything you need to know about customer retention, and only checking this metric would mean that you’re missing out on other important aspects of brand loyalty.
How do you calculate your monthly customer retention rate?
[ (# of customers at the end of the month – # of acquired customers in the month) / (# of customers at the beginning of the month) ]x 100
This formula gives your monthly customer retention rate. An example of this calculation would be: if you had 1500 customers at the start of May and had 1800 by the end of May after acquiring 500 new customers over the month, your rate would be ((1800-500) / 1500) x 100 = 86.6%.
SaaS Retention Metric #3 Referral Rate
What is the “referral rate,” and why is it important?
Your referral rate is the rate of purchases from your referral programs. So a 5% referral rate would mean that 5 out of 100 of your sales came from referrals. Considering that the global average referral rate is around 2%, this would be an incredible success.

Referral programs bring good/excellent leads, according to 78% of marketers. Your referral program may be based on influencers in the industry, or it may be a customer-to-friend referral program. Both can be as effective as the statistic suggests. However, you can only know whether or not they’re doing good by checking your referral rate.
This rate also shows how many of your customers participated in your referral program, which can be a great indicator of your program’s effectiveness.
How do you calculate your referral rate?
( # of referred purchases / # of total purchases ) x 100
You can use this formula to calculate your referral rate. There are various referral tracking apps that you can use, such as Tapfiliate and Affise. Using the right marketing tools is always helpful. These tools often use referral codes embedded in your links to help you understand the sources your customers have been coming from.
Suppose you notice that many of your customers come through your referral program. In that case, you should ensure that you mention this in your onboarding process so that everyone knows the benefits they will receive by referring customers.
SaaS Retention Metric #4 Revenue Churn (MRR Churn)
What is “MRR Churn,” and why is it important?
MRR stands for monthly recurring revenue. It measures the total income you get from your subscribers in a month. So, MRR Churn is about the revenue you lose over a month in terms of subscriptions (and your revenue churn would be measured over another period, maybe a year.) Usually, SaaS companies turn this metric into a percentage by looking at their MRR at the beginning of the month and comparing this with the MRR churn at the end of the month. I’ve talked more about this calculation below.
Knowing about your MRR churn is essential for two main reasons:
- Product-related Reasons: Your product should be updated with new features or monthly fixes. Since your MRR churn tells you about the customers who stopped buying from you, it does an excellent job showing you how your product is being received. When you compare this metric with your customer churn rate, you can also understand if the money you lose comes from big or small customers and make adjustments accordingly.
- Finance-related Reasons: Your MRR churn gives an idea about how well your brand is doing in terms of funds. It’s wise to decide on your spending (hiring, making new investments, etc.) based on how well you do on this metric.
How do you calculate your MRR Churn?
MRR Churn = (Total Lost Due to Cancellations + Total Lost Due to Delinquent Accounts) by the end of the month
You may include upgrades or downgrades in your churn value, but doing so may blur the bigger picture.
To calculate your MRR churn rate, you would take your monthly revenue from the previous month by multiplying the total subscribers and their payments. Then, you would divide your MRR churn by this value and multiply by 100 to get your MRR rate.
SaaS Retention Metric #5: Customer Acquisition Cost
What is the “Customer Acquisition Cost,” and why is it important?
The customer acquisition cost (CAC) is the resources and costs you must spend to acquire a new customer. This cost includes all sales and marketing expenses, salaries, commissions and bonuses paid to marketers and sales managers, and other expenses due to advertisements. You get your CAC by combining all of these costs and seeing how many customers you were able to get.
There are several reasons why:
- It helps you understand if your customer marketing efforts are fruitful. The average CAC value depends on the industry in which your SaaS product is involved. Still, SaaS brands engaged in business services have a CAC of 228$ per customer to provide a benchmark. If you’re spending more than that in a similar industry, you may need to check out HockeyStack’s marketing optimization tools.
- Since CAC can (and should be) separated into different market segments, you can understand which segments are most profitable for your service and add this information to your ideal customer profile.
- This metric is also crucial for investors as it shows whether or not your company is based on a sustainable growth model.
How do you calculate your Customer Acquisition Cost?
Total Amount Spent on All Marketing Efforts / Total Number of New Customers
Like the other metrics, these numbers are primarily measured over a month or a year. So, if you had spent 2000$ on marketing this month and acquired 200 new customers, your CAC would equal 10$. However, you can measure and use your CAC after significantly changing your marketing team structure or technique if you want to measure success.
SaaS Retention Metric #6: Customer Lifetime Value
What is the “Customer Lifetime Value,” and why is it important?
The customer lifetime value (LTV) measures the revenue you can get from a customer throughout the period they use your product. This value depends on how much they spend on your products and services.
This metric will be crucial when I talk about the below-mentioned LTV: CAC ratio, but it’s also essential. When you measure your LTV, you can predict the revenue your customers will bring in the future. Also, just like any other metric, if you know the value, you can improve it.
If customers do not spend as much as you’d like or as much as you had in mind, it would be a good idea to look into customer engagement. You may want to add new features or create customer feedback surveys to ask what’s keeping them from doing more business with you.
How do you calculate your Customer Lifetime Value?
(Average Purchase Value x Average # of Purchases x Average Customer Lifespan)
The average purchase value may be calculated by dividing your total revenue by the number of orders. The result of this multiplication gives you your LTV. For example, if a customer bought a product worth $50 five times over the lifetime of your relationship, their LTV is equal to 250$.
SaaS Retention Metric #7: LTV:CAC Ratio
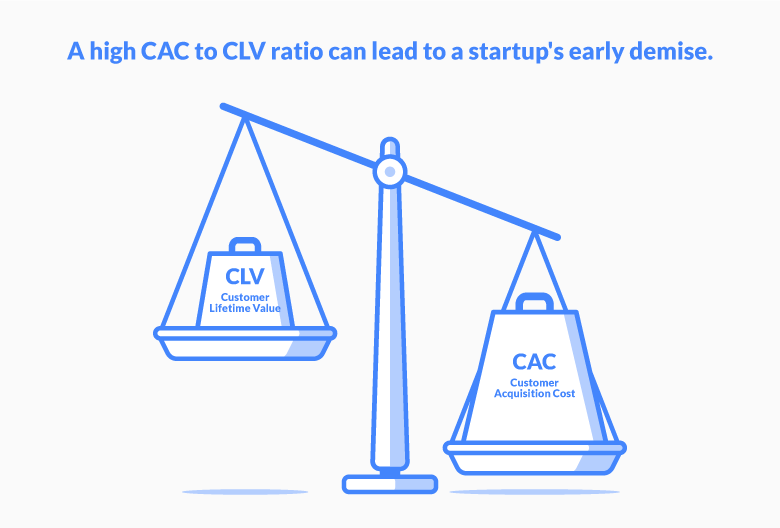
What is the “LTV: CAC Ratio,” and why is it important?
When you bring the two metrics above together, their ratio tells you about the price of acquiring a new customer and the revenue they bring back to your company. The ideal ratio for SaaS is 3:1, meaning that a customer with a lifetime value of 300$ must cost around 100$ dollars to acquire.
This ratio tells you how profitable your marketing efforts are. If your ratio is lower than 3:1, chances are your customers aren’t spending as much as they should with the amount of money you put into marketing. If your ratio is higher than 4:1, you’re not investing enough in your marketing efforts, which would help your company grow its customer base. In short, this ratio tells you a lot about your marketing strategies’ productiveness.
How do you calculate your LTV: CAC Ratio?
Customer Lifetime Value / Customer Acquisition Cost
The formula for LTV and CAC are already above. The only thing you need to do is to take the ratio of the two values.
SaaS Retention Metric #8: Customer NPS Score
What is the “Customer NPS Score,” and why is it important?
The Net Promoter Score (NPS) is a score that you get from customers. The question you ask is usually something along the lines of:
On a scale of 1-10, how likely are you to recommend us to a friend or colleague?
The NPS scoring system then puts your customers into three different categories:
- The Promoters: the customers who answer 9 or 10 are likely to stay loyal to your brand and to grow your brand via positive word-of-mouth. These satisfied customers are much farther ahead in their journey and are great for demand generation and lead generation.
- The Passives: the customers who answer 7 or 8 are also satisfied with your product, but they’re not likely to recommend you to others. They’re also more prone to switching to strong competitors.
- The Detractors: the customers who answer six or less are dissatisfied customers who are likely to damage your brand’s reputation via negative word-of-mouth.
Knowing about your brand’s perception is essential. An average consumer reads ten reviews before making a purchasing decision, proving that your reputation amongst the crowd is a determining factor in your sales. Your NPS score gives you an idea about how you’re doing regarding customer satisfaction: most SaaS companies have an NPS of around 31 to 50%. If your score is much less than that, or worse, if you find it’s in the negatives, you may want to focus on certain aspects of your customer marketing strategy.
How do you calculate your NPS Score?
You’ll first need to collect data by surveying your customers using a survey tool. Then, once you get the data, you can perform the following calculation to get a summary score called the Net Promoter Score:
Total % of promoters – Total % of detractors
The Passives are not included in this calculation since they do not directly affect your brand’s reputation. So, if 80% of your respondents were promoters, 10% were detractors, and 10% were passives, your Net Promoter Score would be 80% – 10% = 70%.
SaaS Retention Metric #9: Product Engagement
What is “Product Engagement,” and why is it important?
Your Product Engagement Score (PES) consists of three different metrics:
- Retention: percent retention after three months
- Feature adoption: percentage usage for your products’ fundamental features (daily or weekly)
- Stickiness: how much a product resonates with customers
These three metrics provide an overall view of how often your customers use your products, their key features, and how much they have incorporated them into their routines.
You may put out new products and features, but you can’t know how well they perform unless you look at how your customers engage with them. Maybe there’s an important UX issue you’re not aware of, or perhaps your customers are not finding what they were looking for. Your PES score will give you a sign if this is the case.
How do you calculate your Product Engagement Score?
(Feature Adoption + Stickiness + Retention) / 3
So your PES is the average of your three engagement metrics. If you had a feature adoption rate of 60%, a stickiness rate of 25%, and a retention rate of 85%, your PES would be (60+25+85)% / 3 = 53.3%.
SaaS Retention Metric #10: Time between Website/Product Visits
What does the time between website/product visits tell you?
Measuring the time visitors spend between visits tells you how frequently they get information from you or how often they use your services. If your customers constantly check your blog, or if they often use your product, you’ve become a part of their business routine. This increases retention since they’re probably already fond of your business’s information, service, and features.
How do you measure the time between website/product visits?
It’s probably impossible to measure the time users spend between visits manually. However, there are multiple software products that you can use to do this for you, such as HockeyStack.
SaaS Retention Metric #11: Loyal Customer Rate
What is the “Loyal Customer Rate,” and why is it important?
Your loyal customers make repeat purchases from your business in a certain period. They can either be existing customers who make new purchases or new customers making additional purchases.
As mentioned earlier, customer loyalty drives the most profit to your business, and they are also the Promoters we have talked about under the NPS score. They are the customers that reduce churn since your product has become extremely important to them.
How do you calculate your Loyal Customer Rate?
Number of Repeat Customers / Total Number of Customers
The number of repeat customers equals the number of your Loyal Customers, which I have defined above. Dividing that number by the total number of customers at the designated period gives you your Loyal Customer Rate.
SaaS Retention Metric #12 Days Sales Outstanding (DSO)
What is “DSO,” and why is it important?
Days Sales Outstanding (DSO) is the average number of days a business takes to collect customer payments. It can also be defined as the time a business takes to collect payments from Accounts Receivable. Since service-based organizations’ credit terms enable customers to pay up to 3 months after using the service, delays leading to a high DSO are inevitable.
In short, a high DSO shows that a company is experiencing delays in collecting payments, and a low DSO indicates that the collected money can be used back in the business quickly.
DSO is important because of several reasons:
- Financial Aspect: a high DSO may make it harder for your business to pay its bills and debts. In such a case, this metric will tell you that you need to optimize your sales terms or your billing/receiving process.
- Customer Satisfaction Indicator: dissatisfied customers are likely to delay their payments rather than get into the process of suspending their subscriptions.
How do you calculate your DSO?
(Accounts Receivable / Annual Revenue) x Number of Days in the Year
We’ve mentioned Accounts Receivable (AR) above. If you don’t know what AR means, it is the credit sales that have not been collected from customers yet.
An example calculation: if a company has 120,000$ in its AR balance and 3,000,000$ annual revenue, its DSO equals about 15 days, meaning that it takes nearly 15 days to collect a typical invoice.
SaaS Retention Metric #13 Users That Are Close To Churn
How do you identify the customers that are close to churn?
SaaS companies collect loads of data from the web and behavioral analytics. Machine learning algorithms can use these data sets to predict the number of customers close to churn. You can set up such an algorithm by following these steps:
- Gather historical data that has been determining your customer base’s churn,
- Upload said data to a prediction service such as the Google Cloud ML Engine,
- Test and use the model to make predictions.
Why is predicting churn significant?
Once you have a working model and can predict customer behavior, you can retain customers who were thinking of stopping buying from you. This “proactive retention” strategy requires effort, so knowing who you should be targeting is essential.
Conclusion
A good overview of your SaaS customer retention requires analyzing a wide range of metrics. These metrics all connect to customer satisfaction, customer acquisition, customer loyalty, customer engagement, and value in one way or another. By gaining more insight into each one of these metrics, you can boost your brand’s revenue and reputation to increase customer retention and maximize value.
FAQ
The answer changes from industry to industry, but a good retention rate for SaaS companies, measured over eight weeks, would be around 35%.
A graph of average eight-week retention rates by industry from Mixpanel: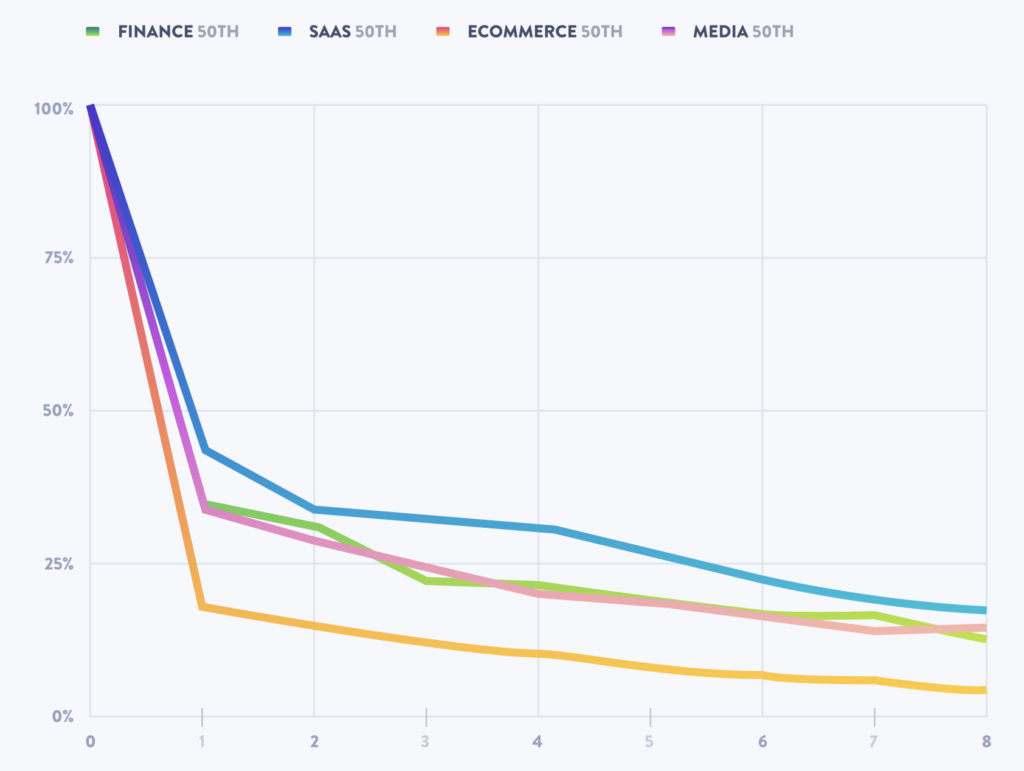
Retention is measured by getting the number of engaged customers you have kept after a specific period and dividing this number by the total number of customers you had at the beginning of the said period.
For most industries, the average customer retention rate is around 20%.


