7 Kissmetrics Alternatives To Try TODAY
Kissmetrics has been in the web analytics market longer than almost all tools currently in the market. Although it is still a useful tool for SaaS companies, it has some negative aspects that might have led you to search for an alternative.
This article will help you find the best Kissmetrics competitor for your SaaS so that you can measure the right metrics with ease, optimize your product, and decrease churn.
In a rush? Click here to skip to the first alternative!
Why you should look for a Kissmetrics alternative?
Kissmetrics is a well-known analytics tool in the market. It helps you gain insight into your website and make effective strategies for the future. What makes it unique from the traditional web analytics tools is that it does not focus on page views and isolated events but rather tracks data about who your customers are.
In other words, Kissmetrics identifies, collects, and analyzes information about individual customers and the overall customer base. Even though this might help you understand customer behaviors and patterns, it can also be a two-edged sword. While you were tracking your customers, you might lose valuable data about the actions they are taking throughout their visit (events such as clicks, taps, swipes, etc.) and outcomes of those actions (page views such as the average time spent on a certain page, the page with the least interest shown, churn rate, etc.)
Some users also mention that the user interface of Kissmetrics is not user-friendly: It is hard to organize the dashboard and understand the features.
Kissmetrics Pricing
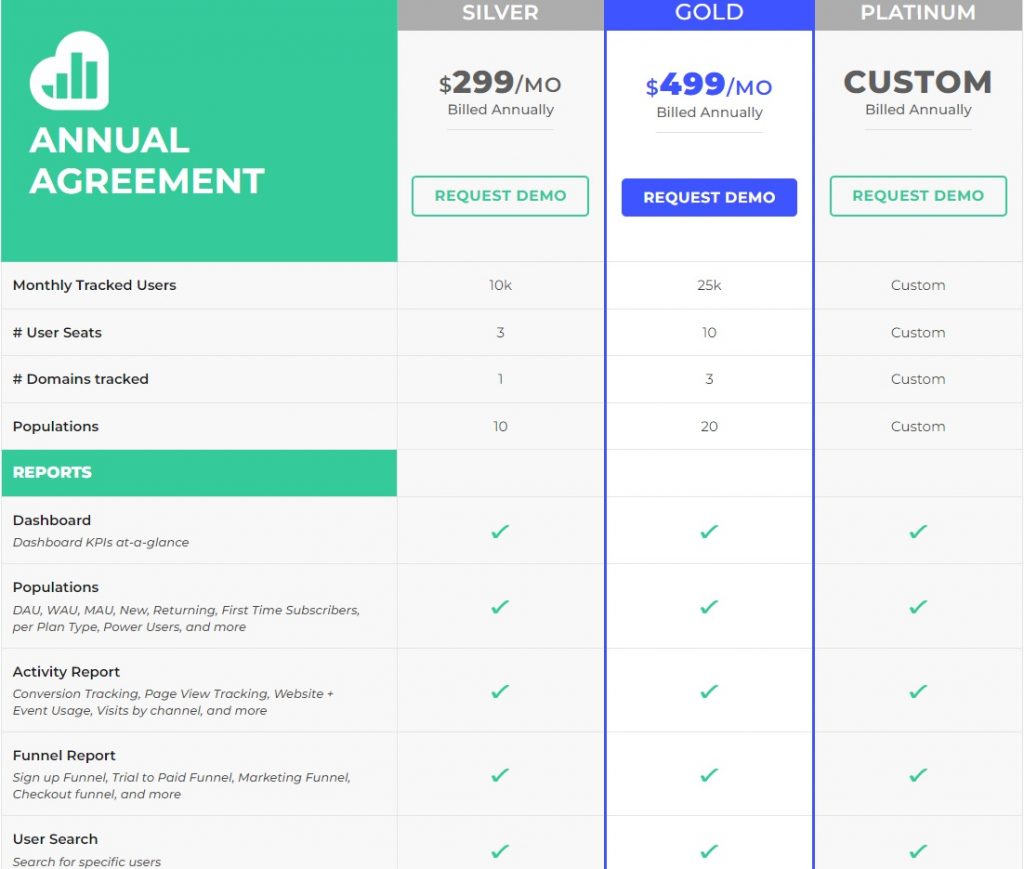
Kissmetrics offers three different packages: Silver, Platinum, and Gold.
The gold package offers quantitative usage differences such as Monthly Tracked Users compared to the silver package.
In addition, reporting options such as Revenue Report and Cohort Report are not available in the silver version but are available in the gold version.
Integration and data retention opportunities also increase in the gold version.
The Platinum version, unlike these two basic versions, includes custom attributes that will be determined by negotiations between the user and the Kissmetrics team.
In addition, reporting options such as Power report, SQL report, and A/B test report are only available in the platinum version.
According to Kissmetrics Terms of use, a 7-day trial is also available.
HockeyStack
HockeyStack is an end-to-end analytics tool for SaaS companies. It unifies marketing, revenue, sales, and product data into one dashboard with no code so that you can understand what really drives revenue at your SaaS. It’s completely no code, and it doesn’t require any setup.
HockeyStack’s Features
HockeyStack offers these features with no code:
- Step-by-step user journey
- Custom dashboards
- Funnels and goals
- Insights
- Surveys
- Revenue analytics
- Segments
and more

HockeyStack Pricing
HockeyStack has a free forever plan and 3 paid plans. Paid plans have a 14-day trial with a 30-day refund guarantee.
You can check out the pricing page here.

HockeyStack Integrations
- Paddle
- Stripe
- Hubspot
- Crisp
- Mailchimp
- Pipedrive
- Salesforce (coming soon)
- Zapier (coming soon)
HockeyStack Summary
The unique benefit of HockeyStack is its ability to unify your marketing, revenue, sales, and product data using no code. This allows you to uncover unique insights that you wouldn’t be able to by using multiple tools as they cause you to have fragmented data.
- You can integrate your payment processor, CRM, and customer support tool and build every single dashboard that you can think of, using all sales, marketing, revenue, and product metrics.
- You can create funnels, goals, and surveys, which are rare to get with other tools on this list.
- You don’t need any developers, tracking is cookieless, and the script is small, so it doesn’t increase your site loading time.
Google Analytics
Offered by Google, Google Analytics is one of the oldest and most well-known web analytics tools today. It is a page view-based platform, mainly focusing on metrics such as conversion rates and bounce rates.
It also tracks other SaaS sales metrics, collects data about customers, and analyzes online presence to show you your strengths and weaknesses. Because Google Analytics offers a variety of features and tools for free, it is widely used by businesses. The smooth and easy integration with almost all Google products and platforms also enables you to handle all of your jobs in just one place.
Features
- Analytics Intelligence
- Reporting
- Data Analysis and Visualization
- Data Collection and Manegement
- Data Activation
- Integrations
Integrations
Some notable integrations:
- Salesforce
- CallRail
- DoubleClick Campaign Manager
- Shopify
- Zendesk
- Marketo
- WordPress
- VWO
- Hootsuite
- Mailchimp
- Segment
Pros
- Excellent traffic attribution; collects data about the source of the traffic
- Easy-to-understand reports and visuals, which are supported by graphs
Ravi K. (verified reviewer), who is a Senior Product Manager in a mid-size business, wrote:
“GA makes it easy for its user to track and analyze their users by providing access to a lot of system reports like audience demographics, acquisition reports, behavior reports like pages visited, bounce rate, time on site, etc.”
- Complete integration with almost all Google services and extensive list of other integrations
- Tracks in-depth data about your customers
Amanda G. (verified reviewer) who is a Digital Marketing Consultant in small business wrote:
“Analytics also provides in-depth information about the users on your site, demographics like age, gender, as well as location, and interests. This information can be invaluable from a marketing standpoint.”
Cons
- Not good at event tracking (specific actions your customers are taking)
- Hard to get use to the tool; steep learning curve
Michael M. (verified reviewer) who is the founder of small business wrote:
“It’s complicated and complex and hard to get a handle on at the beginning. This is especially true when it comes to setting it up.”
- Does not explain the reason of specific user journey patterns
- Hard to integrate with a revenue analytics tool
- Slows down your website
- Requires custom development for conversion goals
Taylor B. (verified reviewer), who is Business Development Manager in a small business, wrote:
“The main downside is the coding to add to your website. It might be tricky for first-time users to know where exactly to add it.”
Pricing
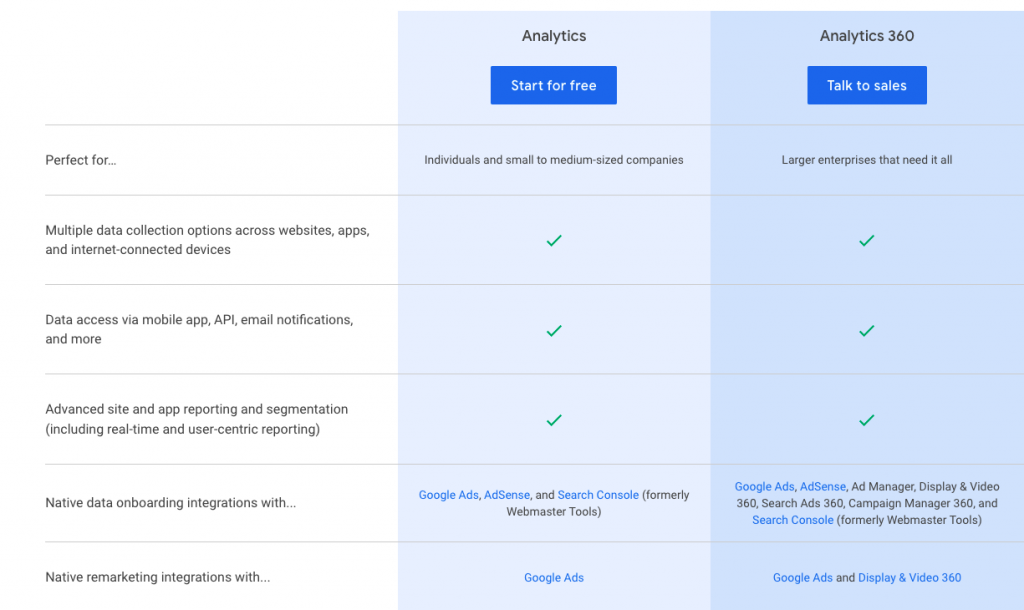
Google Analytics only offers two price plans: Google analytics (free) and Google Analytics 360 (starts from $150,000/year). It offers a variety of features, metrics, and tools in its free version, but it can only support small or mid-sized businesses. If you are a large enterprise, you need to contact a sales representative for price information.
Matomo
Matomo, formerly known as Piwik, is a free and open-source web analytics platform founded in 2007. The tool highlights 100% data privacy and data ownership, which is controversial for Google Analytics because they store and share your data with third parties. Matomo also enables you to make changes to the code of the platform (open-source) for your own needs and preferences, allowing you to personalize the whole system.
Features
Main features:
- Web Analytics Features (Real time data updates, customisable dashboard, row evolution, etc.)
- Premium Features (Heatmap analytics, session recording, A/B testing platform, etc.)
- Administration Options
- Tracking API
- Data Export and APIs
- Log Analytics
- Technical
- User Privacy
- Community Contributions
- Help and Support
Integrations
Some examples:
- WordPress
- Drupal
- Joomla
- SilverCart
- Magento
- Koken
- Akaunting
- Pageflow
- iOS Apps and Android Apps
Pros
- Easy to install, use and upgrade
- 100% data ownership and data privacy
Christoph W. (verified reviewer), who works at a small business, wrote:
“Matomo allows us to keep user tracking data to ourselves, and it gives us the controls to be privacy-first from the get-go. There is absolutely no reason to use a third party to collect user or visitor data for you and deal with the headaches of privacy law compliance that entails.”
- Range of features and variety of tools
- Customization
A verified reviewer working in a small business wrote:
“The best part is the customizations it allows for above and beyond what Google analytics offered.”
Cons
- Charts and graphs are not intiutive and hard to understand
- Learning and adapting to certain features takes time and effort
Susan B. (verified reviewer who works at a small business wrote:
“It is a bit cryptic what some of the functions mean inside Matomo…”
- Confusing maintenance and general navigation
- Lack of comparison tools
A verified reviewer working in an agency in marketing and advertising with more than 1000 employees wrote:
“Comparison tools are not readily available, and attribution with secondary dimensions are largely disorganized or not available.”
Pricing
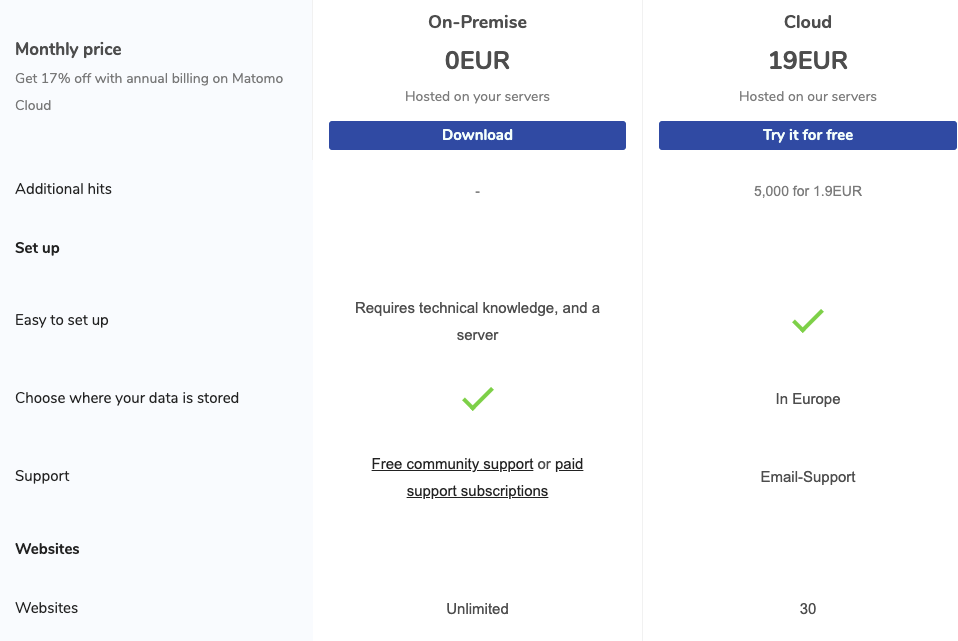
There are two price plans you can choose according to the features you want: On-Premise and Cloud. On-premise is a free price plan, but if you want to add other features you need to pay a yearly fee. Extras start from €29/year and increase up to €499/year.
Woopra
Woopra is a real-time web analytics tool used by sales, service, and marketing teams. It helps businesses to track and analyze customer life cycles and collects data about customer behaviors and patterns. Focusing on individual-level data, Woopra aims to aid optimization and growth throughout the whole life cycle.
Features
Main features:
- Metrics & Tracking
- Reports
- Triggers & Automations
- Integrations
Integrations
Some notable integrations:
- Azure
- BigQuery
- Dropbox
- Google Drive and Google Ads
- Hubspot
Pros
- Effective real-time tracking and ability to chat with customers
- Useful and effective integrations
Titus C. (verified reviewer) who is a director of an enterprise in corporate marketing wrote:
“It can integrate with a large variety of tools, and can easily map different databases without having to write SQL.”
- Customizable dashboards and categories for dashboards
- Specific features for certain actions and detailed reports
Kevin M. (verified reviewer) who is an Account Executive in an enterprise wrote:
“… I have a better idea about the overall processes that are carried out in my sales, marketing and product publishing department and this is all due to the custom tracking and analytical reports that provide me the whole view about the customer journeys, trends, and segmentation.”
Cons
- Requires time and engineering to set up and track all the metrics
- Hard to adapt and learn all the details of the product
Mathew P. (verified reviewer) who works in a mid-size business wrote:
“It can be a bit tricky to get the most out of the product. It is often difficult for beginners to understand and operate.”
- Frequent bugs and glitches
- Action-based price plans
Jon W. (verified reviewer), who is an architect in a mid-size business, wrote:
“Woopra’s action-based pricing can add up if you aren’t careful since putting users into cohorts and updating user profiles also creates actions.”
Pricing
Woopra offers four different price plans according to the number of actions taken per month. While the core plan is free, the other three plans (Startup, Pro, and Enterprise) are at the high end of the market as prices. You need to contact a sales representative for further information.

Smartlook
Smartlook is an analytics solution for web and mobile platforms, serving all sizes of businesses. It emphasizes the whys behind user actions and behaviors: Why do users prefer certain actions? Why don’t they use some features? Why do they churn? By eliminating guesswork, Smartlook enables you to see your strength and weaknesses and helps you to make powerful plans.
Features
- Recodings
- Heatmaps
- Events
- Funnels
- Analytics & Reporting
- Retention Tables (only for web analytics)
Integrations
Some notable integrations:
- Google Analytics
- Slack
- Zapier
- Integromat
- Zendesk
- Intercom
- Sentry
- Mixpanel
Pros
- Can isolate recordings and share recordings
- On-screen navigation
Arla C. (verified reviewer) who the Head of the Customer Service/Contact Center in a mid-size business wrote:
“The best part of the tool is the way we can review the customer’s on-screen navigation throughout the time they are on your website. I have never witnessed a tool doing this apart from screen capture.”
- Precise user location
- Detailed user journey reports
Juan Z. (verified reviewer) who works in a small business wrote:
“This app also provides event and analytics that improve the realization of the user journey inside your app, helping it funnel and discover the weaknesses you have to improve and the strengths you must keep.”
Cons
- Discparancies in web and mobile versions
- Requires IP adress for recording search
Arla C. wrote:
“We would need IP address as a mandatory field to search. Instead, we should be able to search recordings by customers account names and info within API integration to customers databases in the commerce cloud.”
- Lacks maps to see where the active and completed sessions take place
- Generally slower compared to other platforms
Carlos A. (verified reviewer) who is a content created in a small business wrote:
“The processing of sessions takes a bit too long to be completed. The software itself is a bit slow compared to other programs.”
Pricing
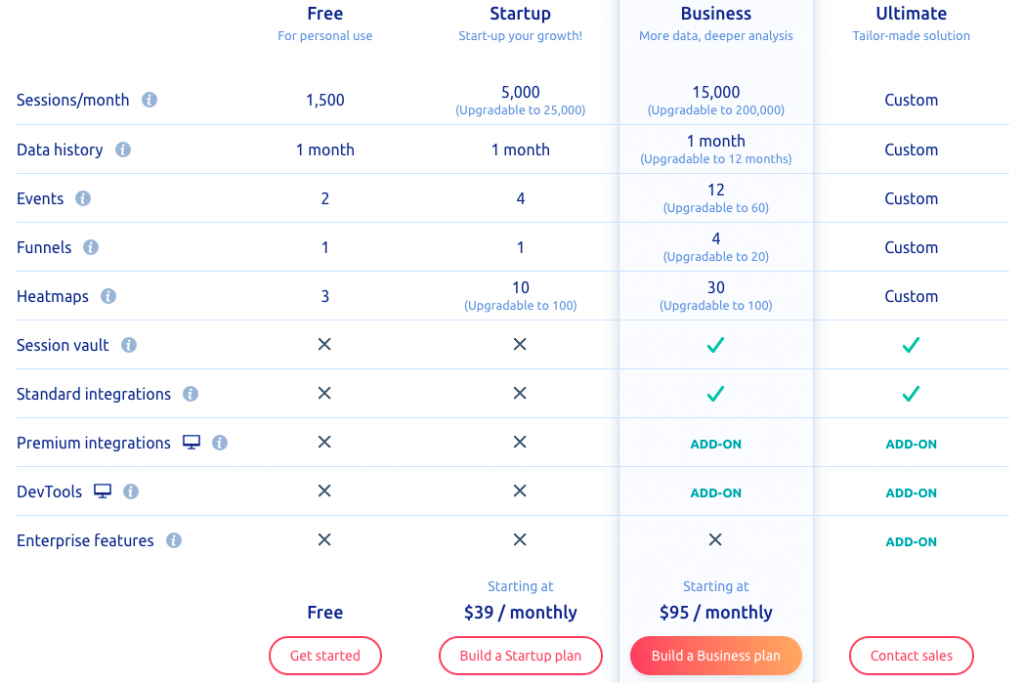
Smartlook offers four different price plans, which are budget-friendly for all types of businesses: Free, Startup, Business, and Ultimate. The pricing is based on sessions per month. If you want to customize your own plan, you need to contact a sales representative.
Hotjar
Hotjar is a new-gen web analytics platform that combines Analysis and Feedback tools to give you insights about your website and improve your user experience/user engagement. Hotjar divides its framework into two concepts: Online Behavior and Voice of Users. While the Analysis tools measure and track data about Online Behavior (user behaviors and patterns), the Feedback tools enable you to hear the voice of users (what your users have to say).
Features
Main features:
- Heatmaps
- Recordings
- Incoming Feedback
- Surveys
- Integrations
Integrations
Notable integrations:
- Slack
- Segment
- Hubspot
- Google Optimize
- Omnicovert
- Optimizely
- Zapier
Pros
- Automatically tracks everything with a minimal code load
- Easy to use with simple but robust analysis
Justin L. (verified reviewer), who is a Marketing Operations Manager in a mid-size business, wrote:
“I like that it’s lightweight and simple to use. It’s not trying to go overboard with complicated functionality but is plenty robust to provide key insights.”
- Free version provides everything a early-stage startup needs
- Offers heatmaps
Matt B. (verified reviewer) who is an Operations Consultant wrote:
“I find the heatmaps to be the most useful, dare I say addicting. I use Hotjar currently with a client of mine running events, so they are so helpful for us to understand the user journey to ticket purchase.”
Cons
- Lack of customer support
- Clunky and excessively big heatmaps
Colin J. (verified reviewer) who is the Director of Marketing in an enterprise wrote:
“Sometimes exported heat maps can be clunky to view as they are image files that pull the entire length of a mobile-optimized webpage. If someone has robust photo-viewing software (ex. Photoshop), then it’s not a big deal. But for lower function photo viewers, it can be difficult.”
- Lack of useful and powerful filters
- User interface is not useer-friendly
An Administrator (verified reviewer) in a Computer Software company wrote:
“The UI of the tool is a bit clunky so it becomes a bit difficult for some of my employees who are not so tech-savvy to understand the settings and find what they are looking for.”
Pricing
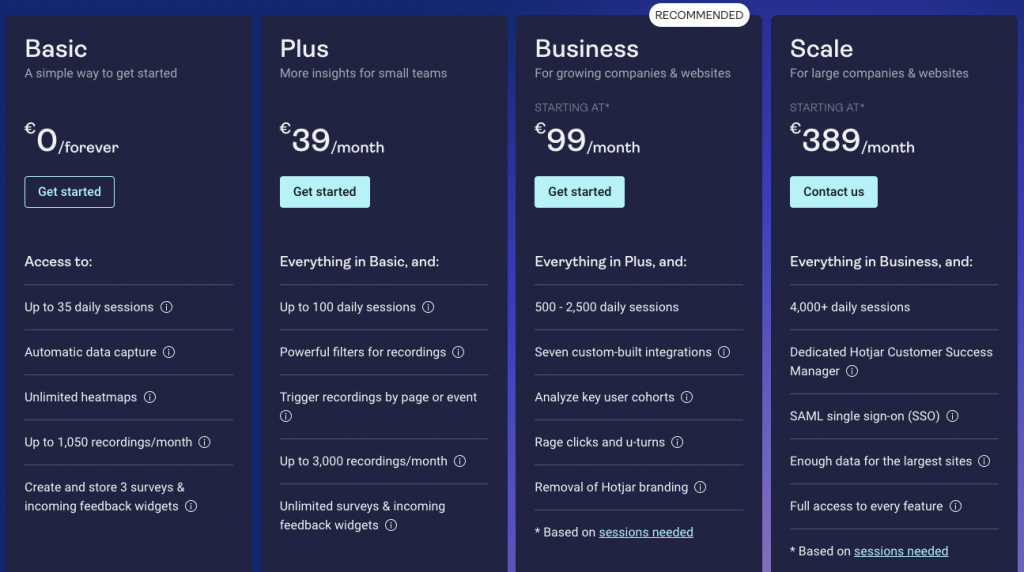
Hotjar offers four different price plans according to your business’s scale: Basic, Plus, Business, and Scale. The basic version provides everything an early-stage startup needs for free. The Plus plan is €39/month, while the Business plan starts from €99/month, and the scale starts from €389/month. You need to contact a sales representative to start using the Scale plan.
Looker
Now part of Google Cloud, Looker is an analytics-oriented business intelligence platform. It is a versatile tool that can integrate well with various platforms and products and connect with popular databases. Its robust insights and useful metrics allow you to explore and understand user behaviors and patterns. A unique feature Looker offers is its modeling language LookML. LookML is an easy and flexible language that enables teams to control their data in the collection, combination, and sharing processes.
Features
Main features:
- Business Intelligence
- Embedded Analytics
- BI and Data Visualization Solutions
- Data Modeling
Integrations
Some examples:
- Segment
- Google platforms
- Zapier
- Dropbox
- Slack
- Google BigQuery
- Snowflake
- AMazon Redshift
- Oracle
Pros
- Excellent customer support
- Intiutive and user-firendly user interface
An anonymous reviewer (verified reviewer) who works in a mid-size business wrote:
“Looker is very intuitive, which I think is the best characteristic… I have found that with a few hours of self-practice, most people are very comfortable using Looker and understand where to find information.”
- Does advanced modeling and visualization with simple syntax
- Ability to create several dashboards according to your needs and preferences
Kendra S. (verified reviewer), who is an Account Manager in a mid-size business, wrote:
“The data it can gather is overall excellent, beneficial with sales and account management day-to-day when reporting out to clients. You can customize the data as well and create multiple dashboards depending on what you are looking for.”
Cons
- Coding knwledge is needed to create custom charts
- Lack visualization and customization of visuals
Andries V. (verified reviewer) who is Data Scientist/Engineer in a small business wrote:
“The product is way behind the times and limited with respect to visual customizability – to put it simply, you can get a lot more out of Excel, than our of Looker from a visual and presentation layer.”
- LookMl is inaccessible if you don’t know SQL or schemas
- You cannot customize presentations
An administrator (verified reviewer) in a mid-size computer software company wrote:
“Still needs more work on the presentation layer. When it comes to the customization of visualizations as well as the export/scheduled PDF reports, we are encountering a number of issues or product gaps… A simple example is the ability to customize the text (font, size, color), which many of our end customers have requested. It’s also not easy to add an image (e.g. logo) to make a report more presentation ready.”
Pricing
Looker does not provide any information about price plans. However, you can try the platform for free. If you contact a sales representative, they tailor-made a specific price plan for your needs and preferences.
Conclusion
There are many alternatives you can look at before deciding on a web analytics tool. Each of them focuses on different parts of analytics and offers unique features and tools. It is hard to say that any of these Kissmetrics alternatives are better than Kissmetrics because better is very subjective in the SaaS business. You need to make sure that your needs and preferences are aligned with the tool you are going to choose and use.
FAQ
Kissmetrics offers three different price plans for both SaaS and Ecommerce: Silver, Gold, and Platinum. While the Silver plan is $299/month, the Gold plan is $499 per month. A platinum plan is a custom plan that is tailor-made just for you, so the price changes from product to product. All of the price plans are billed annually and you can request a demo.
Kissmetrics is a cloud-based web analytics tool, so it stores and manages data on a network of remote servers hosted on the internet rather than on local servers.


