Check Out These 7 Power BI Alternatives For Your SaaS
Power BI is a data visualization tool designed and offered by Microsoft. As its name suggests, the primary focus of Power BI is business intelligence.
Power BI is a cloud-based tool and provides its users with several services under “Power BI Services.” Power BI is offered for both mobile and desktop use, and the desktop use is enhanced with “Power BI Desktop.”
In this article, I will provide alternatives to Power BI and show the pros and cons of each alternative comparatively.
Why You Should Look for PowerBI Alternatives
Power BI is a popular software tool; there is no denying that. However, there are some critical problems that it has. It has a steep learning curve, according to the reviews. This situation is especially problematic if you are a newly-founded company with little experience in the sector.
It is also not possible to use PowerBI on the Mac operating system, making it fall behind most other data visualization tools.
Power BI also slows down or crashes if it processes large data sources. In today’s day and age, this can be a problem even for small businesses that need to consolidate large volumes of data from several different sources. While Power BI is a strong dashboard software tool compatible with Microsoft services, users report that they often experience crashes, causing them to look for Power BI alternatives.
PowerBI also limits collaboration between users who don’t have similar packages. This means that if you have the premium package, other users will easily not be able to collaborate with you on the project unless they possess the same paid plan.
Looker
Looker is a business intelligence platform founded in 2012 by Lloyd Tabb and Ben Porterfield. Looker was acquired by Google in 2019, and now it is a part of Google Cloud. Looker focuses on facilitating data collection and visualization of data.
This platform is a big help for both small and large companies. Looker is trusted by 2000+ companies for their data analysis processes, including one of the most important companies of the last couple of years, Moderna.
Features
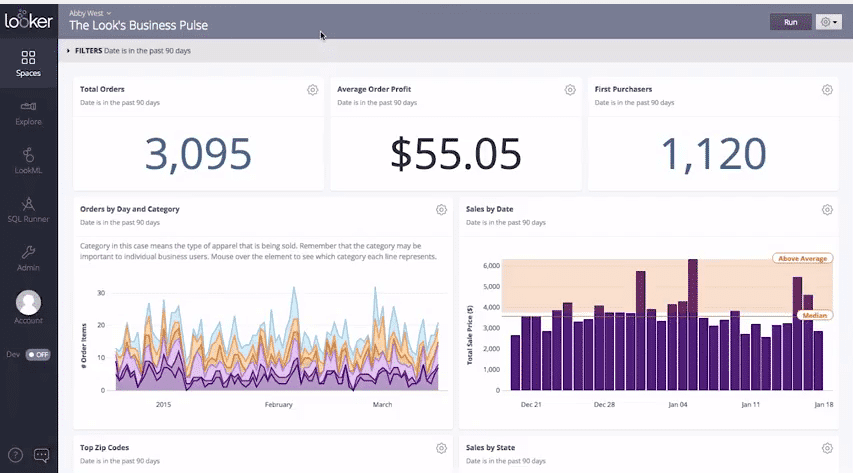
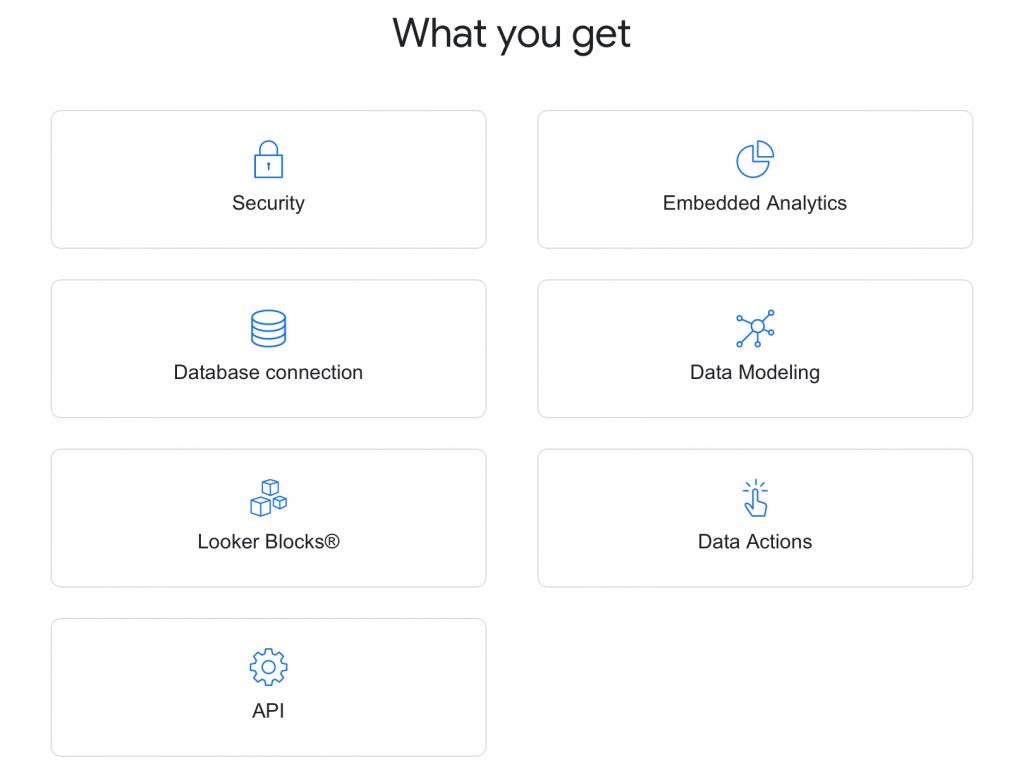
- Graphs and Charts: Looker provides its users with clearly understandable graphs and charts that facilitates the understanding of data. This is especially important for your data analysis process.
- Data Column Filtering: You can filter the data displayed according to specific criteria and doing so you will narrow down the records displayed which makes it easier to find the desired results.
- Big Data Services: With the big data services of Looker users can maximize the value of data and analyze big data.
- Data Modeling: Data modelling is creating visual representations of desired parts or whole of a data pool, which makes your entire data analysis process more engaging.
- Data Visualization: You can use Looker to translate large data sets and metrics into graphs and charts.
Integrations
- Salesforce
- Google Analytics
- Facebook Ads
- Google Ads
- Shopify
- MongoDb
- MySQL
Pros of Looker
- Looker has an easy learning curve, its user interface is easy to understand and thanks to amazing visuals.
- Collaboration with other teammates is effortless, which puts it in a good place among Power BI alternatives.
- You have endless options to build from templates. Looker allows its users customize the tables and charts in accordance with their specific needs. This allows you to have next to unlimited data visualization capabilities.
- With the core-visibility of Looker you can monitor the entire worklfow along with live data.
- The customer service team is very responsive and solution-oriented which is one of the most important qualities for saas BI tools.
Cons of Looker
- It is expensive when compared with some of its competitors. It could have a cheaper version with limited features because not all features are needed for every user. People with less complicated tasks could have paid less.
- Looker is slow from time to time which can be very frustrating.
- It needs a lot of upfront investment
- Table calculations are not being saved therefore they must be rewritten whenever a table is deleted.
- Even if it is easy to use after the initial setup, setup is not the easiest and there are not enough trainings or documentations available.
Pricing
The pricing options are not available on Looker’s website, but reviews on third-party websites show users pay around 5500 dollars/month initially however, if the number of users increases to 10, they state they would need to pay nearly double.
Tableau
Founded in 2013, Tableau is an American interactive data visualization company. The company’s primary focus is business intelligence. Tableau was acquired by Salesforce, a pioneer company in the CRM field, in 2019. The acquisition cost 15.7 billion dollars to Salesforce. Many organizations around the world trust Tableau for their data; these companies include Verizon, LinkedIn, Lenovo, and Lufthansa.
Features
- Tableau Dashboard: Tableau Dashboards provide a good overview of data which is essential for data visualization.
- Collaboration and Sharing: Tableau allows its users to collaborate and share with other users in real-time. The data can be shared in the form of visualizations, sheets, dashboards, etc.
- Advanced Visualizations: Tableau offers its users a wide range of visualization options such as: Histograms, Bar Charts and Motion Charts.
- Trend Lines and Predictive Analysis: Thanks to the strong front end of Tableau creation of trend lines and forecasting is easy.
- Cross Database Join: With this feature of Tableau you can join data from two different databases as if they were in the same database.
Integrations
- ServiceNow
- Splunk
- Google Analytics
- Amazon Redshift
- Google Sheets
- PostgreSQL
- Vertica
Pros of Tableau
- Tableau allows its users to create interactive visualizations without any hassle by it drag and drop functions
- Tableau can handle large amounts of data easily. You can create visualization containing millions of rows of data without disturbing the performance of the dashboards.
- Tableau allows its users to use other scripting languages. Users can include Python or R for complex calculations. Even if Python is not a native scripting language accepted by Tableau, you can import it.
- Tableaue is mobile friendly , it offers its users an enhanced mobile app for both IOS and Android devices.
- Tableau is relatively cheap when compared to other big data softwares.
Cons of Tableau
- Tableau is not a complete open tool, meaning that new visuals should be recreated instead of being imported.
- Tableau’s parameters are static and single value.
- If the developer and the end-user have different screen resolutions the dashboards gets disturbed.
- Tableau is limited in terms its capabilities in preprocessing the data. Since data cleansing is a very important step in data visualization this is an important setback.
Pricing
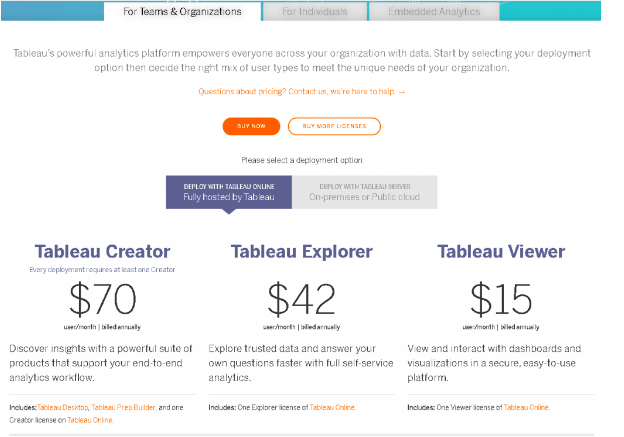
Tableau has two categories for pricing: Teams & Organizations, and Individuals.
For individuals, Tableau costs 70 dollars/month. For teams and organizations, the prices vary between 15 dollars and 70 dollars.
Google Data Studio
Google Data Studio is a web-based tool. Google introduced it in 2016. Data Studio is part of the Google Analytics 360 package. It is not only one of the best Power BI alternatives in the field but also a solid tool overall.
Features
- Reports Interface: Reports interface allows users to call reports from other SAP application components.
- Dashboards
- Score Cards: It is the graphical representation of progress for some entity
- Historical Snapshot: With this feature you can report on historical data.
- Email Reports
- Real-Time Updating: With real-time updates you can make more informed and accurate decisions.
- Graphs and Charts
Integrations
- Adverity
- Supermetrics
- Megalytic
- Power My Analytics
- TapClicks
- Google Analytics
- Big Query
Pros of Google Data Studio
- Google Data Studio is free for all where most of its competitors require some payment.
- Google Data Studio offers various different integrations and data connectivity choices.
- It has a starightforward and easily understandable interface.
- Google Data Studio is cloud-based meaning that users do not need to worry about infrastracture or installation.
- It is built on the premises of live connection meaning that when a report is accessed and changed those data will be updated automatically
Cons of Google Data Studio
- Even if Google Data Studio has various integration and data connections, some of these are prone to failure
- In order to use Google Data Studio you need to pay for a third-party software.
- Being a Google Product is advantageous for Google Data Studio but it does not support Excel to promote other Google prdoucts.
- It lacks some of the basic features that it competitors have.
- As the complexity of the desired function increases the loading speed of Google Data Studio decreases exponentially.
Pricing
Google Data Studio is free.
HockeyStack
HockeyStack is an end-to-end analytics and attribution tool for SaaS companies. With HockeyStack, you can consolidate data from different departments and create customized dashboards without relying on a third-party visualization tool.
By breaking data silos, HockeyStack enables you to uncover crucial insights such as the LTV of a customer, top referral channels by revenue, pieces of content that drive the most conversions, and even the number of MRR of each marketing channel.
As a completely no-code tool, HockeyStack enables you to visualize your data using either pre-defined templates or by building one from scratch with a simple designer. The tool is also compatible with numerous marketing and sales platforms including HubSpot, MailChimp and Stripe, allowing you to get the complete picture of your processes.
HockeyStack’s Features
HockeyStack offers these features with no code:
- Funnels allowing you to view how user behavior changes across the customer journey
- Goals to help you track each micro and macro conversion from blog post views to signups
- Surveys to uncover the dark funnel and get user feedback to improve the customer experience
- Segments to group users by behavior and other metrics to create personalized marketing strategies
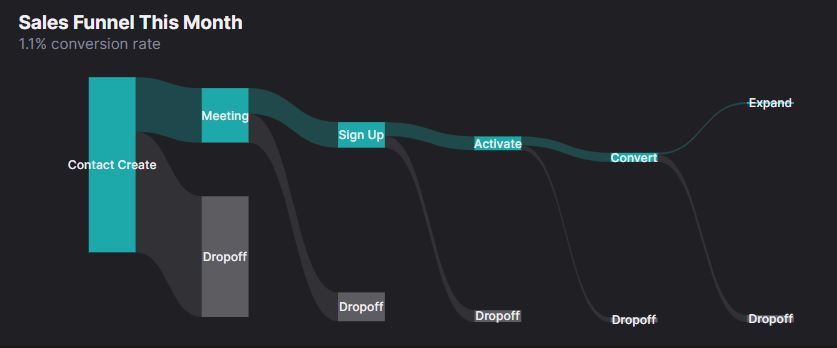
Let’s take a look at some of these features in action.
Here, you can see a sales funnel mapping out the entire journey:
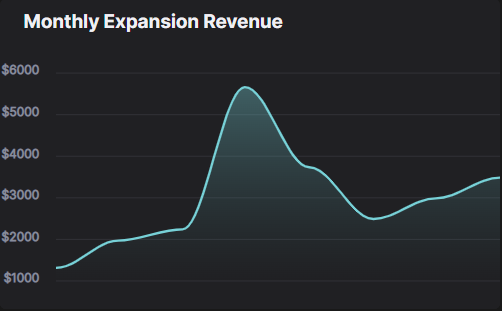
You can also build a dashboard with charts showing how revenue changes over time due to expansions:
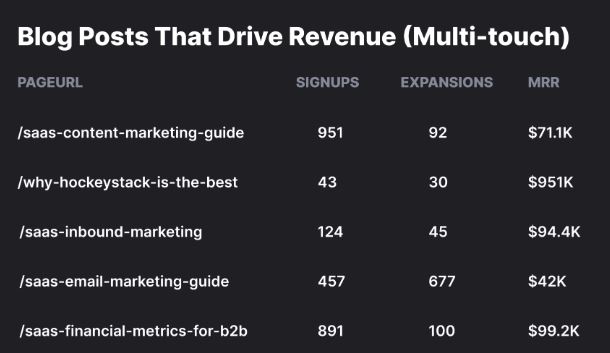
And a report showing the revenue generated by each piece of content:
As you can see, the possibilities are practically endless. You can check out the live demo here.
HockeyStack Pricing
HockeyStack has two paid plans, both of which have a 14-day trial with a 30-day refund guarantee.
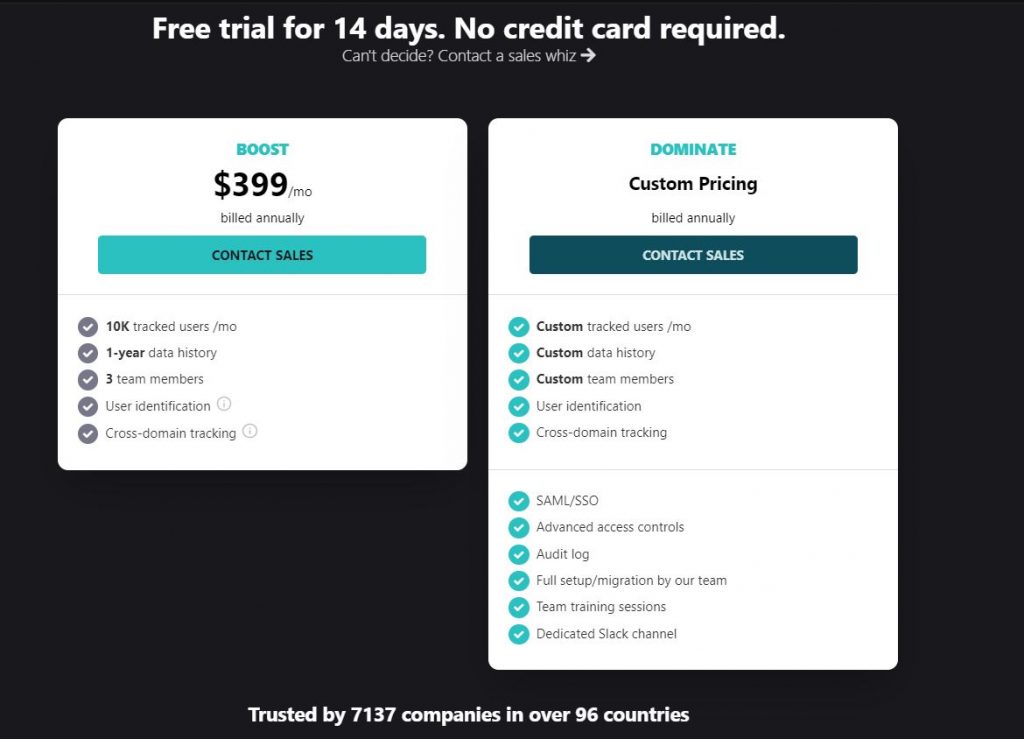
You can check out the pricing page here.
HockeyStack Integrations
Here are some of the integrations that are possible with HockeyStack:
- Paddle
- Stripe
- Hubspot
- Crisp Chat
- Mailchimp
- Salesforce
- Zapier (coming soon)
You can find the full list of integrations here.
HockeyStack Pros and Cons
HockeyStack Pros
The unique benefit of HockeyStack is its ability to unify your marketing, revenue, sales, and product data using no code. This allows you to uncover unique insights that you wouldn’t be able to by using multiple tools as they cause you to have fragmented data.
- You can integrate with Stripe, Paddle, and Hubspot and build every single dashboard that you can think of, using all sales, marketing, revenue, and product metrics.
- You can create funnels, goals, and surveys, which are rare to get with other tools on this list.
- You don’t need any developers, tracking is cookieless, and the script is small, so it doesn’t increase your site loading time.
- Has a free plan.
- HockeyStack can be used without much experience, making it the perfect tool for self service analytics.
HockeyStack Cons
HockeyStack generally lacks reporting features as it’s not focused on agencies and other reporting-based businesses.
- The tool lacks some integrations, such as Zapier.
Holistics
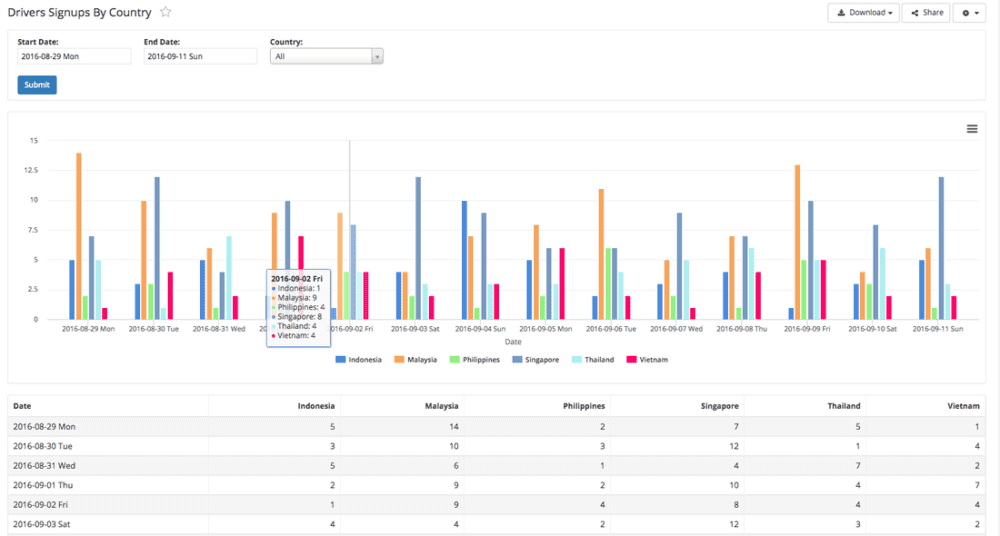
Holistics is a business intelligence platform. It has two different interfaces for different types of users: a SQL-friendly interface for data analysts and a non-technical interface for other business users. It features a drag-and-drop interface for pivoting data and creating dynamic dashboards.
Features
- Data Visualization and Reporting: You can visualize and have a high-level view of your data.
- Shareable Links: You can share direct reports to external partners.
- Data Modeling: You can pre-define metrics and calculations.
- Data Catalog: Data Catalog is bein for the purpose on centralizing the data definitons for the company.
- Interactive SQL Editor: You can run SQL queries for adhoc analysis.
- User Roles and Groups: With this feature Holistic allows its customers to classify their users and give permission for specific actions.
- Embedded Analytics: You can embed Holistics charts to your application and analyze your data with necessary metrics.
Integrations
- Google BigQuery.
- Amazon Redshift.
- MySQL.
- PostgreSQL.
- Amazon Athena.
- ClickHouse.
- Presto.
Pros of Holistics
- Holistic is a very applicable solution for growing small and medium-sized companies.
- The customers service team is responsive and work closely with users.
- It does not require a strong technical background. Non-technical users can use Holistics as a business intelligence platform(It is very simple drag and drop reporting)
- Holistics is easy to setup and you can really have your reports and dashboards ready within minutes, which is important for any and all BI tools.
- For developers, Holistics is very useful because it minimizes the amount of SQL they need to write.
Cons of Holistics
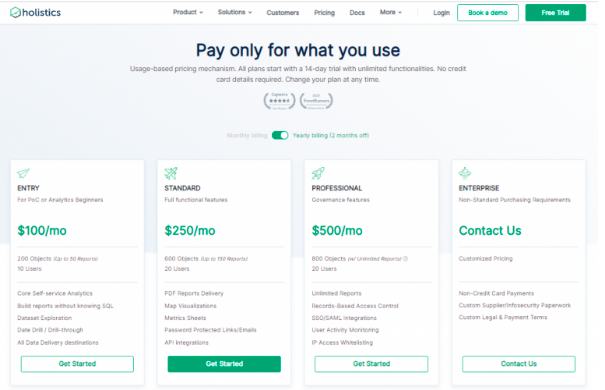
- Holistics is a paid service. Even if the prices are affordable users might go for Google Data Studio which is free.
- Since it is relatively a new tool it lacks some of the features that its competitors have. For example, it lacks Drill-Down feature that Power Bı has.
- Visualizations can not be customized, even if the standard ones meet requirements some users would want more flexibility.
- Since Holistics is a new platform it needs some further optimization. For example, when large dashboard with wider bar graph, few lines gets shrinked and this creates confusion. However, these problems are probably to be solved in the future.
- User interface is not as good as other tools and can be changed without any announcements leaving companies and users in confused state.
Pricing
Holistics offers its users a 14-day free trial with all features available. After the free trial there are four pricing options as follows:
Domo
Domo is a cloud-based platform. It is being used as a business intelligence tool that specializes in data visualization. Domo is used to have a direct and real-time access to business data with minimum IT involvement. Domo is trusted by many companies. Companies that put their trust in Domo includes some large companies like: Nestle, Cisco and ESPN.

Features
- Data Integration: Domo allows its users to integrate data from any source.
- BI and Analytics: Domo’s real time and predictive analysis helps its users.
- Intelligent Apps: With Domo’s intelligent apps you can create the apps in accordance with your company’s needs.
- Embedded Analytics: You can analyze your data with necessary metrics.
- Security and Governance: Data is important and while using Domo with your data, Domo wants you to know your data is secure.
Integrations
- SAP
- Snowflake
- Google Analytics
- Amazon Redshift
- Oracle
- Salesforce
- MySQL
Pros of Domo
- Domo is a user friendly tool it provides its users with numerous modules for them to learn the program. Also it comes with a user friendly interface and easy learning curve.
- It connects very well with other applications and facilitates data transfer.
- It enables its users to visualize data.
- Domo has many different dashboard formats which are essential in reporting.
- Domo has a mobile version too and it works without any problem. Reviews show that it is one of the best mobile versions of an business intelligence platform
Cons of Domo
- Domo is very costly.
- Processing of large datasets can take quite a long time.
- Some user reviews show that there has been some inaccuracy in the data displayed on sales dashboards. Since BI depends on data accuracy data consistency and accuracy is very important.
- Search and filtering capability of Domo is very limited which makes domo fall behind other BI tools.
- Linking different applications can be a difficult process, this is especially important if you are aiming to achieve full self service business intelligence to automate your data intergration process.
Pricing
Pricing of Domo is based on what you need from platform. These needs can be in the form of data storage, data refresh rates, volume of data queries, and the number of users. Therefore Domo offers packages specifically for the specific needs of different companies. For detailed pricing Sales team of Domo should be contacted.
Supermetrics
Supermetrics is founded in 2013. Companies use Supermetrics to get the exact marketing data. With the exact data, informed decisions can be made to increase growth and profitability. Over 17,000 customers trust Supermetrics with their marketing data.
Features
- Business Intelligence: Business intelligence uses software to transfor data into useful insight for businesses.
- Data Analytics
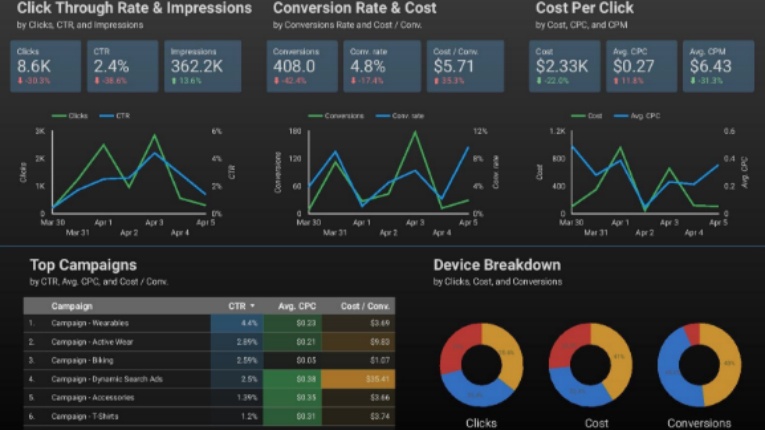
- Data Visualization & Presentation
- Search Engine Marketing (SEM): SEM is using paid strategies to increase your company’s search visibility.
- Report Scheduling and Automation: This feature is used to take information proactively to the right users at the right time automatically.
- Data Mining: Data mining is extracting and analyzing data sets in order tı find patterns in those data sets.
- Adwords
Integrations
- Google Ad Manager
- Quora Ads
- Semrush Analytics
- Snapchat Marketing
- Tiktok Ads
- Twitter Ads
- VKontakte Public Data
Pros of Supermetrics
- Supermetrics has around 60 connections which does not seem like a lot but the usability and accuracy of these connections are said to be very high.
- Supermetrics is very affordable and therefore it is very suitable for early-stage startups which focuses on digital components of marketing.
- Supermetrics is very accurate in reporting on selected marketing metrics.
- Unlike Google Data Studio Supermetrics can integrate both Microsoft and Google softwares.
- Supermetrics has a solution-oriented and responsive customer service.
Cons of Supermetrics
- Even if Supermetrics is affordable some competitors like Google Data Studio are free to use.
- Number of integrations are relatively low when compared with some competitors like Klipfolio
- Supermetrics does not have its own reporting interface; it transfers the data elsewhere.
- Supermetrics lacks some features such as: Keyword Rank Tracker, Site Auditor, Backlink Checker.
- The integration process is not very straightforward but once integrations are completed they work very well.
Pricing
Supermetrics has very wide range of different pricing options in order to see different pricing options you can check here.
Conclusion
In this article I presented the strengths and the weaknesses of Power BI by comparing it with its main competitors. Even if it is a very strong tool, it has its own weaknesses and these downsides should be considered when considered when deciding on the business intelligence platform.
If these tools do not meet your requirements you should check out HockeyStack.
Power BI is a Microsoft hosted cloud service. It is mainly used for viewing dashboards, reports and its own apps. It is a good tool because it has Microsoft’s security behind its applications.
Business developers who does not want to worry about coding and wants quick access to accurate information with understandably designed dashboards and charts might want to use Power BI.
Yes, Power BI is pretty hard-to-use and setup.


