Define, Track & Improve Your Product’ Activation in 2022
SaaS companies achieve growth after five crucial steps: Acquisition, Activation, Revenue, Retention, and Referral, also known as AARRR. Because of the phonetic resemblance, these five metrics are also called the pirate metrics (got to love SaaS puns.) Although each one of these steps is essential in its sense, focusing on a specific one can have more payback, which is the Activation step. Increasing Activation can directly increase your monthly recurring revenue as well as other important SaaS sales metrics.
Like any other aspect of your sales strategy, optimizing a step in your growth requires you to measure your current performance. Keep reading to learn more about Activation, how it’s measured, and its value.

What is Product Activation in SaaS?
There are different ways to define the term activation, but it’s not as simple as having a customer use the tool once or twice. To call a user “activated,” you need to ensure that they adopt your product by fully grasping its value. This realization happens after the “aha” moment, where customers see the real reasons behind continuously using your product.
But why aren’t all customers who have subscribed to your tool considered “activated?” Because just buying your tool isn’t enough of a reason to become an active user. While acquiring new users, you make specific promises and leads become customers with the expectation that you’ll provide the value you had promised. If new buyers don’t see the value they were expecting, they won’t become activated customers, meaning they won’t be regular and engaged users. They’ll use the tool a couple of times before churning.
How Do You Measure Product Activation?
1. Define a milestone
It’s impossible to analyze each and every one of your customers to see if they have achieved their “aha” moments. To measure Activation, you have to have a specific milestone that decides whether or not a customer has had their “aha” moment.
For most businesses, this milestone is about the customer using a particular feature for the first time. For instance, a platform like Spotify may define this milestone as the creation of a customer’s first playlist. This action usually indicates an “aha” moment to an engaged user. Some of the actions you may choose as a milestone are:
- Using additional features other than the most basic ones,
- Spending a certain amount of time on your tool,
- Signing up for your email newsletter or your free trial.
2. Track the number of customers who complete said milestone
Once you’ve defined the “aha” moment for your customers, you have to determine the number of users who had their moment. To do this, you’ll need to use a good product analytics tool.
Pro Tip:
HockeyStack let’s you analyze user journeys so that you can track the customers that have completed your milestone 🙂
3. Calculate the activation rate
[# of users who complete the milestone / Total # of users who signed up] × 100 = Activation rate
After you’ve plugged in the numbers to the equation above, you’ll have a percentage result. This is the activation rate, and it shows you the percentage of users who have engaged with your product after the onboarding stage.
Why Is The Product Activation Rate Important?
Signals to Areas of Improvement
Say you’re not getting the numbers you want in terms of your business’s growth. One of the first things you should analyze is your activation rate because it can tell you about several underlying problems. A low activation rate means that leads after they’ve signed up for your product and paid for it (if they’re not on a free trial,) went through your onboarding process and still decided not to engage with your product. This lack of engagement could happen because of a few reasons:
- Your onboarding process isn’t good enough.
There are certain things you have to ensure while onboarding a customer. For instance, you have to make sure that they know all about your most important features and know how to use them. Or, you have to make sure that there is enough documentation available so that they can go back to learn more whenever you want.
If one of these aspects is missing from your onboarding process, then customers will be less likely to discover the value of your product. If they don’t learn about your feature during onboarding, then they won’t live through the “aha” moment that would have been caused by that feature either.
- You’re targeting and pulling low-quality leads.
SaaS businesses tend to think that attracting new leads is a good thing in any case. While it’s true that acquiring new leads can be a good thing, it’s also important to remember that leads are valuable because they are prospective customers. So, if you’re consistently pulling leads that do not fit into your ideal customer profile, and if those leads are not going to become customers because of that, then there’s no meaning in pulling new people.
A low activation rate may mean that your leads weren’t actually looking for a product like yours. It may mean that they gave up on your product after realizing it wasn’t meant for them. If this is the case, you should work on your content marketing strategy and see if it addresses the right customer profile.
Activation Affects Revenue and Growth
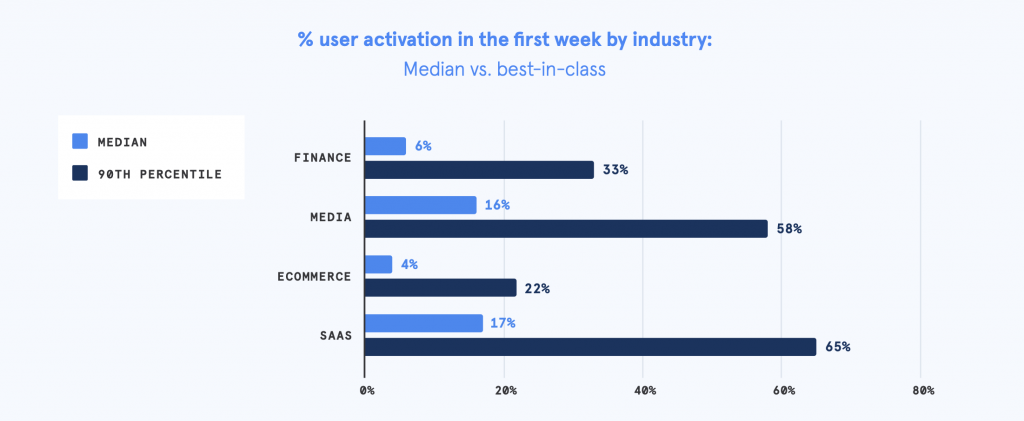
If you’re offering a freemium version or free trial, you’re increasing the chances of users reaching their “aha” moment. As can be seen in the graph below, the median activation rate for SaaS is around 20%, while the median activation rate for businesses that offer free trials is 40%. But how is increasing your activation rate profitable?
If you have an activation rate of 20%, 100 people sign up for your free trial, and 20 actually end up paying for your product. So what does this mean for your MRR? If you’re charging $100/month, then the MRR generated from those 20 users is equal to $2000. If you increase your activation rate by just 10%, you generate revenue from 30 users, meaning that your new MRR is $3000–a 50% increase in MRR with just a 10% increase in your activation rate.
How Do You Improve Product Activation?
1. Have a Product Demo
A demo can ensure that prospective customers understand your tool before even purchasing it. This strategy will result in purchases from people who already know they need your product, so it will increase the chances of you finding qualified leads that fit into your ideal customer profile. As I’ve said above, these leads are much more inclined towards being active users.
2. Use Welcome Emails
Personalized welcome emails can increase the motivation of your customers. They can also be used as spaces that explain the small perks of using your product. If a user doesn’t understand a feature or stats having problems with your tool, these emails also open the channel of communication. When users feel like reaching a brand is easy, they’re less likely to give up on that brand before communicating their problems.
These welcome emails can also be called getting started emails. If you choose to send this type of welcome email, you can have a full guide in your email, but make sure that it’s to the point and not boring.
3. Use In-app Messaging
When you greet users with a personalized message the first time they open your tool, you’re again increasing their motivation to keep interacting with the tool. You can also use in-app messaging to show the features that are harder to understand and discover to decrease the time-to-activation.

Other Important Product Metrics To Track
Measuring Activation is important, but just like any other important SaaS metric, this metric has to be supported by data from other product metrics to have a comprehensive idea about the areas of improvement. These metrics are:
Average LTV Of A Customer
- What is LTV?
LTV is short for Lifetime Value: it measures the contribution of a customer to your business’s revenue. For SaaS, the LTV is based on three different variables: the Average Revenue Per User (ARPU,) Customer Lifetime, and Churn Rate. This metric is usually used together with the Customer Acquisition Cost (CAC.) When combined, these two metrics give businesses an idea about the profitableness of their customers. A growing SaaS company with a stable revenue should have an LTV higher than its CAC.
- How do you calculate LTV?
The Customer Lifetime is equal to the inverse of your Churn Rate, and you can calculate your ARPU by dividing your total revenue by the total number of customers. Once you have all the numbers, the calculation is simple:
ARPU x Customer Lifetime = LTV
Pro Tip:
There’s no need to perform the LTV calculation by hand, HockeyStack can do it for you with no code 🙂
- Why is LTV important?
LTV is related to three of the pirate metrics: acquisition, Activation, and revenue.
LTV is related to acquisition because it tells you about your acquired customers’ spending. If you direct your marketing efforts to the wrong customer profile, the leads you acquire will not become customers with high LTVs.
In terms of Activation, a high LTV means your customers have experienced the “aha” moment and looked for ways to make more use of your products. They may have done this by upgrading to a paid plan, or by paying for additional features.
Lastly, when it comes to its connection to your revenue, customers with high LTVs, by definition, spend more. If you don’t spend all your money on acquiring these customers, you’re increasing your revenue.
Feature/Product Engagement
- How do you measure feature/product engagement?
First of all, you need to define the events that indicate an engagement with your product/feature. Going back to the Spotify example, a music streaming platform may define product engagement as creating a playlist, and then analyze user journeys to see whether customers have engaged with the product or with the playlist feature.
This sounds almost entirely the same as measuring product adoption. The difference here is that you can use feature/product engagement as a micrometric, meaning that you can look at the engagement of individual users. The activation rate gives a macro number and an overall judgment. Having said that, it’s easy to understand that this metric is closely tied to Activation: activated users are more engaged with your feature/products.
Churn Rate
- What is the Churn Rate?
Also known as the opposite of the retention rate, the churn rate is one of the most popular metrics used in the SaaS industry. The churn rate measures the number of customers that stop buying from your business over a specific period of time. Generally, businesses measure monthly churn, though some also use yearly churn. For SaaS, a good churn rate is said to be anything less than 3%.
Although the logic behind each one is the same, there are different types of churn that you can analyze:
- Subscription level: Customers may not stop doing business with you entirely, but they may stop buying the specific plan that they were at. Generally, this type of churn relates to upgrades and downgrades.
- Customer level: The customer level churn doesn’t take into account the subscription plan. It only measures the number of cancellations in a given time. When you say churn, the customer level is the first type of churn that comes to mind.
- Recurring revenue: Your ARR or MRR are directly related to your churn rate (as churn increases, your monthly/anual revenue, naturally, decreases.)
- Why is measuring Churn important?
As an industry based on subscriptions, the SaaS sector is heavily involved with the concept of churn. This rate is related to two of the pirate metrics: retention and revenue. The relationship between churn and retention is straightforward (the customers who cancel their subscriptions decrease your retention rate.) In terms of revenue, a high churn rate means that the number of customers that are paying for your services is decreasing. Thus, it’s important to track churn in order to optimize the two pirate metrics.
- How do you measure churn?
Calculating your churn rate is very easy with the formula below:
[ (# of customers that canceled in the time period) / (total number of customers) ] x 100 = Churn Rate
Active Users
- What are Active Users?
Labeling a user as “active” is quite hard, considering that there are many factors that may make a user active or inactive. Thus, before measuring the number of your active users, you’ll need to define the terms “active” and “user.”
SaaS companies usually define a unique user as someone who logs on to the platform: if that user logs on a couple of times, they still count as one user. When it comes to defining the term “active,” you’ll see that there is no one correct definition. Similar to defining a milestone for the Activation Rate, you may have different descriptions of active and inactive users, depending on your tool’s features and capabilities,. For social media platforms, active users are the ones who like and share posts, and for design tools, they may be the people who create or work on a visual.
- Why is measuring the number of your Active Users important?
Depending on your tool, you may need to measure daily active users (DAU) or monthly active users (MAU.) Both of these metrics relate to Activation and retention: a high DAU/MAU means that your users are engaging with your product. It also means that your tool is “sticky,” meaning that it became an everyday necessity for users. A high DAU/MAU also means that you’re likely to retain customers since your tool is now a part of their business routines.

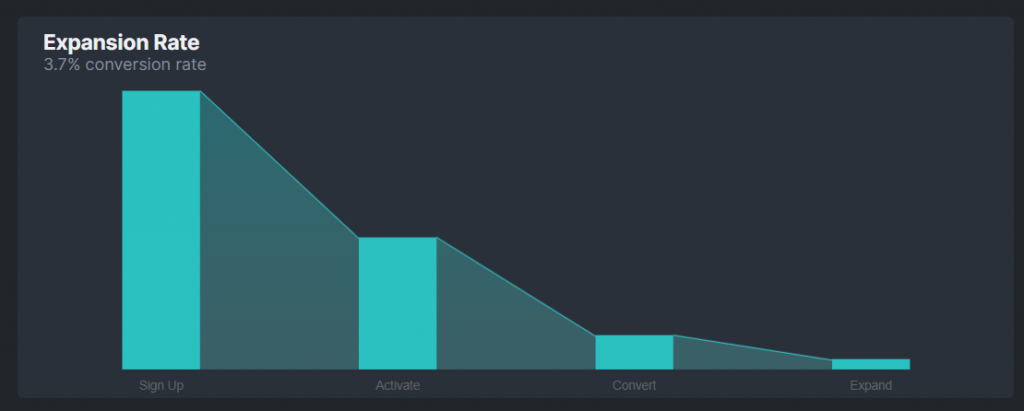
Track Sign Up To Expansion Journey With HockeyStack
HockeyStack is a SaaS analytics tool that helps you uncover what affects your revenue growth. You can connect product metrics with marketing, revenue, and sales to understand which features lead to expansion revenue, which sales sequences bring the most engaged users, and more.
Here is an expansion funnel report:
An engagement by plan report:

Or an engagement by job title report:

On top of custom dashboards, HockeyStack has other features too, such as
- Surveys
- Step-by-step user journey
- Funnels & goals
- Revenue Attribution
and more.
HockeyStack Pricing
HockeyStack has a free forever plan and 3 paid plans. Paid plans have a 14-day trial with a 30-day refund guarantee.
You can check out the pricing page here.

Conclusion
The pirate metrics (AARRR) were designed to provide emerging businesses with a framework for the most important metrics. These metrics, acquisition, activation, retention, revenue, and referral, directly impact businesses’ health and growth. They are also directly connected to product management and optimization.
Activation is one of the most important pirate metrics as it determines the success of the metrics that follow it. You’re more likely to retain active users since they’re engaged with your product if you have active users. If you have active users, you’ll have more recurring revenue since customers know the value of your product and are less likely to churn. Lastly, active users are more likely to refer your brand to their friends or colleagues since they know why your product is useful.
Thus, using the activation rate is important for you to understand the rest of the pirate metrics, and to assess the success of your product management strategies.
FAQ
Pirate metrics are the five metrics that measure a SaaS business’s health. They are the acquisition, Activation, retention, revenue, and referral rates, in short, AARRR.
The rule of 40 states that a SaaS company’s combined growth rate and profit margin should exceed the 40% benchmark.


