An Introduction to SaaS Marketing Analytics
Marketing analytics is all about employing various techniques to extract insights from data. For SaaS, this process of analysis is even more important. By analyzing marketing data, SaaS companies can not only make decisions based on evidence but also learn from past experiences to mitigate the risk of costly errors.
In this article, I’m talking all about SaaS marketing analytics, how it’s useful, and best practices you can leverage.
What Is Marketing Analytics?
Marketing analytics refers to the processes and technologies involved in analyzing data gathered from a business’s marketing efforts. There are various platforms that your business can use for marketing, ranging from social media to PPC ads. Marketing analytics is all about collecting marketing data from all of these different platforms and making use of important metrics such as ROI and Social Engagement, optimizing your strategies for best results.
Analytics is a way to help businesses better understand the “bigger picture.” It enables them to increase their business’s growth and to make future predictions based on data trends. It also lets companies create personalized campaigns that generate more demand.
Why is Marketing Analytics Important?
75% of marketers use marketing analytics to better understand the performances of the strategies they have employed. Marketing analytics is crucial for any business, especially for SaaS businesses that rely on countless different platforms to get the message across. They have to make sure that each of these campaigns reaches the right people and that they are all worth the money they spent on them.
Not only that, but businesses have to ensure that their prices, products, and other services are also received well on the internet and that their brand is recognizable.
Unfortunately, as important as marketing analytics may be, it’s almost impossible to analyze every marketing step manually. You can’t improve and adapt your landing pages or your PPC ads by simply watching your revenue increase or decrease. Without a tool designed for the task, you certainly cannot calculate and follow all the KPIs as a marketing manager. Even if you do, you cannot compete with the 75% that’s using powerful analytics tools and strategies to drive better decision-making processes.
Companies using marketing analytics reach the ideal customer profile much more quickly, optimize their marketing efforts more efficiently, and spend less time and money on tracking performance. In short, using marketing analytics in the increasingly competitive and complex SaaS space is vital.
Step-by-Step Process for a Marketing Analytics Strategy
By now, you’re probably starting to give marketing analytics some more thought.
“But how can I get started,” you ask?
Here’s a step-by-step process for a SaaS marketing analytics strategy for your business:
1. Define your goals
Numbers don’t have any intrinsic value. You could have a ton of marketing data from your campaigns or survey results, but they won’t be useful if you don’t know what you’re trying to answer or what this answer needs to be. That’s why it’s important to have a clear question in mind while analyzing your SaaS marketing strategy.
What are you trying to improve?
What do you want to see?
Maybe you want to increase the number of signups for your newsletter, you’re hoping for more people to land on a specific page, or you need more prospects to check out a live demo of your product.
Once you have your goal in mind, you can use your marketing data to find answers and optimize your processes.
2. Determine the metrics you’ll use
Different goals require different marketing metrics.
Let’s say that you want to improve the engagement of your emails. First, you’d have to know the current engagement by looking at the email open rate from an email marketing funnel (see the SaaS Marketing Dashboard example below for an example.) You’d also need to know the number of users that converted from your emails. Then, you would need to make the necessary changes to your emails and re-measure said metrics to compare results.
If your goal had been different, say, to create accurate customer profiles, you would need to use different marketing metrics such as CAC and LTV of different demographics. Or, if you needed to improve your SEO, you’d need an SEO reporting dashboard to show your bounce rate and search engine rankings. Thus, choosing the right marketing KPIs and metrics is important based on your requirements.
3. Collect Data
You may not have prerecorded marketing data at hand if you’re new to analytics. A trustable analytics tool like HockeyStack can start collecting data instantly without you needing to code anything. It’s also important to decide who gets access to your marketing data within your business, how it’s stored, and how often it’s recorded as governance and compliance-related issues can get you and your business in trouble.
4. Take Action
You should utilize the comparisons you made or the conclusions you drew when creating your next marketing campaign. However, you don’t necessarily have to wait for the next campaign to use analytics: you may use it to improve your market research or to get a better understanding of your consumer’s behavior.
How To Use Marketing Analytics For Your Business
Contrary to popular belief, marketing analytics’ sole purpose isn’t to improve campaign performance. Instead, there is a long list of the objectives of marketing analytics, all of which make analytics crucial for the different stages of your business cycle.
For your SaaS business, you can use marketing analytics for:
Performing Accurate Market Research
If you want your product to succeed, you need to ensure it aligns with the market. To do so, you need to understand the source of demand for your product and the customer segment to which your product is appealing. To identify this segment, you have to analyze the traffic to your sites and campaigns, as the people that cause this traffic are the people that create demand.
By using Marketing Analytics, businesses can track the audiences of their landing pages, social media, websites, and more. They can track the traffic’s demographic details and draw out a comprehensive profile.
Better Understanding Consumer Behaviour
With so many competitors and options available on the market, catching a prospective customer’s attention is more complicated than ever before. The only way to catch someone’s attention is to make your campaigns relatable. If your marketing is directed at the right profile, it will have a better shot at getting a prospect to show interest in your product and start a conversation with you.
Marketing analytics enables you to understand your leads’ behavior and customer journey better. For instance, analytics tells you about the pages a user specifically clicked on. If they clicked on the churn optimization page, you can understand that the solution they want should reduce churn. You need this knowledge to shape your marketing strategies and personalize them. This personalization is important because customers are getting more selective about the content they consume each day, and you don’t want your content marketing efforts to be ignored.
Increasing Traffic Relevance
When you create ad campaigns on platforms like LinkedIn (or even on social media platforms like TikTok) you have to choose an audience. This audience can be described by geographic region, the hashtags or brands they follow, their age, etc. But how do you know if the audience you’ve chosen is responding to your ads positively?
There are a few stages you should look at: the stage when customers interact with the ad, when they interact with your landing page and when they act on CTAs. The first can be measured with click-through rates, the second with bounce rates, and the third by conversion rates.
Marketing metrics and analytics, with these metrics, can show you whether the traffic you’ve attracted to your site is relevant or not. If you’ve put out your ads to people who are not in your ideal customer profile, the metrics will show weak results. This helps you attract quality traffic to your site via PPC ads and generate quality leads.

Optimizing Marketing Campaigns
As I’ve stated before, you need to have clear goals and a holistic view while doing marketing analytics; otherwise, you’ll have plain numbers that don’t mean anything by themselves.
Also, optimizing campaigns requires comparisons and human judgment. While marketing metrics such as the Number of Free Trial Sign-Ups can tell you about the success of your most recent marketing campaign, they can’t tell you why you have those numbers. For that, you’ll need some context.
Improving Landing Pages
At the end of the day, most of your marketing efforts have one goal, which is to convert people into customers. To do this, most ads and campaigns lead users to landing pages, which involve CTAs, sign-up boxes and other forms. However, creating an effective landing page is hard as people easily click off. To prevent this from happening, marketers need to optimize landing pages based on the devices they’re accessed from, the length of the survey, and the visibility of CTAs.
Marketing analytics helps you see if your landing pages are successful in converting users. If you’re testing two landing pages and comparing their effectivity via A/B testing, or if you’re simply tracking metrics, you’re performing marketing analytics to increase conversions.
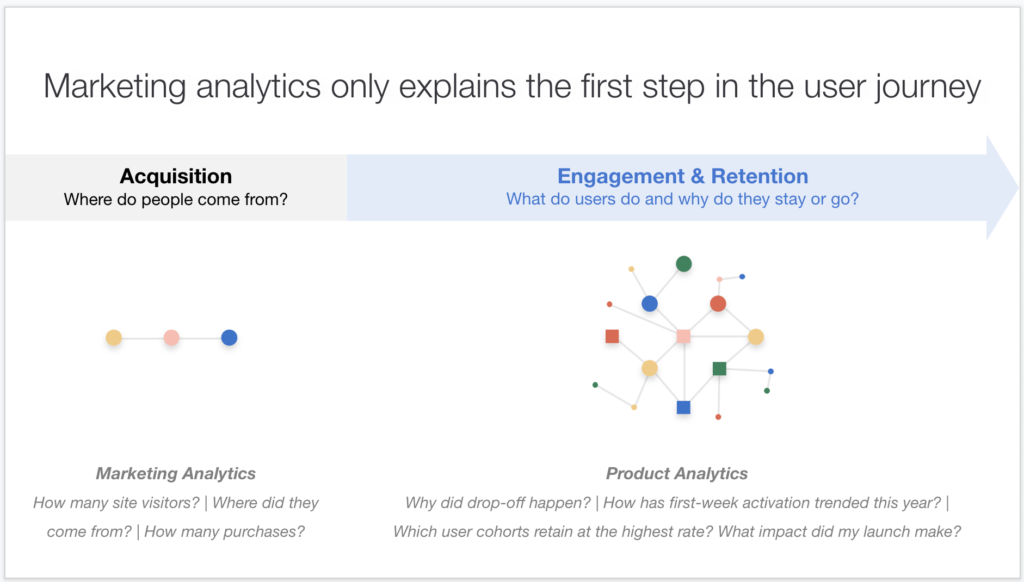
Marketing Analytics vs Product Analytics
One of the biggest mistakes SaaS businesses make is to think that marketing analytics and product analytics are the same thing. This kind of thinking leads companies into using the wrong tool for the wrong purposes.
To put things in perspective, if you try using Google Analytics to improve product adoption, it simply won’t work.
Let’s take a closer look at how marketing analytics and product analytics are different from each other.
What is Product Analytics?
Product analytics combines processes that analyze and optimize products, customers’ experiences with said products, and product engagement. With product analytics, businesses can understand how users interact with their tools and services. For instance, they can see the demographics of highly active users and those that are churning. Furthermore, they can detect any customer experience problems, such as complex UIs and features.
Even though there’s a lot to it, shouldn’t disregard product analytics because it’s extremely important. Product analytics is vital for businesses, especially while updating and re-designing their products, as they have to know what works and what doesn’t. To make meaningful changes, you have to use direct (surveys, reviews, etc.) or indirect feedback (churn, retention, feature engagement, etc.) from users.
What is the Marketing Analytics and Product Analytics Used For?
Businesses primarily use marketing analytics to better understand and optimize their marketing efforts.
On the other hand, product analytics improves customers’ engagement with the products themselves and not the campaigns for the products. Simply put, product analytics deals with the experiences that customers have with your tool, and isn’t quite a measure of how well your marketing strategy was executed.
Here’s what product analytics can generally look like:
- Performing A/B testing to improve products’ features, interface, usability, etc.
- Optimizing pricing plans and offers for products to increase sales,
- Analyzing in-app user behaviour and using marketing data to improve retention.
Importance of Marketing Analytics vs Product Analytics
As I’ve mentioned above, you need marketing analytics to create impactful and targeted campaigns. These campaigns will bring you qualified leads who will become customers with high LTVs.
You’ll realize product analytics’ importance later when you’ve acquired interested leads or customers. As they start using your free trial or go through your onboarding process, you’ll want to optimize their experience so that they’re convinced to continue using your product.
While both types of analytics analyze user behavior or demographics, they use this information for different purposes. Marketing Analytics uses it to create awareness and interest to pull prospects to the top of the SaaS sales funnel. Product Analytics uses it to ensure consideration, purchase, loyalty, and advocacy, all in the later stages of the sales funnel.
Tools for Marketing Analytics vs Product Analytics
The most popular marketing analytics tool is Google Analytics, as its basic version is free and easy to use. However, some essential features, such as tracking individual user journeys, aren’t available, so you may want to consider its alternatives. Popular product analytics tools include Mixpanel and Amplitude, which offer features like Behavioral Segmentation, Surveys, and A/B Testing.
With marketing reporting tools like HockeyStack, however, you can integrate your Marketing, Product, and Revenue data to uncover insights that wouldn’t be possible with a standalone marketing analytics tool.
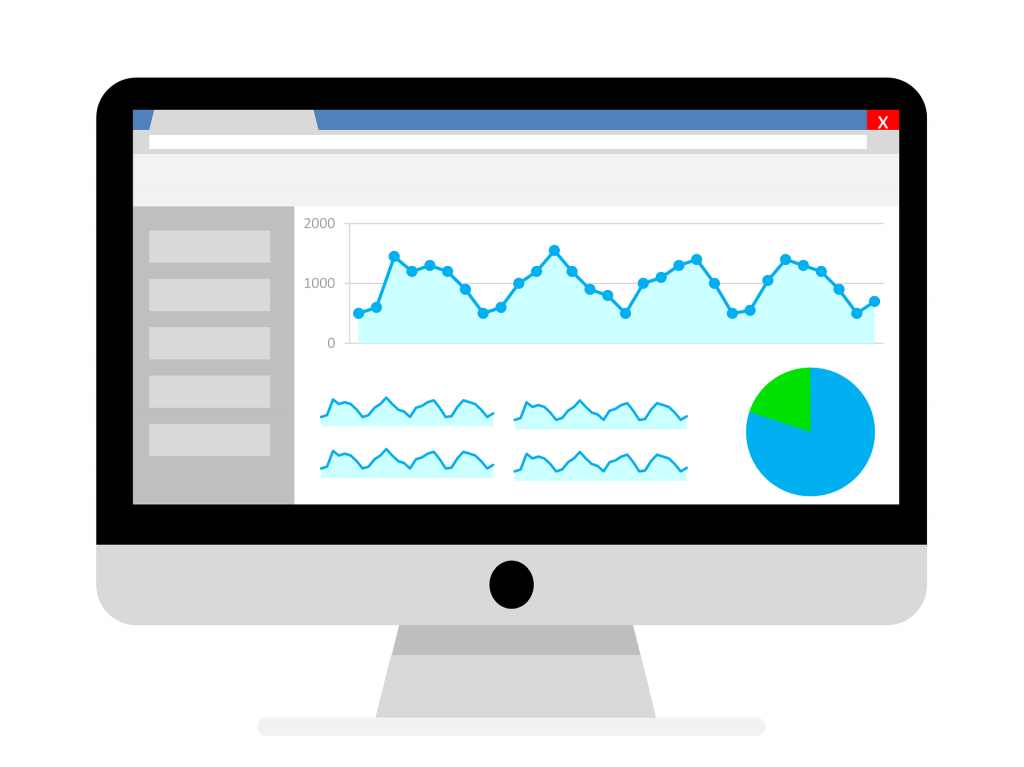
SaaS Marketing Analytics Dashboards
What makes a helpful analytics dashboard? There are a few things a SaaS Marketing Analytics dashboard should do:
- Include important KPIs: Providing an abundance of information may overwhelm users as it’s harder to look at the bigger picture with too much detail. So, ensure that your dashboard only has as much information as is necessary.
- Be customizable and flexible: Users should be able to choose the metrics they would like to analyze. If necessary, they should be able to combine different marketing reports in a single dashboard.
- Be easy to use and understand. A good user interface is crucial, and supporting graphs and visuals are always beneficial.
Content Marketing Analytics Report

HockeyStack’s Content Marketing Dashboard tells you about the revenue and leads that each one of your blog posts brings. The ready-to-use template shows three metrics: sign-ups, expansions, and MRR. However, it’s possible to change the metrics as you’d like. A good content marketing strategy requires tracking the posts that result in the best payback; marketing reporting tools like HockeyStack, Google Analytics and similar alternative tools help you do that.
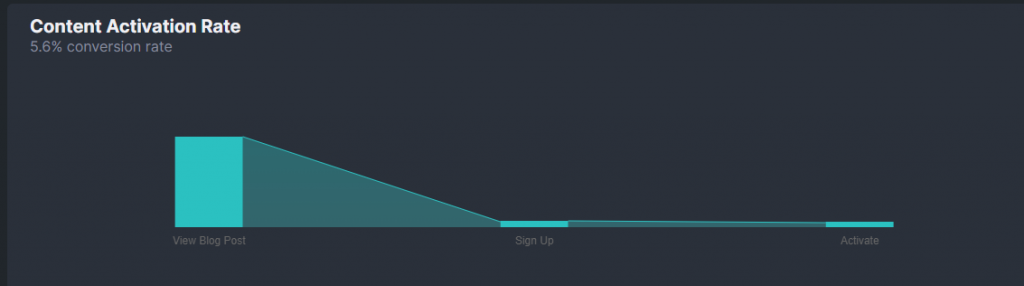
The Dashboard can also tell you about the effects of your content on your SaaS marketing funnel. For instance, the image shows that 92.8% of users who viewed said post moved on without completing their journey in the funnel. With this information, marketers can optimize blog posts, by doing things like adding more convincing CTAs. It’s also possible to look at the numbers for Sign Up and Activate in the same way.

This part of the Dashboard lets you analyze the quality of the leads that the specific post brought. It enables you to see the rate of readers who went on to book a demo, those who activated, converted, and expanded. By looking at these numbers for several posts and comparing them, you can see the reader segments that result in the most upsells and focus more on marketing to them.

The last part of the Dashboard (at least this template, your customized template could include more or fewer reports as you’d like) shows you the number of internal link clicks your posts got and how that affected the number of sign-ups. With this information, you can adjust your internal links and better understand the information leads are looking for within your content.
Marketing Dashboard

The Feature Usage by Channel report enables users to analyze feature engagement based on different traffic sources. If there are significant differences, this could be due to the marketing strategy used on that source (maybe the campaign on Google emphasized one of the features more than that on Capterra.) Or, it could give you an idea about different audiences’ different needs. Both types of information are helpful while customizing your campaigns.

By comparing the different traffic sources, companies can deduce which source has more ROI. For instance, if you’re putting the most significant time and effort into your g2 content but getting the least MRR out of it, this is a sign that you’re either unable to find the right leads or that it’s time to direct that energy elsewhere.

This is just one of the funnels you could create using HockeyStack. While creating engaging marketing emails, there are many vital points to keep in mind, such as concision, clear CTAs, good subject lines, etc. The Email Marketing Funnel lets you see whether or not your CTAs worked by looking at the rate of people who clicked on the link. With this data, companies can easily optimize their email marketing strategies.
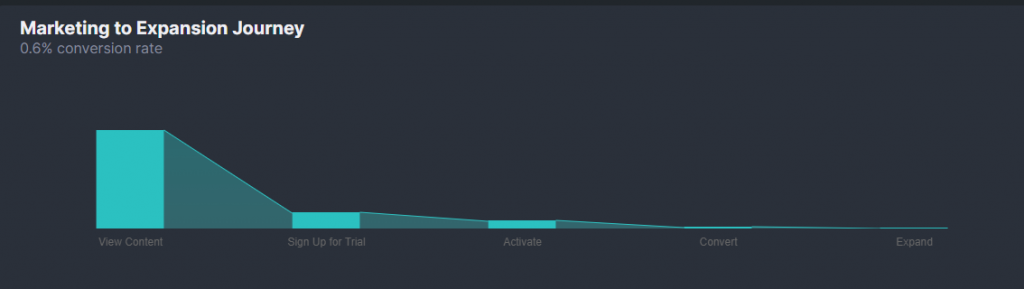
User Journeys are an essential part of Marketing Analytics as they let you see which type of marketing content drives sales. If the users that expand come from a single content subject, you should ask yourself why and use that reasoning for your advantage in the future.
Top Marketing Data Insights & Metrics
So you have a new goal for your marketing strategy. Maybe it’s about understanding your customer segments and creating more customized ads, or perhaps it’s about improving the engagement of your landing pages. Then, you’ve selected a good Marketing Analytics tool that has helpful dashboards like the ones above. But you don’t know where to start because there are so many metrics you could track for your goal. The metrics below are the most versatile for Marketing Analytics, and they could act as starting points for your marketing reports.
Conversion Rate
- What is the Conversion Rate?
A “converted” customer for SaaS is usually a visitor who ends up making a purchase. However, you could define conversion differently. For instance, you could call visitors who ended up signing up for your free trial as converted. This versatility of the conversion rate makes it a popular KPI in product marketing, content marketing, and SEO reporting. In the end, the conversion rate looks at how the number of converted visitors compare to the number of total visitors with the following calculation:
(# of conversions / # of total visitors) x 100 = Conversion Rate
In 2020, the median conversion rate for SaaS was 3%. This means that, in general, only 3 out of 100 visitors ended up making purchases for SaaS companies. It’s really hard to convince a reader to buy your product after their visits, so the drop-off rates are quite high. Any rate greater than 3% would mean that you’re doing better than most companies.
- Why is measuring the Conversion Rate important?
Conversion is the ultimate goal of any marketing strategy. Although you could say that your goal is to create brand awareness or to establish a good reputation by producing content, all of these purposes would connect back to selling to a group of leads. If your ads, your emails, or your how-to guides aren’t leading readers towards a purchase, then you should consider doing things differently.
ROAS
- What is ROAS?
ROAS is short for Return on Ad Spend. This metric is used to measure the payback of the money you had invested in your paid advertisements. It’s determined with the calculation below:
(Total Income from Ad / Total Spent on Ad) x 100 = ROAS
For example, if you had paid $100 on an ad that resulted in $400 worth of sales, your ROAS would be 400%. This means that for every dollar you spent on that ad, you got back $4. While there’s no benchmark number for ROAS, it should always be above 100%.
- What is the difference between ROAS and ROI?
ROI also measures the profitableness of your campaigns, so what’s the main difference? While ROI measures profit, ROAS measures revenue, and ad effectiveness, it’s a slight difference. This is because ROI considers all expenses, including the ad spend, and the people, tools, and other expenses that went into the software and ad as a whole. ROAS, on the other hand, only measures the amount spent on the ad and the amount of revenue generated from the ad.
- Why is measuring ROAS important?
Giving out ads is generally expensive, and you probably want to make sure that you’re getting your money’s worth. ROAS is especially important when taking a microscopic look at your individual ads. While ROI can give you a good idea about your financial standing, it doesn’t necessarily tell you about the success of a single ad because the amount you spend on your marketing team or your product does not directly influence the ad. So, the number you get could be low because of any significant investments you have made.
Signups/MRR by Channel & Campaign
- What is MRR?
Sign-ups are straightforward, but you may be unfamiliar with the acronym MRR. MRR is short for Monthly Recurring Revenue (it’s also possible to see ARR, the Annual Recurring Revenue.) MRR is one of the most important marketing and sales metrics for the SaaS industry. The MRR is calculated via the formula below:
# of Monthly Subscribers x Average Revenue Per User = MRR
- Why is measuring Signups/MRR by channel and campaign important?
Each one of your SEO efforts and campaigns results in a certain amount of sign-ups or sales (hopefully.) However, based on their types, where they were published, who they were directed to, and their efficiency, these campaigns attract different customers. Some pull customers that generate a lot of revenue, and some don’t. The important thing is to see which types of channels and campaigns pull the most valuable leads and to use this information in the future.
Conclusion
The truth is, you don’t need a marketing specialist to get you started with Marketing and Customer Analytics. Analytics is all about using the right tools and knowing what to do with your yearly or monthly marketing reports. As long as you have defined your objectives and used the right metrics to track your goals, you’ll be on the right track for improvement.
A great product can only be known as great through marketing. A combination of Marketing and Product Analytics can give your brand the boost it needs in terms of popularity and customer satisfaction.
FAQ
Not if you’re using the right tools. While keeping track of each marketing metric and goal seems hard, a good analytics tool like HockeyStack makes this process easy and leaves time to act on your marketing reports.
Marketing Analytics optimizes the marketing strategies of businesses. It uses marketing data and important metrics so that you can create more efficient and targeted campaigns.
Marketing Analytics saves managers time by taking care of the data storage, calculation, and reporting stages. Managers only have to interpret the marketing reports based on context and make the necessary changes.


