21 SaaS Marketing Metrics You Must Track in 2022
There are tons of marketing metrics available to SaaS companies, each addressing a different goal of your marketing strategy. Sometimes it can be hard to decide on the right key metrics, and sometimes you don’t have the resources to look at everything at once.
So, here is a guide to SaaS marketing with a list of the top 21 metrics that will help you figure out the metrics that you should use to track your marketing efforts. If you want to generate more qualified leads, decrease your customer churn rate, and achieve business growth, keep reading.
What are SaaS Marketing Metrics?
SaaS marketing metrics are values that marketers measure to assess their strategies and campaigns’ performances. A metric can be used to compare your SaaS business’ past performance to its current performance, track your productivity based on industry benchmarks, and compare your effectiveness to your competitors.
For instance, you can track your monthly recurring revenue to see whether your customer marketing campaigns retained more customers, therefore increasing your recurring revenue.
Or, you could see if your monthly recurring revenue is above the industry benchmark, which is said to be between 15 to 20%.
Lastly, you could compare your MRR to that of your competitor, and if you’re behind, see what marketing techniques they use to attract more customers.
All of these analyses and comparisons help you determine whether your marketing efforts are fruitful or not, and so let you optimize your campaigns.
This shows that SaaS metrics have multiple uses that can improve your marketing efforts’ ROI. Now that you’re aware of what they are and why they’re important, let’s check out a list of the top SaaS marketing metrics

1. Marketing Qualified Leads
Lead generation determines a business’s ability to make a profit in the future, therefore it is a significant sign of your marketing team‘s success.
Most marketers closely track lead generation because it highlights the transition moment when a customer decides to make a purchase and stops being a prospect.
This purchase is what generates revenue which is the most crucial step in marketing.
Leads can be qualified into several categories as they move further down the marketing funnel based on their expected outcome.
The first one is marketing qualified leads (MQLs) which refer to prospects that show signs of potential to make a purchase. It can be understood through the interested behavior of the (potential) customer, such as content downloads or frequent website visits. These are usually the customer who is at the top of the marketing funnel.
In fact, a recent trend that we are seeing shows that around 80% of revenue comes from 20% of the leads. It’s very important that you keep track of your customers’ journey, understand which campaign brought them, and what led them to convert.
2. Sales Accepted Leads
Sales accepted leads (SALs) are closer to purchasing MQLs. In other words, they are further down the marketing funnel. They have been accepted by your sales team, who will analyze their demands, profile and budget. However, sales accepted leads shouldn’t be confused with sales qualified leads: there’s an important distinction between the two. Sales qualified leads have already been investigated by your sales team after being accepted.
Marketers can understand these types of leads, again, by the customer’s very specific behavior.
Tracking these two types of qualified leads (SALs and MQLs) is very important because most of the time the best campaigns don’t have a super-high level of leads but high levels of qualified leads.
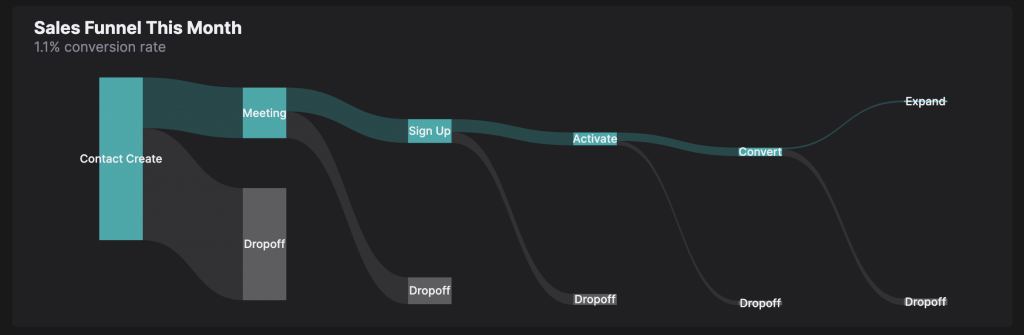
There are several stages in your marketing and sales funnel. Reducing the dropoff rate of each stage requires careful tracking of various metrics. Tracking and optimization are much simpler when you have funnels, like the HockeyStack sales funnel above, to help you. You can directly see the metric associated with each action by hovering your mouse onto it, and the relative proportions of dropoffs at each stage can be seen in the visual. You don’t have to track each metric and connect the dots manually.
3. Feed Subscriber Growth Rate
A feed subscriber (or just a subscriber) is someone who has shown interest in your content and has come back multiple times for more —and still keeps coming.
Marketers measure the percentage growth of their subscribers over certain periods of time and procure feedback about content or campaign quality.
This metric has become more and more important over the years with the increase of businesses creating website blogs or YouTube channels. So, if you have one, it could be really beneficial to measure your subscriber growth rate.
4. Brand Awareness
It is important to keep your eyes open to who says what about your business. You need to be aware of how, when, where, and how often you appear on which forms of media. You need to know every time your name is mentioned so that you understand how you appear to an average customer in his initial research stage.
This can be a hard thing to track with today’s complicated online world. You can use the help of Google Alerts to keep a track of your web mentions and referrals.
SaaS companies should also track social media mentions and posts containing their brand name. Some software services can be helpful simplifying the process for you.
Another source to be tracked is SEO. For example, it could be what type of search brings customers to your brand, or which backlinks are driving content to your website.
Lastly, your content marketing strategies have a big impact on brand awareness. The articles you write and the posts you publish, if successful, can increase brand awareness significantly. If a user finds himself reading your posts whenever he’s lost, then they’re more likely to become a new customer because they know about and trust your brand.
5. Return on Marketing Investment (RoMI)
Return on Marketing Investment (RoMI) measures the revenue obtained from a certain marketing campaign compared to the cost of the campaign.
This metric ultimately helps businesses get feedback on their campaigns and understand which tactics, channels, or strategies work the best.
RoMI seems very straightforward: less money spend + more money gained = good marketing campaign. Well, it isn’t that simple. Calculating the ROI of a campaign can be really difficult —especially when there are multiple marketing campaigns and strategies on action simultaneously.
Nevertheless RoMI is still an extremely important metric because it guides businesses while doing budget arrangements and helps them allocate their money in the most beneficial way.
6. Customer Lifetime Value (CLV)
Customer lifetime value (CLV) is the total revenue that can be expected from a single customer during the lifespan of their relationship with your business.
Calculating the customer lifetime helps determine which users are the most valuable and worthy of extra attention. Also, when you direct your customer marketing efforts to those with low customer lifetime values, you may increase the average customer lifetime and the value of your low-spending customers. This can even lead to an increase in your average revenue per user (ARPU).
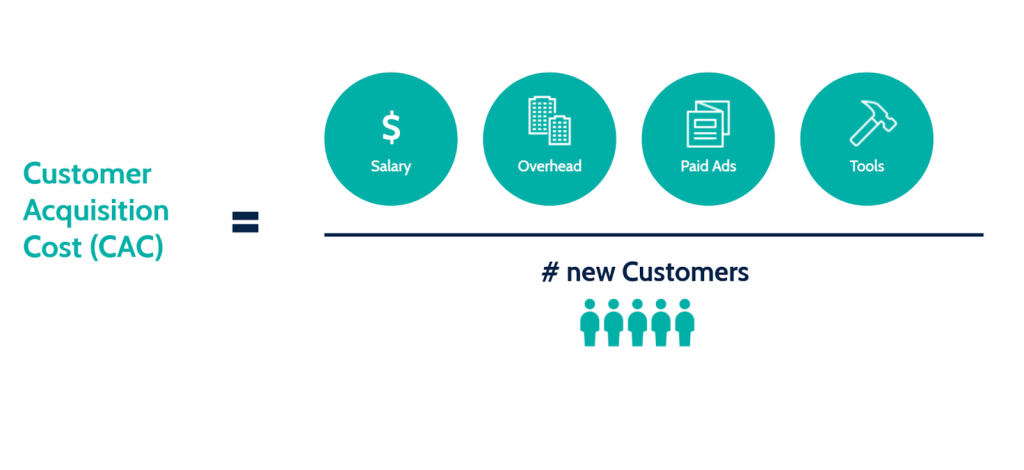
7. Customer Acquisition Cost (CAC)
Customer acquisition cost (CAC) or marketing spend per customer is the amount of money you spend to acquire a single customer. This includes any expense you have for gaining new customers, including employee salaries, overhead and all marketing costs.
With calculating your customer acquisition cost you will be able to tell how effective your marketing efforts are. If you spend a lot of money to acquire customers, your marketing may not be so efficient.
8. CLV/CAC Ratio
This metric is the ratio of your customer lifetime value and customer acquisition cost, the two previous metrics. It is important to measure those separately but also in comparison.
The CLV/CAC ratio will give you an idea of your business’ sustainability. A higher ratio means more successful and efficient marketing. This is because you spend less on attracting new customers who create more upselling and cross-selling opportunities, so those with higher customer lifetime values.
So, you should look for ways to increase it by increasing your customer lifetime value and/or decreasing your customer acquisition cost.
9. Customer Retention and Churn Rate
Customer retention rate is the number of customers a business retains over time, meaning the number of customers that come back to the business for more after they use their services.
Customer churn rate is the opposite of retention rate. It is the number of customers that cut relationships with the business after using their products or services —either shifting to another brand or overall stop making purchases from the industry.
Measuring your customer retention and churn rates is important because they are a good sign of how the average customer likes your products.
It is good and mostly very efficient to have loyal and retaining customers, so having higher retention rates might be an indicator of the overall success for your brand.
10. Customer Engagement
How your paying customers and potential customers interact with your website can provide you the details of what their wants and needs are.
- Which pages they visit the most often,
- which products they view,
- how much time they spend on which page,
- how often they visit the overall website,
can all be smaller metrics you can track under customer engagement.
These will help you understand how your current website design and layout are working and also will help you create future campaigns and make improvements that will answer your target audience’s needs. This will reduce customer churn since paying customers tend to stay when you keep answering their needs.
11. Social Engagement
Similar to customer engagement on your website, it is also important to track customer engagement on social media platforms.
Types of this could be
- the number of comments under your posts,
- the amount of content share (retweet, repost, direct message, etc.)
- or the amount of saves and downloads.
The social engagement your paying customers have with your business shows how much they enjoy and resonate with your products or services. It is also a way to let your customers promote your SaaS product/service for you.
12. Monthly Recurring Revenue
Tracking your profit each month and year is a way to see how your strategies during that period have affected sales and how successful you have been.
Doing this regularly and in comparison to the previous months can also help you measure your business growth. Seeing your monthly or annual revenue will motivate you and keep you on track while seeing the turnout of all your efforts.
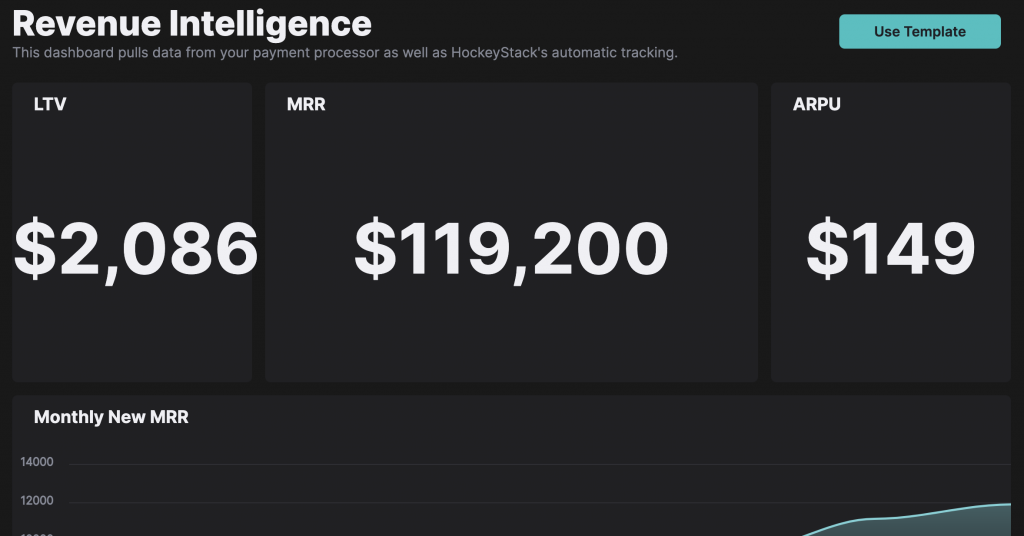
Using a revenue dashboard simplifies tracking. Various metrics are associated with your revenue, such as LTV, recurring churn, and ARPU. When you view all of these numbers on a single dashboard, it’s easy to see progress, make comparisons and identify trends or outliers in data. HockeyStack’s customizable dashboards can show you any graph, metric or funnel you need to better understand your recurring revenue.
13. Net Promoter Score (NPS)
In short, “Net Promoter Score” or “NPS” refers to the number of people who have used your products and services, enjoyed them and recommended your business to their friends and family.
This is an indicator of both your marketing success, because you managed to sell your product and made your customers promote it for you as well, and also your SaaS product’s quality, because people didn’t just like it they loved it so much they wanted others to use it as well.
So, higher Net Promoter Score means effective product marketing, better products and strong strategies. It also means reduced customer churn, as satisfied customers don’t leave.

Editor’s tip:
You can use HockeyStack‘s free survey tool to create NPS, churn, or pricing surveys!
14. Conversion Rate
Conversion is your primary goal with all the marketing tactics and campaigns; hence it is the number one indicator of your overall success. You should monitor conversion rates regularly and move according to the results.
High conversions mean that your strategies are strong and have worked well while converting new customers. Low conversion rates, on the other hand, means that the marketing methods you have been using hasn’t been so effective or beneficial.
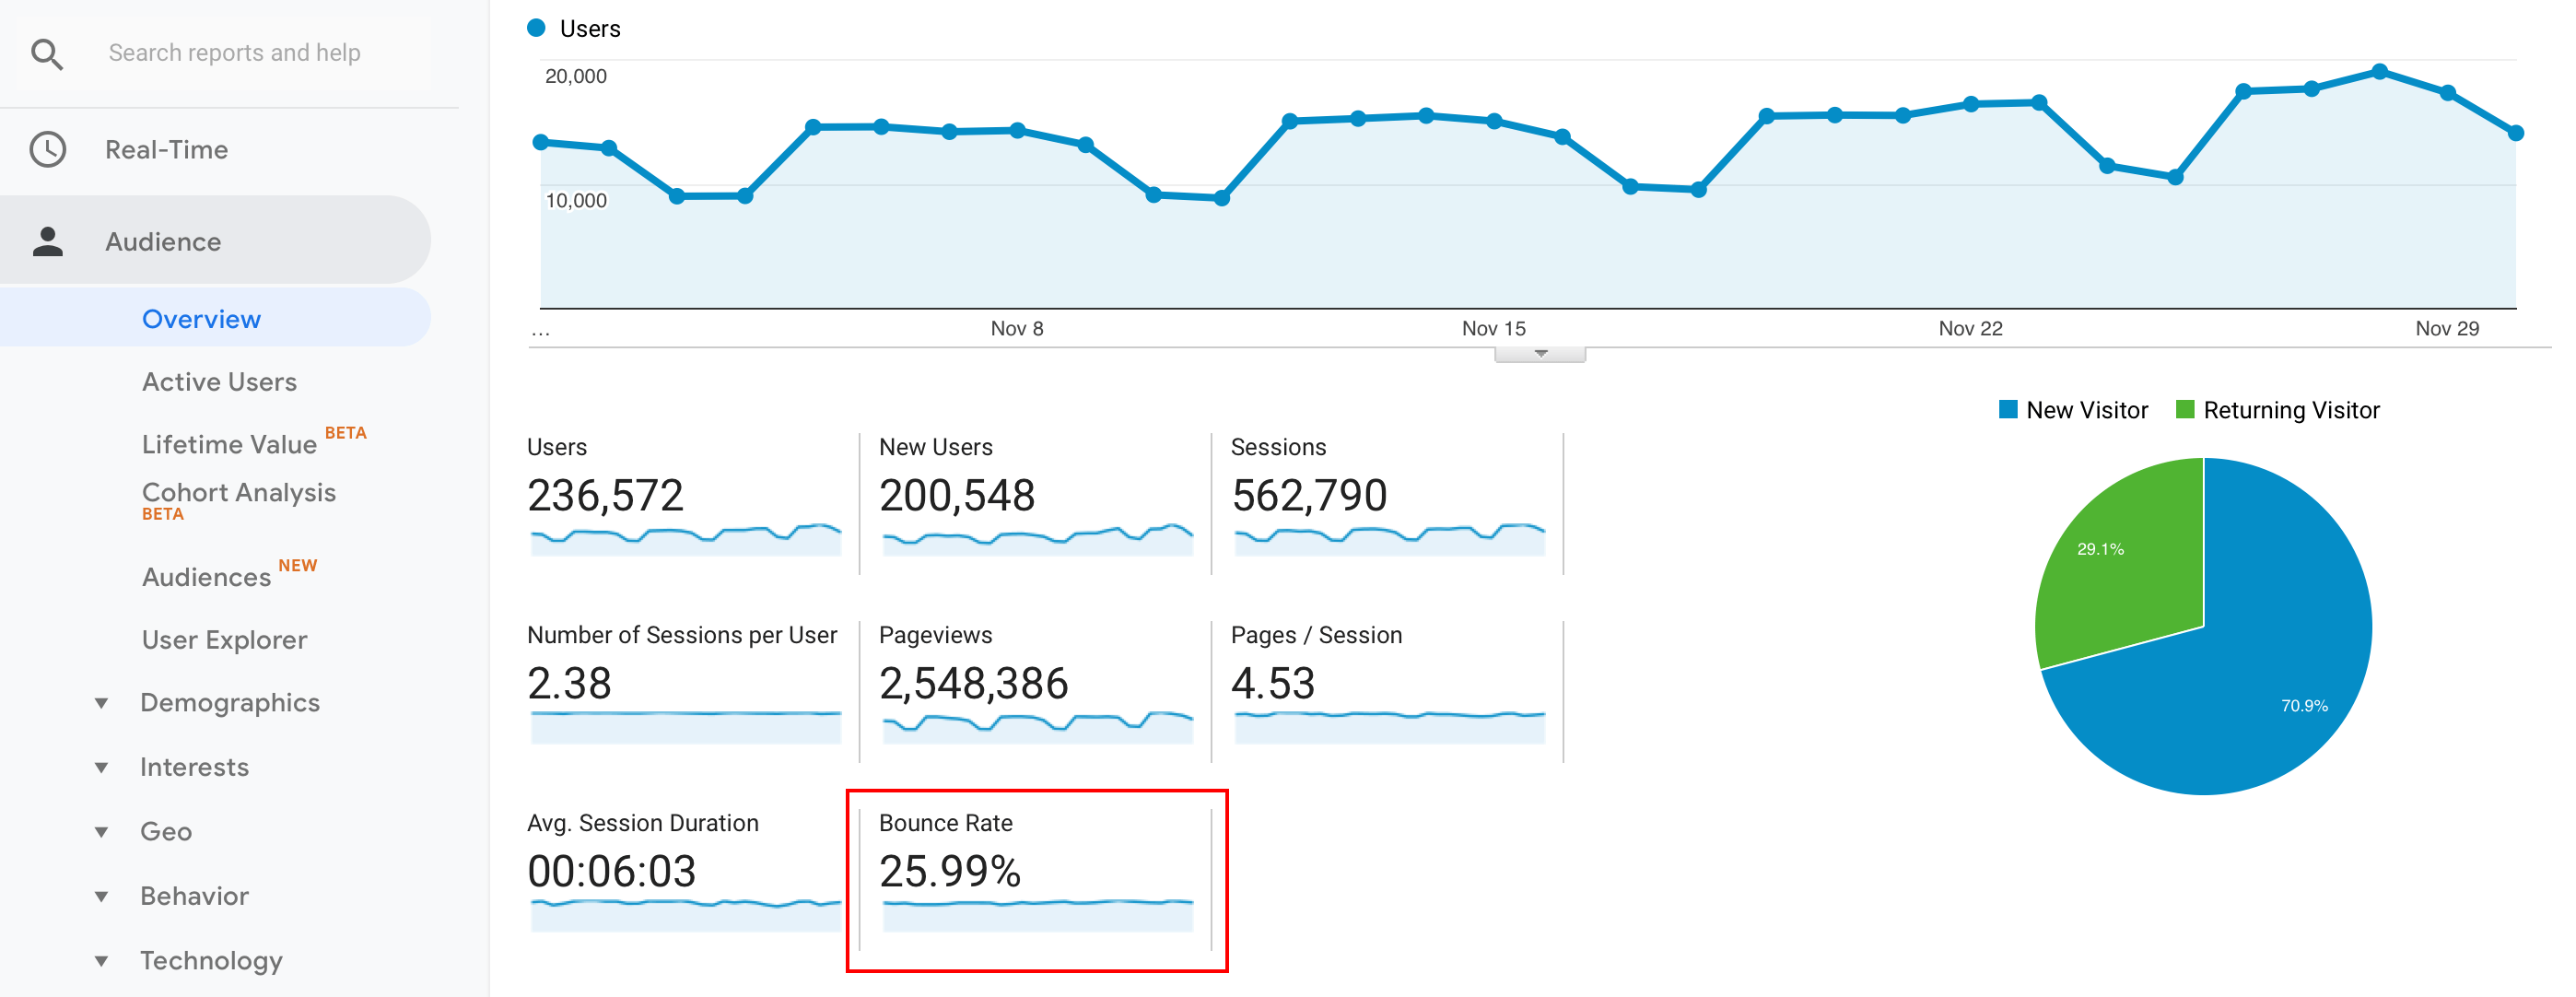
15. Bounce Rate
A bounce is when a person only views your homepage and leaves your website immediately after. It is good to check the bounce rate on a regular basis and orient yourself accordingly.
If the percentage of bounce on your website homepage is high, it might be time to shake things up a little bit. You might want to make your homepage more engaging and interesting.
Try to add more call-to-action (CTA) buttons —they could be interesting blog titles, images that lead to products when you click on them, or anything that will attract people.
16. Landing Page Conversion Rate
Your landing pages are crucial for the sales you make. You need to know if they do a good job with customer conversions or if they affect your sales negatively.
This metric can help you understand whether your content resonates with your customer profiles.
You can try making small changes like mixing up the offers or changing the wording and layout in order to find the most sales-optimizing form for these pages.

17. Referral Traffic
Referral traffic measures the number of people who comes to your website without a search engine —either through another website or social media or web ad.
If you have the right social links and backlinks that you will see that a high rate of your traffic is caused by referrals.
UTM tracking codes are the most commonly used method to measure referral traffic by marketers. You can get help from SaaS marketing analytics tools like HockeyStack as well.

18. Overall Website Traffic
This is a measure of the total number of visitors you get to your website over a certain period of time.
This metric can especially be useful to help see if certain content or campaign had worked well. It can also be a strong indicator of whether your website content is resonating with your customer persona or not.

19. Time Spent on Site
Seeing a lot of traffic to your website is good, but it is also important how long these people spend actually on your website.
You need to know if people enjoy your content and spend a lot of time reading your blog and browsing your SaaS products. This is also a good indicator as to how your website and content resonates with your target audience.

20. Number of Free Trial Sign-Ups
The referral traffic rate, overall website and organic traffic, time spent on your website, number of social media shares, and etc. —they are all important metrics, but in the end there is one that sums them all up.
The number of people who signed up for a free trial shows how many people are actually interested in making a purchase from your business. They are the ones closest to converting and higher rates show higher levels of marketing success.
21. Testimonials and Reviews
As the number of customers choosing online markets and using digital platforms to make purchases increase, customer reviews and testimonials become more valuable on platforms like G2 and Capterra.
It is a way for many eCommerce businesses to show they’re genuine, increase trust in customer relationships, and an opportunity to prove their credibility.
Let’s have a look at testimonials and reviews and their effects separately.
- Reviews are one of the biggest influences on customers’ purchasing decisions because they come from a community that they are a part of. Reviews can be in the form of a 5 or 10-point scale. Higher rates will mean that your product or service is successful and showing the high review rate will convince people to convert. However, lower rates will repel customers and signal you to reassess your product/service.
- Testimonials can be a little trickier to measure since not many marketing analytics tools allow options specified for testimonial analysis. You may need to combine multiple tools to measure the performance of customer testimonials. You can also conduct A/B split testing to see which testimonial works better. Although it sounds a little challenging to measure this, it is still a fundamental metric that shouldn’t be ignored.
Conclusion
At times, the amount of marketing and sales data your SaaS business tracks may overwhelm you. Numbers change easily, tracking your progress requires choosing the right one out of countless metrics, and drawing connections between different metrics isn’t straightforward. However, knowing the uses of each metric is a good starting point. What’s crucial in this process is having visualizations to help you. By using sales funnels, graphs and tables, you can get in control of all metrics and see areas of improvement easily.
FAQs
The main goal with tracking these metrics is to get feedback on your marketing investments: to let you see what works and what doesn’t. Every company has different marketing strategies and thus requires different metrics. However, in this article, we’ve given you 21 marketing metrics you must track which will be of great help no matter which strategies you follow.
These metrics are special to each business and its goals. How you should select which metrics to track is by looking at yourself. Determine your goals and what you want to achieve with your marketing campaigns. And then decide what you can measure that will give you prominent feedback and help you improve.


