Using Self-Service Analytics to Tap into Consumer Behavior Insights
The market size of self-service business intelligence was $4.73 billion in 2018. Between 2019 and 2026, it is expected to grow at a CAGR of 14.8% and reach a market size of 14.19 billion dollars in 2026. These numbers prove to us the rise of self-service business intelligence and its value to companies.
Read on if you’d like to learn more about this emerging data analytics approach and how you can apply it to your data analytics strategies. This article will find answers to all your questions and more.
What is self-service analytics?
Self-Service analytics is an analytical approach that allows users to manipulate data and generate insights without deep technical expertise. While the most obvious importance of self-service analytics is to gain insights faster with less technical knowledge, what you can do with self-service analytics doesn’t end there. Self-service analytics also provides a complete relationship between business users and IT with this analytics approach.
What is the difference between self-service analytics and BI tools?
The most apparent difference between business intelligence and self-service analytics is: In traditional BI, IT connects BI to end-users. On the other hand, in self-service analytics, IT focuses on enabling that BI for the same users rather than connecting BI. Also, traditional BI requires more significant involvement of data professionals and the IT department. Self-service analytics do not require IT department involvement. Therefore, once self-service analytics are implemented, IT also focuses on other infrastructural requirements. In addition, it is necessary to configure each data before using it in traditional BI. Conversely, you can use data in various formats from multiple sources in self-service analytics.
Self-service analytics removes IT from being an intermediary and automates how data is retrieved and managed. In addition, the role of IT in self-service analytics is more collaborative. In this analytics approach, IT is tasked with continually educating them in understanding and interacting with data using existing tools, helping to protect authentic data sources.
What are the challenges of self-service analytics?
It’s true that self-service analytics makes data analysis much more straightforward and relieves the IT department. However, there are some challenges you will have to face when applying this analytical approach to your strategies. If you are aware of these challenges, you can overcome them with the right approach.
Data governance policy
Before using self-service analytics, companies should prepare an appropriate data governance policy. It is sometimes possible to experience compatibility issues when using this analytical approach. Therefore, IT departments should carefully monitor compatibility issues and queries that are likely to cause problems to the BI system. In this way, they can quickly identify and correct these problems when necessary.
Educating business users
One of the biggest challenges with self-service analytics, according to Stodder, is that it requires more training than users expect. Although self-service analytics does not require data processing expertise, it is vital to train business users on this analytics approach. Expecting business users to use this technology without any training can lead to mismanagement of their data. That’s why basic training on this approach is essential before using any self-service analytics tool.
Using the correct data queries
Analyzing data correctly in a traditional BI system is the task of expert users. These users manually formulate queries to ensure that the data are combined perfectly. However, since the self-service analytics system has an automated process, you must choose the data queries correctly. Even the slightest error in data queries can lead to an erroneous decision. To avoid this error, you can leverage metadata when formulating data queries from different sources.
Using the right technology and tools
Another challenge to overcome when leveraging Self-Service analytics is choosing the correct data visualization and analysis tool for the right user. It would be unreasonable to expect both beginners and advanced users to get the same efficiency from the same tool. For this reason, you should use a tool suitable for the level and background of the users and offers them enough flexibility. For this reason, you should know the technical competencies and needs of your business users and choose a tool accordingly.
Best practices for self-service analytics and business intelligence

While self-service analytics does have many challenges, it is easy to overcome these challenges with best practices.
Leverage secure providers
Security is everything when it comes to data. Of course, it is not possible to be 100% sure of the security of any data provided. However, you can resort to solutions that will block your BI vulnerability. In this way, it is possible to keep your data security at the maximum level.
It is crucial for SaaS companies to trust the reliability of their providers. For the reliability of your providers, it’s helpful to consider these three things: SOC 2 compliance, CSA compliance, and data privacy regulations such as GDPR.
SOC 2 is a voluntary program followed by providers who take security seriously. This program includes audits that providers perform over time. Because of this, providers must continually demonstrate their compliance with the security policies they say they adhere to. CSA stands for The Cloud Security Alliance. This alliance provides a survey to assess the compatibility of providers. Finally, you must ensure that your providers comply with any data privacy regulations you must meet, such as GDPR and CCPA.
Create a self-service governance strategy
It is essential to have a self-service governance strategy to minimize risks. But remember that you should adjust its flexibility when determining this strategy. If your strategy is too strict, you may face a situation that causes you to stand still instead of improving. Therefore, a flexible governance strategy that your IT teams can take over will be best for your self-service analytics.
Onboarding is key
Business users, not data analysts, will use self-service analytics. Therefore, these users do not have detailed technical knowledge. Consequently, these users will inevitably need an onboarding process for all the basics when using self-service analytics, from where to access reliable data to determining which tables will be most relevant to their query. Identify the fundamental skills and knowledge business users need while creating this onboarding process, and build training kits around them.
Are there any tools available to help you build a self-service analytics architecture?
Alteryx
Alteryx is a self-service data analytics company specializing in data preparation and collation. With Alteryx, you can easily organize and analyze data in a repeatable workflow. In addition, Alteryx allows your team to handle processes faster, more efficiently and with less risk. Alteryx is also an easy-to-use tool for users without any IT background as a self-service analytics platform. In addition, Alteryx has a broad target audience that appeals to every sector and company.
Pros of Alteryx
- Manipulating Data Within Spreadsheets: You can use it in complex Excel data manipulation situations such as VLOOKUP, and COUNTIF. In addition, it can handle more extensive data than Excel can handle and the process is much faster and easier to see than Excel.

- Different solutions for different industries: Alteryx offers self-service analytics solutions that appeal to various industries and departments within these industries. With this tool, you can access a wide range of customized solutions from the healthcare industry to the oil and gas industry, from the supply-chain department to human resources. In addition, Alteryx offers different services for people in various roles in companies. For example, for a data analyst, Alteryx offers a solution-focused on automating the analysis, while it offers C-Level executives solutions for transforming their companies and solving employee problems.
- Predictive models: Alteryx includes a large number of pre-built predictive models. In addition, it allows users to add R or Python code directly within a workflow. It is possible to gain insights with pre-built models even if you have limited coding skills. Alteryx also offers the opportunity to publish the models you create. So, you can use these models on different platforms and share them with your team.
Cons of Alteryx
- Not the best for data visualization: Although Alteryx offers its users essential data visualization tools and possibilities, it is not ideal, especially for complex data visualizations. Of course, various third-party applications can complement some of these functions, but this is not possible with Alteryx alone
- Vendor Lock-In: Alteryx provides only its proprietary format. Therefore, it is impossible to export the results you obtained on this platform to Excel or another platform.
- Slower than other alternatives: Alteryx runs much slower compared to other alternatives. This can be a significant disadvantage for you, especially when working with large data sets.
- Steep learning curve: Alteryx is much more complex than its market alternatives and requires more technical knowledge. Therefore, it requires more preliminary preparation before using this platform. That means it is unsuitable for industry newbies and users who are not experienced in data processing in self-service analytics.
Pricing
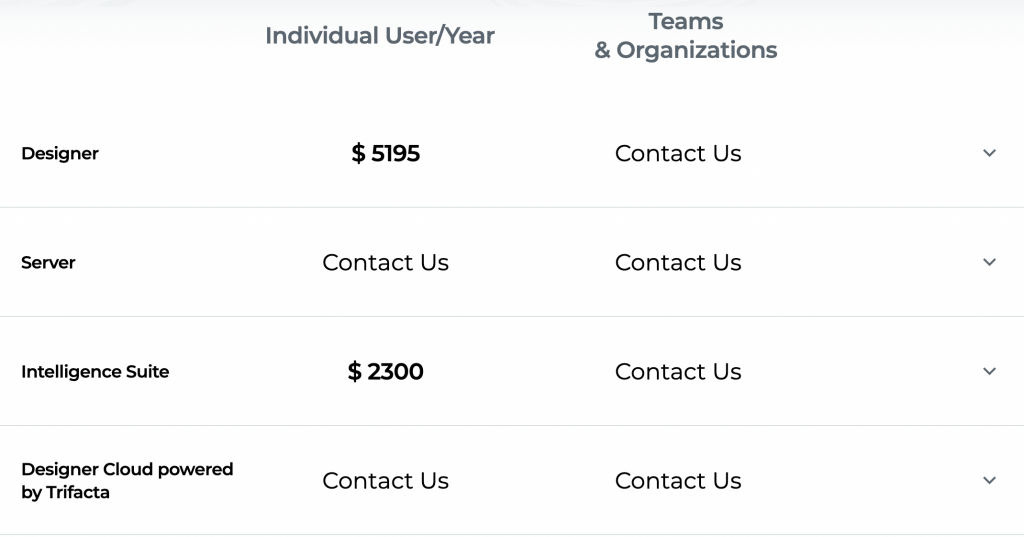
Alteryx has many different pricing options. However, many of these prices are unfortunately not listed on their website. It would be best to contact them to have the pricing information of the package that fits your needs.
Reviews
Alteryx has a rating of 4.8/5 on Capterra and 4.5/5 on G2. Some of the positive reviews written about Alteryx are as follows:
“Alteryx has been a great tool for all my jobs. Let me stand out with fast and quality solutions.”
“It’s incredibly powerful and includes many features for most usages.”
“I like being able to quickly manipulate data and create new rows and columns with ease, making the data easier to read and adding new factors into data sets.”
On the other hand, some of the negative reviews are as follows:
License is very costly, which hinders the use of it by everyone.”
“The limitation of some tools and the high barrier to developing new functionality.”
“I dislike how it can be cumbersome when one creates complex workflows that take over an hour to load just once.”
Domo
Domo is a SaaS business intelligence tool where you can create focused dashboards, dashboards and charts. It helps you keep track of your data with its KPIs and metrics and facilitates the data analysis process with customizable dashboards.
Check out here for Domo alternatives!
Pros of Domo
- Data Governance: Domo allows you to manage all your data centrally. In this way, you can establish real-time and complete control over all your data. In addition, if you already have a data warehouse, you can collect metadata in this warehouse and integrate Domo with your data warehouse.
- Fully Mobile: Domo allows you to monitor and analyze your data anywhere, anytime. Therefore, it can work entirely on mobile. Domo is mobile means that you can speed up your work and perform your transactions with a few clicks from your phone.
Cons of Domo:
- Transactions take time: Domo performs transactions more slowly than other alternatives on the market. This slowness can become a big problem, especially when processing large data sets.
- Expensive compared to its alternatives: Domo is a more expensive platform compared to other BI and self-service analytics tools. That makes it difficult to choose, especially for small-scale companies and startups.
Pricing

Domo’s website does not contain any pricing information. You need to contact Domo for the most reasonable pricing, including the most suitable features for you. Also, remember, you can use the free trial version to see if Domo fits your needs.
Reviews
Domo got 4.2 on Capterra and 4.4 on G2 out of 5. Some good reviews about Domo:
“I really like Domo it’s hands down my favourite piece of software and also my favourite company to work with.”
“Being able to see changes in things that go month over month (and even year after year) helps us make informed decisions that are in the best interest of our company and sales teams.”
“Also, it seems to be more than capable in terms of importing data from disparate applications, which is very important.”
On the other hand, some of the bad reviews are as follows:
“Basic functionality was confusing. As an example, why did you need to go to another screen to sort columns.”
“The problem is that there’s a lot of variance for when the sources finish updating so sometimes it updates without getting all the data in and looks weird.”
“Domo can be very difficult to learn at first if you are not somewhat familiar with SQL.”
Hockeystack
HockeyStack is a SaaS analytics and attribution platform used by 6900+ companies.
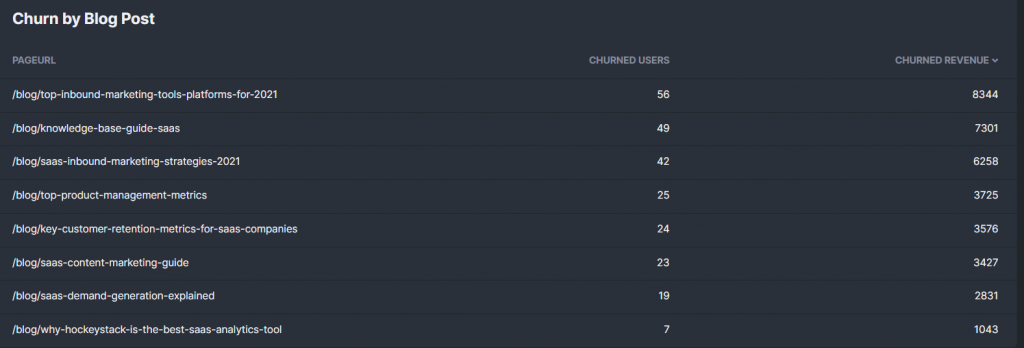
Using HockeyStack, you can build any dashboard you need with metrics from different departments. Custom dashboards allow you to connect the dots to better understand what drives revenue for your SaaS.
For example, you can build a churn by the blog post user signed up report:
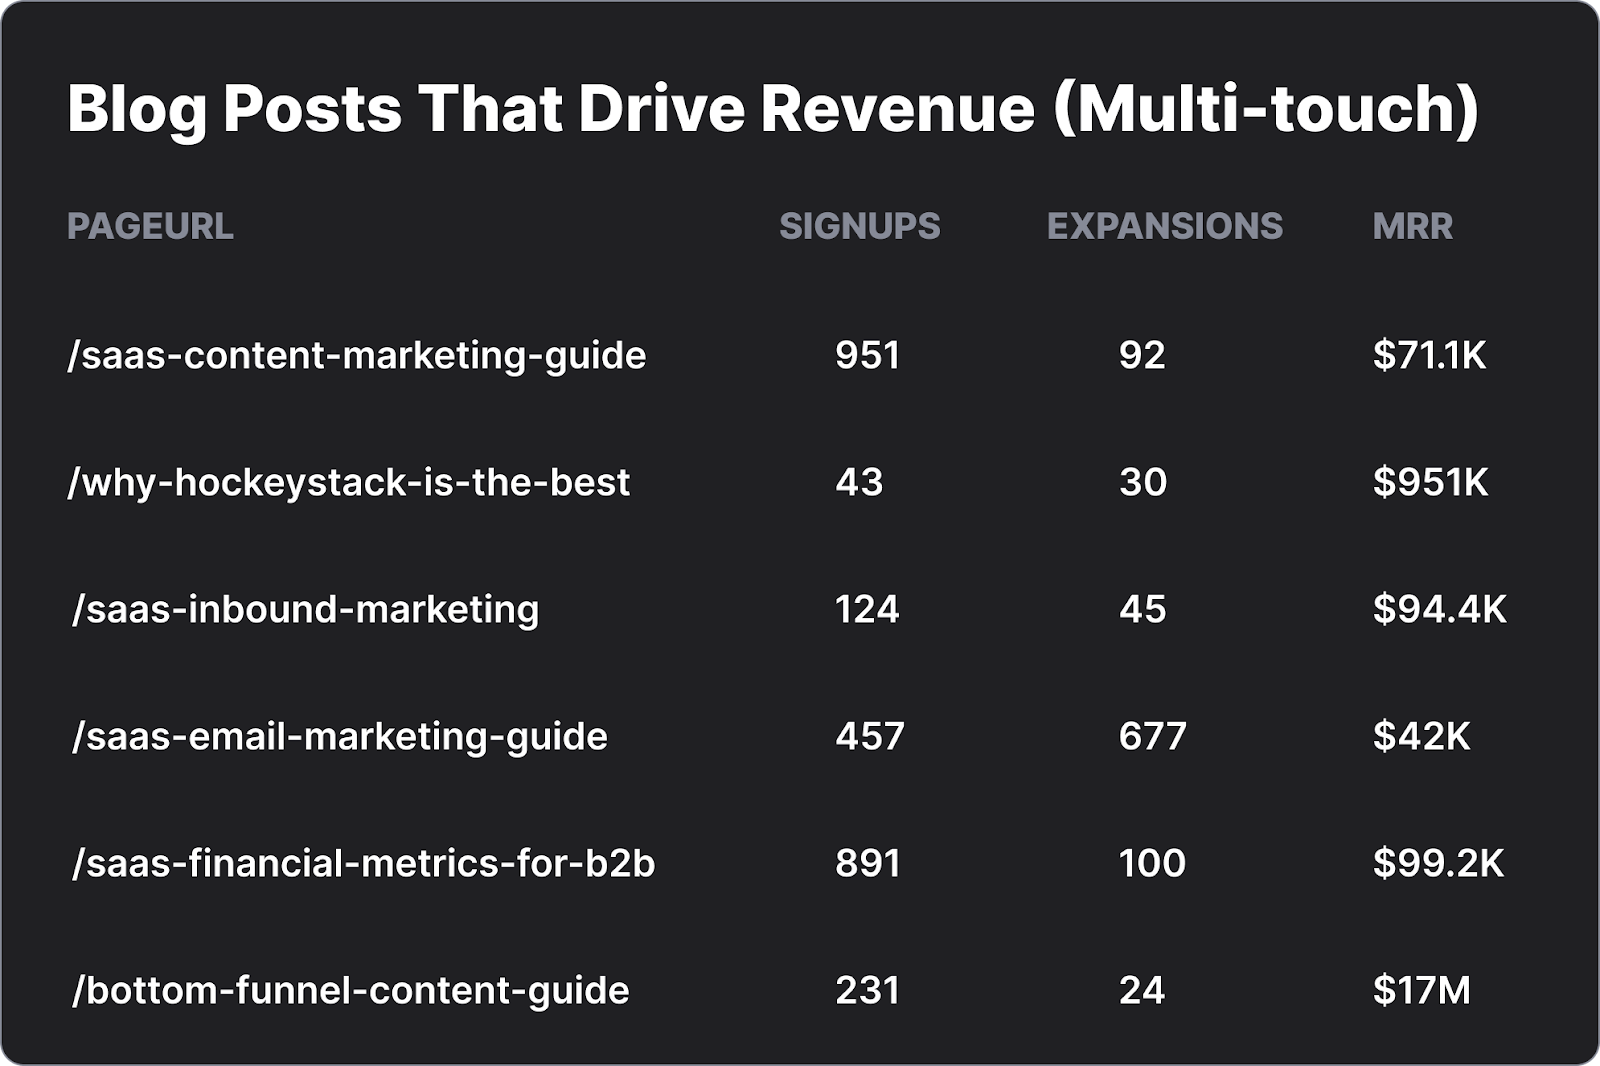
A report to measure the exact revenue you get from blog posts:
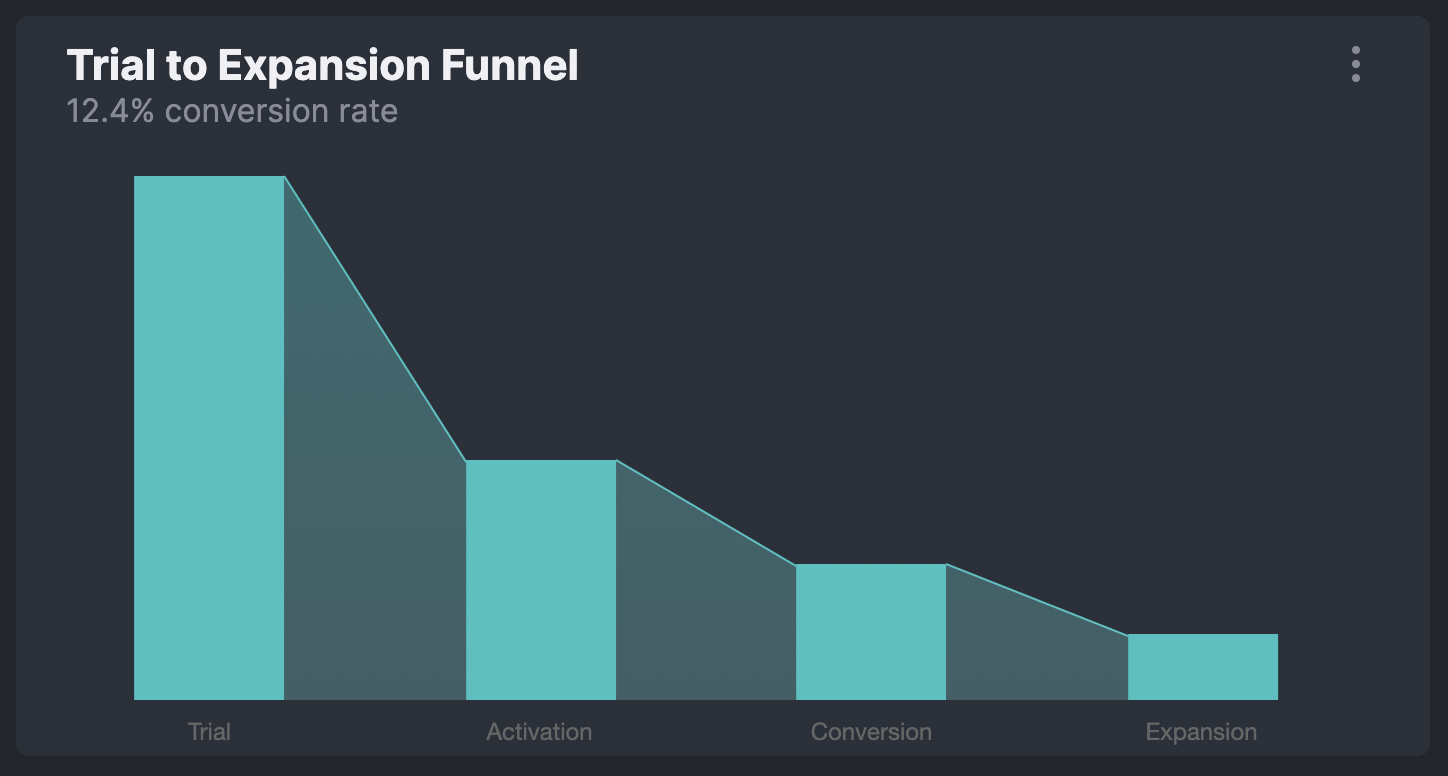
A trial to expansion funnel:
An engagement by feature report:

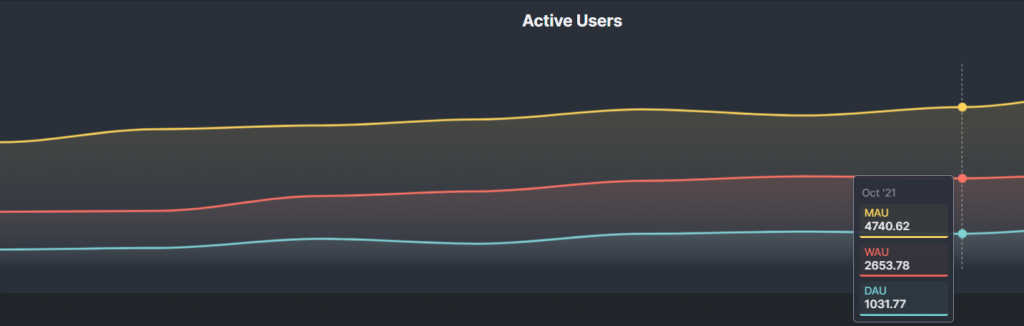
Or an active users report:
On top of custom dashboards, HockeyStack has other features too, such as
- Surveys
- Step-by-step user journey
- Funnels & goals
- Revenue Attribution
and more.
HockeyStack Pricing
You can check out the pricing page here.
HockeyStack Integrations
- Paddle
- Stripe
- Hubspot
- Crisp Chat
- Mailchimp
- Intercom
- Pipedrive
- Chameleon
- Salesforce
- Zapier (coming soon)
HockeyStack Summary
The unique benefit of HockeyStack is its ability to unify and visualize your marketing, revenue, sales, and product data using no code. This allows you to uncover unique insights that you wouldn’t be able to by using multiple tools as they cause you to have fragmented data.
- You can integrate with Stripe, Paddle, Hubspot and other SaaS platforms to build every single dashboard that you can think of, using all sales, marketing, revenue, and product metrics.
- You can create funnels, goals, and surveys, which are rare to get with other tools on this list.
- You don’t need any developers, tracking is cookieless, and the script is small, so it doesn’t increase your site loading time.
Conclusion
Self-service analytics allows you to get much more accurate data-driven insights without the hassle. With a self-service analytics tool by your side, you will be able to mitigate the challenges of analytics and dive deeper into your data. By clearly defining your company’s priorities and expectations from your self-service analytics infrastructure, you can make a much more informed decision and choose the right tool for your business.
FAQs
Self-service analytics platforms are business intelligence tools where users can process data, prepare reports and generate insights without any complicated data knowledge.
The primary purpose of self-service analytics is to make data easily accessible for casual business users without any technical knowledge and make it easy for them to create insights with that data.


