Here’s What You Need in an SEO Dashboard
Nearly half of all online shoppers, 44%, begin their search using a search engine like Google or Yahoo. These shoppers make up your SaaS’s customer base, so your tools have to appear in their search results as a potential purchase. This is where SEO comes into play: by optimizing your ranks in search engines and optimizing the content you put out onto the web, SEO ensures that you’re catching the attention of the 44%.
A crucial part of Marketing Analytics, SEO should be one of your top priorities as a SaaS company. And, just like with any other marketing strategy, SEO has to be optimized via consistent performance analysis. An SEO dashboard lets you measure the success of your SEO efforts whenever you want so that you can perform such a consistent analysis. Keep reading to learn more about what an SEO dashboard does, how it’s practical, and more.

What is an SEO dashboard?
SEO is about increasing organic traffic and brand awareness by improving the ranks of your web pages in search engines. This goal requires constant tracking of keywords, competitor analysis, and content optimization; things you cannot do manually. Since SEO analytics has a complex goal and is based on various metrics and KPIs, you need a dashboard to make analytics easier.
Thus, the purpose of an SEO dashboard is to give clients a comprehensive summary of their SEO performance without going into an overwhelming amount of detail. In addition, an SEO dashboard helps businesses track all of these different metrics in real-time.
Another aspect of a good SEO dashboard is customization. Since each company may have different expectations from their SEO performance, they should choose the metrics and KPIs they would like to keep tracking on their dashboards.
However, even if the specific goals change from business to business, their overarching goal is essentially the same: to track and improve your content marketing strategy. For this reason, your SEO dashboard should include the revenue per blog post, churn by a blog post, conversion rate, and lead quality metrics. But if your business’s primary focus is to increase the number of signups, you’ll be using more of the specific metrics such as the internal links’ signup influence. If your main focus is to increase content engagement, you could use the bounce rate and time spent on page metrics instead.
What’s the difference between a report and a dashboard?
You can (and should) use both reports and dashboards while analyzing SEO performance. However, you cannot use the two interchangeably as they have different formats, purposes, and amounts of detail.
1. Difference in purpose
- SEO dashboards are useful for data visualization. One of their main purposes is to provide a collection of graphs and charts that make decision-making easier: visualizing important SEO metrics helps businesses draw conclusions and understand the bigger picture. Thus, the most important goal of an SEO dashboard is to present the complete picture of the most essential KPIs and SEO metrics.
- SEO reports do not focus on the bigger picture, they focus on a specific question or area of improvement instead. These questions can have any range or scope, and they could use any combination of metrics. While SEO dashboards have to use certain KPIs that all serve to a big goal (presenting the overall SEO performance,) SEO reports do not have to use the most vital and generic KPIs/metrics. Only using the ones that answer your specific question is enough.
2. Differences in the content
- SEO dashboards have dynamic content. They give live updates about SEO performance as they update on the metrics in real-time. Also, the dynamic content is not heavy in detail, because as I’ve stressed before, dashboards shouldn’t overwhelm the viewer with an excessive amount of information, only the necessary data that contributes to the overall purpose.
- SEO reports have a single focus, and they report on the data from a certain period. The data is not updated, and thus a report has a certain date of expiration–it’s impractical to use an SEO report from last year unless you’re performing a comparison. Furthermore, an SEO report uses much more detailed data and information, since its goal is to analyze a topic in-depthly or to give a comprehensive answer to a question.
3. Difference in format
- SEO dashboards (usually) contain less text and more visuals. Their content can be fit into a single page, and it’s easy to consume.
- SEO reports are made up of multiple pages. Due to the amount of detail and their purpose, reports are less digestible with more explanatory text, though they also make use of charts and graphs to support a conclusion.
Why you need an SEO dashboard?
An SEO dashboard is essential for any SaaS company that continuously wants to improve its SEO ranking. There are several reasons why you should use one:
Makes Monitoring SEO Campaigns Easier
Businesses run SEO campaigns to improve their pages’ traffic and ranking. These campaigns use web audits, SEO reports, keyword research, link building, and more to optimize existing websites and pages. However, after running an SEO campaign, it may be hard to understand whether or not it has made a big difference.
There are many results that an SEO campaign can have. It can result in more engagement and a better quality of leads instead of more traffic, or it may have improved search engine rankings without changing engagement or traffic.
An SEO dashboard helps businesses see how their campaigns affect their SEO strategy’s success. It’s hard to select the correct data, put it into graphs, and get a comprehensive overview each time you do a campaign. Also, you’re likely to be running several campaigns simultaneously. Thus, using an SEO dashboard is vital to keep track of each campaigns’ success.
Provides Easy Access to Analytics Data
An SEO dashboard consolidates your most important SEO data into a single space. Usually, this dashboard can be accessed by the people in your marketing and sales team and your clients. Not all of these people have a complete understanding of SEO, as it is a complex process involving a lot of detail.
Having a single source that visualizes data via graphs, charts, and live updates makes the process a lot more understandable to all the people involved with your business. This means that anyone in your team, including your clients, can develop ideas to improve your strategies and campaigns.

What should a good SEO report contain?
You’ll be using SEO reports to analyze the progress in a particular area. Maybe you’ve changed the placement of your keywords or increased the word count in your articles, and you’re asking how these changes affected your SEO performance. Or, you may be reporting on your monthly progress. Whatever the reason, a good SEO report should,
- Illustrate the steps taken in the period of interest or the changes that have been done,
- Demonstrate the results, impacts, and progress,
- Draw necessary conclusions and recommend ways of improvement.
To do all of this, an SEO report should include:
1. Traffic and/or Usage by Channel
One of the most common SEO goals is to increase the traffic driven by a marketing channel. This goal may look like optimizing the company’s traffic from social media. After an SEO campaign directed at Twitter, Instagram, and Facebook users, you should build a report that analyzes each traffic source to see the improvements. You might have used different campaigns for different sources, and you can use the separate channel analysis to compare the results. Or, if you used the same campaign for the three channels, you can see if it was equally productive for all of them.
2. Rankings
A large part of SEO is about improving rankings on search engines. This improves visibility and brand awareness. Thus, an SEO report should also include ranking performance. However, plain ranking data is useless. This data has to be backed up by context and other metrics. You should also remember that search engines may provide different results based on search history and demographics.
3. Goal Completion and Conversion
While having a comprehensive ultimate goal is essential, breaking down that goal into smaller steps is also important. For instance, if your goal is to improve conversions using SEO, you should start by selecting smaller goals. These could be clicking on a second inbound link or staying on the pricing page for a certain amount of time. These goals can be used as indicators of conversion. Then, you can see the number of people who completed your goals and the number of those that converted.
Using these two data is productive because the discrepancies show essential facts. For example, if a significant number of people are signing up for your newsletter (goal completion) but a minimal number are then signing up for your free trial (so, not converting), you should take a closer look at your newsletter. In short, these two data can show you where you need to improve. This area of improvement may be about SEO or any other marketing strategy you’re following.
4. Bounce Rate
An effective piece of content is said to be “sticky:” this means that your content hooks a reader and keeps them on your site by leading them to your other pages. Your Bounce Rate shows the number of users who visit your site and leave before clicking on another page. A high bounce rate (together with a low number on your Time on Site metric) means that your content isn’t informative or interesting enough to keep leads and customers on your web page. And if you can’t hold leads on your site, you can’t convince them to learn more about your brand and tools.
A good SEO report should include your Bounce Rate because improving your ranking is only possible through creating meaningful and engaging content. Search engines reward those sites that want to provide searchers with the information they’re looking for, not pages that use a bunch of keywords to pop up in the search results. Your Bounce Rate shows whether or not users find what they’re looking for within your pages and if Google will reward your site for this.
5. Remarks on your Site’s Health
A page with broken links and a long loading time isn’t going to be on the first pages of Google. Even if it makes it there, it won’t lead to conversions because conversion rates drop by more than 4% with each second your site takes to load. If your site takes 15 seconds to load, you’ve lost more than 60% of your prospective customers!
Keeping track of your site’s health ensures that you don’t lose leads and customers to fundamental technical issues. There are a few things you should be reporting on in terms of your site’s health: the errors, if there are any, broken links and pages, and speed are few of these. Dedicating a section of your report to your Site’s Health and setting an error correction goal for each monthly report is an easy way of improving your site’s rankings and traffic.
6. Recommendations for Further Improvement
Of course, a report’s main job isn’t to give marketing advice. However, the primary goal of an SEO report is to be a valuable source for improvements and revisions in your SEO strategy. So, ending your reports with ideas and proposals that could improve your bounce rate, conversion rates, rankings, etc., is always a good idea. This shows that you’re not only reporting for reporting’s sake and that you’re already thinking of the next step. It accelerates your (or the client of your report’s) decision-making process by being a source of inspiration and a starting point.
Example SEO Reporting Dashboards
Blog Posts by Revenue

As I’ve stated before, the influence of each one of your posts on your MRR, number of signups, and expansions are some of the significant things you should be tracking. SEO is about using this data to do more of what works. For instance, the dashboard above shows that the greatest MRR came from the customers who visited your content marketing guide. This means that the demand for information about content marketing is more significant than that for product management or demand generation. So, you should focus more on this type of content to improve rankings and site performance.
Content Lead Quality
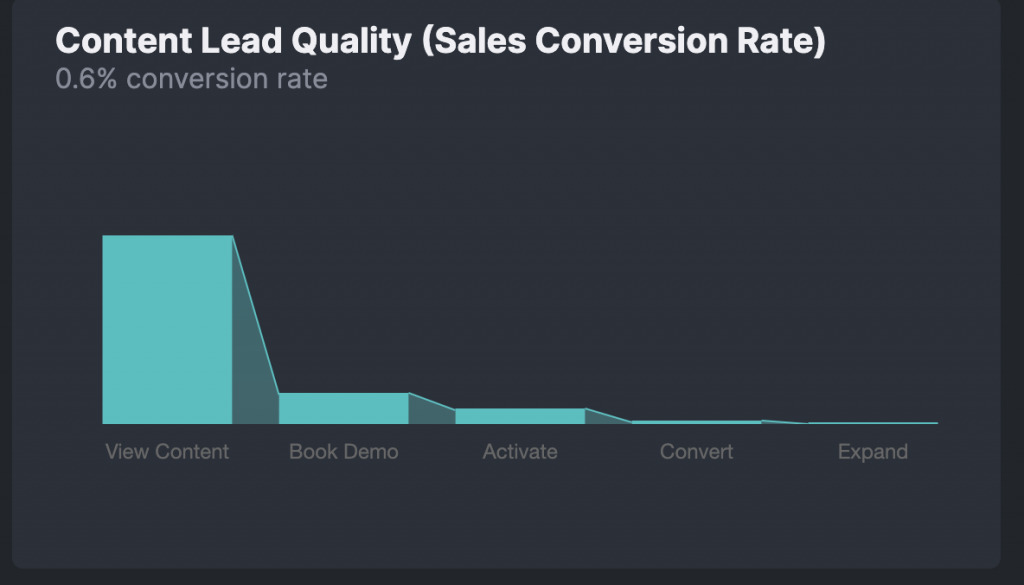
A good SEO strategy increases traffic and improves the quality of traffic by creating more targeted and meaningful marketing content. Thus, measuring both your conversions and the actions taken by new customers is a must. You may have increased conversions but failed to attract customers with high LTVs, who were willing to expand. This tells you a lot about the customer segments that your page could not reach. As SEO isn’t only about ranking but also about reaching customers from all segments, this is something you should care about.
Goal Tracking
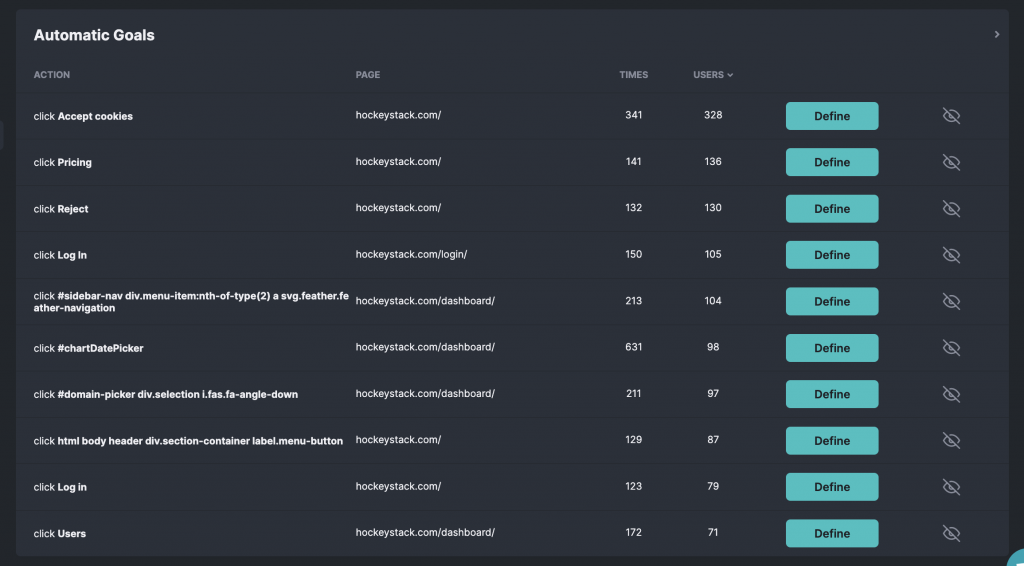
I’ve talked about the importance of goal completion before. While Goal Tracking is an essential part of SEO reports, it should also be a part of your daily SEO tracking. A live dashboard that shows you the number of users and times a goal has been completed is helpful. After making a change with, say, your Pricing page in an attempt to make it more clickable, you can directly see the impacts of your update. Later on, you can use previous data from your dashboard on your report to make the necessary comparisons and conclusions.
Pro Tip:
To see more dashboards like these, check out HockeyStack’s customizable templates 🙂
Conclusion
There’s a simple reason why 61% of marketers say their top priority is improving their SEO strategy and online presence: SaaS companies find their customers online on search engines. Since countless companies are fighting for the attention of the same customer segments, you have to make sure that your SEO efforts are performing as they should be. To do this, you need to utilize both SEO dashboards and reports. Keep in mind the criteria for an excellent report and dashboard, make adjustments based on data and keep updating your site. Once you start to repeat this cycle, your inbound marketing content will be on the first page in no time.
FAQ
Ahrefs, SEMrush, and Moz are SaaS companies’ most popular SEO reporting tools.
Da is short for Domain Authority, and Pa is short for Page Authority: these two indicators were created by MOZ and are used to predict a web page’s rank on a search engine.


