9 Subscription Business Model Metrics To Track
According to Gartner’s report, 80% of SaaS companies have subscription-based business plans. This rate is expected to increase further in the future. There are several reasons why a subscription-based business plan works for SaaS companies. First of all, this model increases how users discover and interact with a new product or new product features. In addition, with this model, it is possible to predict your income more clearly compared to other business models.
Of course, you need to pay attention to specific metrics to optimize this business model for your SaaS company and maximize the benefits. Read on to learn about the nine key metrics you need to analyze for the Subscription business model.
Pro Tip:
Click on the dashboard images to see them live!
ARPU
ARPU, or average revenue per user, measures the profitability you get from each product subscriber. You need the ARPU to express the income you’ve earned from each of your active users over a while.
How to calculate ARPU?
The most basic way to measure ARPU is to divide your monthly recurring revenue by the number of active users. The formula is as follows:
Average Revenue per User (ARPU) = MRR / Number of Active Users
Why is ARPU important?
One of the main reasons ARPU is so important for subscription businesses is that it gives you information about your company’s financial situation. Therefore, ARPU is an essential metric for determining the impact of your subscription system and pricing on your revenue. Besides, the ARPU metric also shows the value of your product to your market and audience. If your ARPU rate is high, your product is in demand. You can turn this situation into an opportunity for up-selling and cross-selling and change your pricing.
| MRR | Number of users | ARPU | |
| Company A | $119200 | 800 | $149 |
| Company B | $134000 | 1000 | $134 |
| Company C | $223500 | 750 | $298 |
Another reason why ARPU is essential to your company is because it allows you to compare yourself to your competitors. For example, according to the table above, the company with the highest ARPU is Company C. Therefore, Company C is considered the most profitable of these three companies. A company’s high ARPU ratio in similar conditions is a sign of success for potential investors and potential users. Therefore, users are more likely to prefer Company C.
Gross Margin
Gross margin is the revenue from products sold minus the cost of goods sold (COGS) and is the amount of money the company keeps from selling a product. The higher the gross margin, the better because, the higher this margin, the more capital the company has.
How to calculate gross margin?
The formula of gross margin is as follows:
Gross Margin = (Revenue – COGS) / Revenue
Why is gross margin important?
Gross margin is an important metric to track to maintain a balance between the cost of your product and your revenue. Also, the gross margin gives information about a company’s financial health. The more gross margin you have, the more opportunities you can reinvest in your company. The ideal gross margin for a SaaS company is above 75%. Therefore, it will benefit your company to increase your gross margin as much as possible.
LTV: CAC
Your LTV: CAC ratio is the total sales you make to one or a group of users divided by the cost of persuading that user or group of users to take advantage of your SaaS product. This calculation shows the return on investment of the money you spend brings a customer to your SaaS company.
How to calculate LTV: CAC?
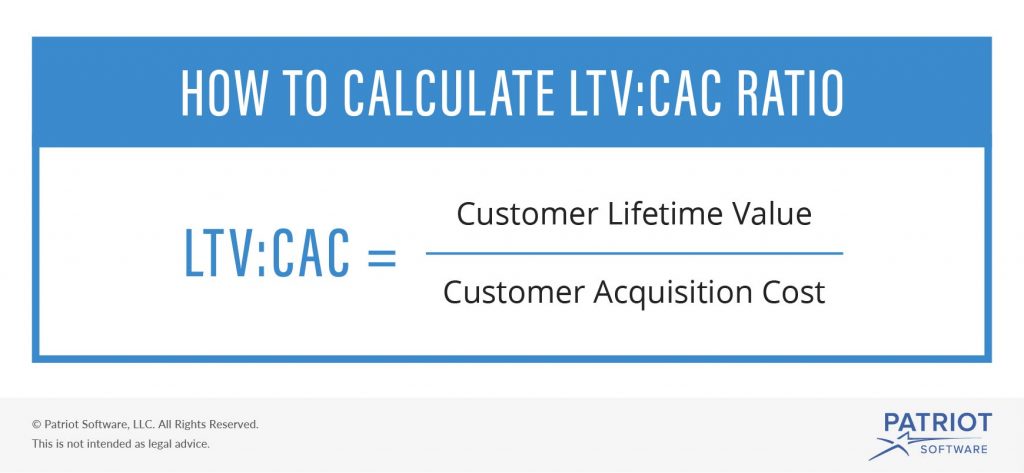
You calculate the LTV: CAC ratio, as the name suggests, by dividing your Customer Lifetime Value by your Customer Acquisition Cost.
Why is LTV: CAC important?
| LTV | CAC | LTV: CAC | |
| Company X | $1977 | $1894 | 1.04 |
| Company Y | $2085 | $695 | 3.00 |
| Company Z | $2057 | $415 | 4.95 |
The LTV: CAC ratio is essential for SaaS companies with a subscription business model because it is one of the most basic ways to determine and evaluate your company’s future expectations. A higher LTV: CAC ratio indicates you have faster growth potential because it suggests that you will spend less capital to have more value-added users. The best LTV: CAC ratio for a SaaS enterprise is considered to be 3:1 (Company Y in the table). Of course, if you’re a start-up SaaS company, it’s pretty understandable for this ratio to be lower. If your balance is close to 1:1, like Company X in the table above, it may be time to check how you use your sales and marketing budget because it means you have to fight hard to make a profit. On the other hand, if your ratio is close to 5:1 like Company Z, you may be spending less than you should for your users. This ratio may cause you to miss business opportunities.
ACV (annual contract value)
ACV stands for annual contract value and represents the total revenue generated by a contract during the year. Although this metric is generally considered more by SaaS companies with yearly or multi-year subscriptions, it is a metric that all SaaS companies with a subscription business model should pay attention to.
How to calculate ACV?
The ACV formula is as follows:
ACV = total contract value / total years in contract
For example, if you use $20,000 and sign a 4-year deal, your ACV on that contract would be $5,000. In addition, it is possible to calculate your ACV for not only annual but also monthly-based contracts. For example, if your user signed an agreement to pay $500 per month, your ACV would be $500 times $6,000 over 12 months.
Why is ACV important?
Its importance becomes more apparent when ACV is evaluated not alone but together with other subscription business model metrics. Therefore, ACV should not be considered separately from value metrics. Thus, one of the biggest reasons ACV is important is that it plays a role in the consistency of other metrics. For example, it is possible to evaluate your ACV by comparing it with the CAC. If your ACV is not balancing your CAC, you may need to reconsider your strategies.
Sales Cycle Length
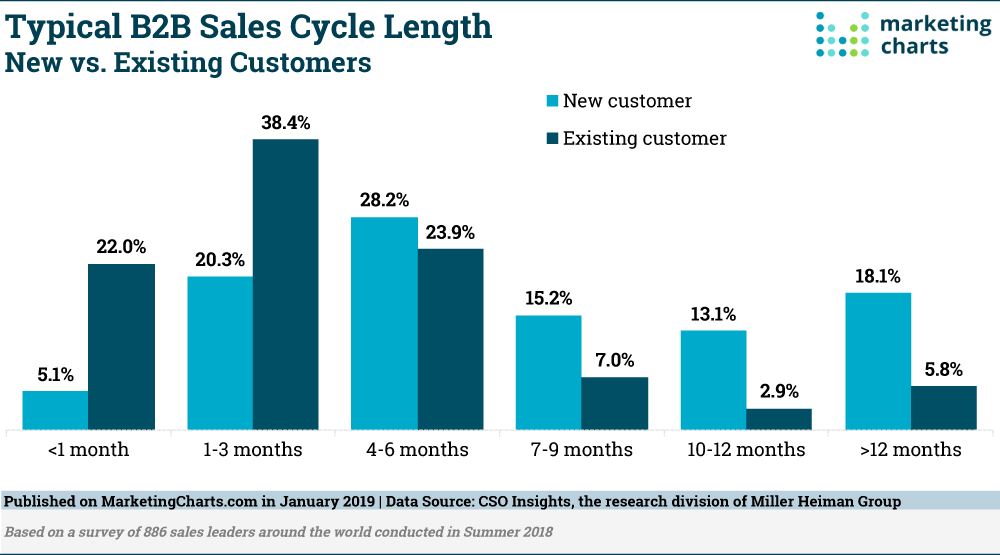
The sales cycle length is a sales process metric that indicates the length of time it takes to convert a potential user to your user. This metric will be beneficial in your sales forecasts and check that your goals and strategies match what is happening.
SaaS sales cycles vary depending on the status of potential users and the complexity of the product. In addition, the price of your product is also a factor that affects the sales cycle. The more expensive your product is, the longer this usually extends the sales cycle. In addition, a product with a free trial period can be expected to have a longer sales cycle than other products.
How to calculate sales cycle length?
To determine your average sales cycle length, you must find the number of successful sales you have made during the specified period. You then select the number of days from start to finish for each successful sale and add them up. Finally, you calculate the length of your sales cycle by dividing this total by the number of successful sales you have made.
Why is sales cycle length important?
Both long and short sales cycles have their advantages and disadvantages. Therefore, while working on your sales cycles, it would be best to take action by considering your users’ expectations from you and the expectations of your SaaS company. However, an average SaaS sales cycle time is 84 days regardless of ACV. For companies with ACV below $5,000, this period is 40 days on average, while for SaaS companies with ACV above $100K, this period is 170 days on average. It would be best if you also have a sales cycle of around this average length according to your company’s ACV.
Churn MRR
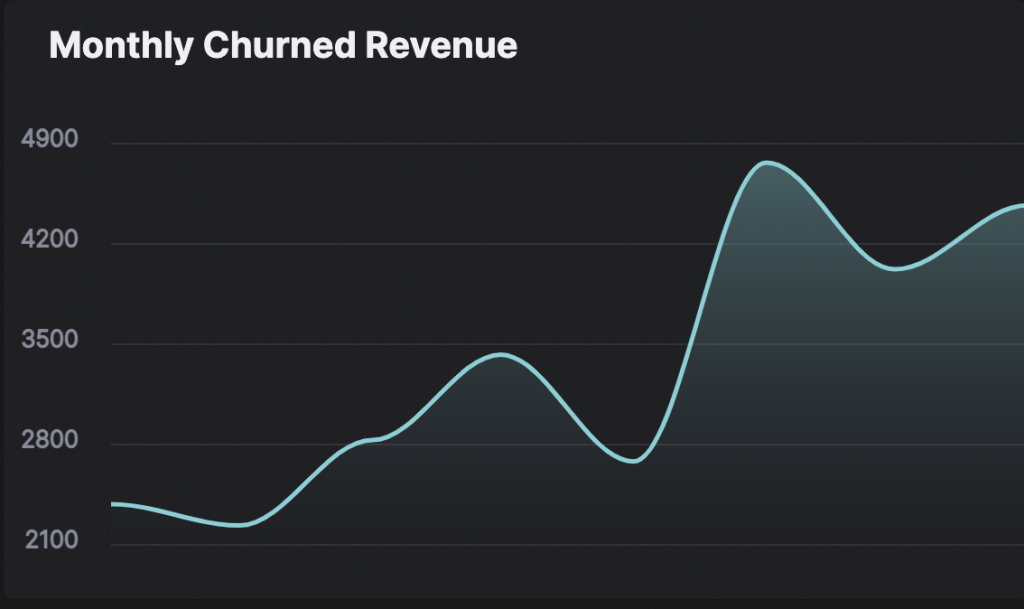
Churn MRR rate is the name given to the MRR rate you lose due to users canceling their subscriptions. It is usually calculated as a percentage.
How to calculate churn MRR?
To calculate the Churn MRR, you must know the MRR of each lost user. If you could find your Churn MRR ratio by adding up all these churned MRRs and dividing them by the total MRR over that period: The formula is:
Churn MRR = Total MRR of all lost users / Total MRR
For example, in March, user x unsubscribed, and therefore, you lost $250 MRR from him. Users Y and Z decided to use a more affordable package, which cost you an MRR of $50 per user. If your total MRR in March is $2000, your churn MRR rate is (250 + 50 + 50) / 2000 = 17.5%.
Why is churn MRR important?
SaaS companies with the Subscription model need to master the churn MRRs. One of the main reasons for this is that you are more clearly aware of your financial situation and make more precise economic predictions for the future. It also helps you understand the value your products add to your company.
New MRR
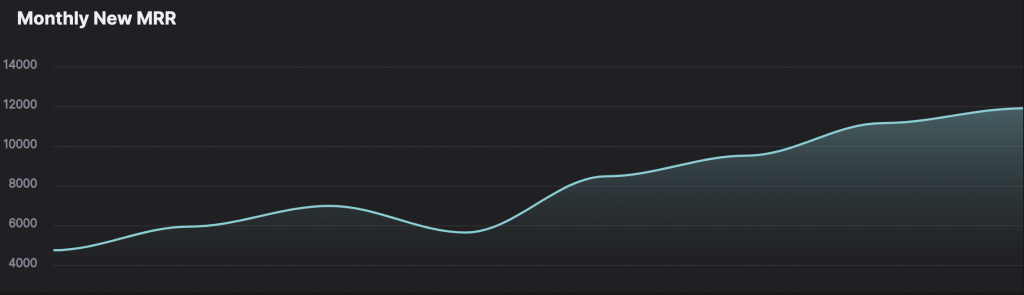
New MRR is the amount of MRR you will get from people who have become your new users that month. MRR is a calculation that covers all predictable revenue from your users that month, while new MRR focuses only on your new users. Having a high New MRR is a good thing because it indicates that you’re attracting new users and that you’ve managed to get more new users into your active users.
How to calculate the new MRR?
The new MRR formula is as follows:
New MRR = New users * MRR per new customer
For example, let’s say you acquired 15 new users last month. 7 of these 15 users made you $ 500 per month, and the remaining 8 earned $ 250. In this case, your total new MRR would be 7 * 500 + 8 * 250 = $5500.
The new MRR metric makes it easy to understand the clear new MRR metric. Churn and expansion MRRs are also included in the net new MRR calculation, allowing you to calculate a more precise MRR. The net new MRR formula is as follows:
Net New MRR = New MRR + Expansion MRR – Churned MRR
Why is the new MRR important?
New MRR gives you an insight into your business’s potential to generate revenue for new customers in the coming month. This way allows you to plan your growth and create roadmaps to put it into practice. In addition, New MRR is one of the metrics directly linked to customer lifetime value. Therefore, following your new MRR rate allows you to observe the value added to your company by your new active users who have made a first-time purchase of your company’s product.
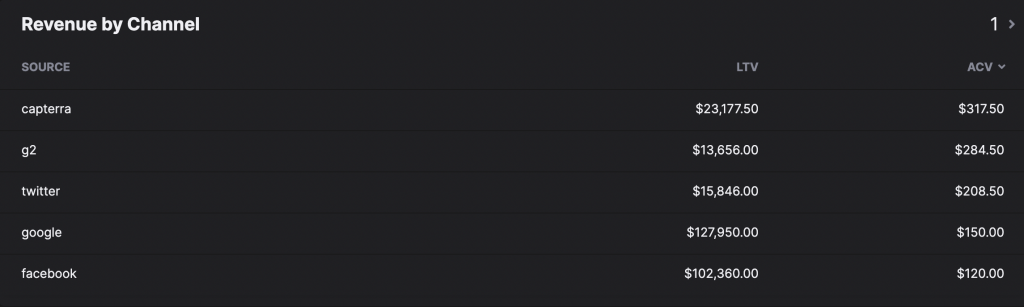
Revenue by Channel
Revenue by channel is a marketing attribution metric that allows you to measure which channels you generate more revenue from. Thanks to the data from this metric, you can measure which channel brings you more income and execute your strategies accordingly.
How to calculate revenue by channel?
There is no formula for revenue by channel. However you need a SaaS analytics tool that will connect your marketing data with revenue so that you can measure revenue by channel.
Payment Success Rate
The Payment success rate is a metric that shows how many payments attempts users for your product are successful. With this metric, you can notice how many of your users have stopped paying and how many have made a purchase.
How to calculate the payment success rate?
The payment success rate is calculated by dividing successful payments by all payment attempts. Its formula is as follows:
Payment Success Rate = Successful payments / All payment attempts
For example, if 100 users visited your payment page in February and 55 of these users made a purchase, your payment success rate in February is 55%.
Why is the payment success rate important?
The Payment success rate indicates how well you can persuade your particularly indecisive users to switch to a paid subscription. If you have a high payment success rate, your users are satisfied with your pricing options and what your paid product promises. Conversely, a low payment success rate may signify that you need to develop another way to persuade your users to buy. You may need to review your pricing or consider another actionable route in such a case.
Conclusion
All these metrics are invaluable for SaaS companies with a subscription-based business model. You need to monitor these metrics and observe their interaction with each other and create strategies accordingly. To run this system correctly, you will need a reliable analytics tool like Hockeystack. Thanks to Hockeystack, you can easily monitor these metrics and make the necessary improvements.
FAQ
The subscription business model is a recurring revenue model in which your users pay weekly, annually, or monthly for the product or service they will benefit from. Users pay again after the time they set. In this way, your customer relations allow you to create a more stable income stream.
In this business model, the users you retain are critical. The subscription business model does not operate with a single purchase. In other words, this model depends on you making a new payment for your product at the end of the specified period, for example, each month. Therefore, the high retention rate directly affects your success in this business model.
There are several metrics to measure a company’s performance, and each of them is very important to watch out for. However, a company’s profitability gives the most basic information about that company’s performance. In addition, the company must maintain its profits to survive and continue its business for the long haul. That’s why Profitability is the metric you should pay the most attention to when it comes to your company’s performance.


