Supermetrics Alternatives Your SaaS Should Try Out
With the introduction of technologies such as Supermetrics, it is now simpler than ever to automate all of your data into reports and dashboards. Supermetrics connects marketing data to the destinations on consumers’ data that they already have: a reporting tool, a spreadsheet, a data lake, or a data warehouse. Mikael Thuneberg founded it in 2013, and it does not provide a reporting tool of its own.
This article will list some alternatives that can meet your needs better instead of Supermetrics.
HockeyStack
HockeyStack is an end-to-end analytics and attribution tool for SaaS companies. With HockeyStack, you can monitor and analyze key metrics from various departments including marketing, revenue, sales, and product to understand what convinces your customers to convert. By unifying all of your data in one tool, HockeyStack also gives you the unique ability to get access to hidden insights, such as the LTV of a piece of content, or the churn rate of each marketing channel along with users’ reasons for churn.
With the no-code user interface and five-minute setup time, you can start analyzing your data immediately to gain actionable insights to maximize revenue.
HockeyStack’s Features
HockeyStack offers these features with no code:
- Step-by-step user journey to get greater visibility into customer interactions
- Custom dashboards to ensure that you’re getting all your data in one go
- Funnels and goals to track microconversions
- Attribution analysis to understand which channels are most effective in converting users
- Surveys to understand user perception regarding your product, onboarding, customer experience, and more
- Revenue analytics to gain a better understanding of your costs and revenue
- Segments to group your users together based on characteristics or demographics
and more
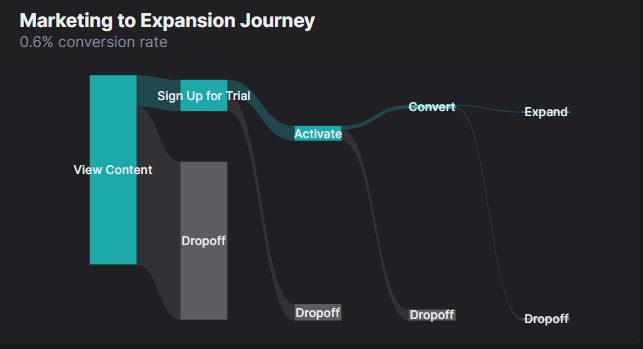
Here’s an example of how HockeyStack can consolidate both marketing data and revenue data to give you a complete breakdown of content pieces that generate the most MRR.

You can also get a complete user journey:
And even find out how internal linking affects conversions:
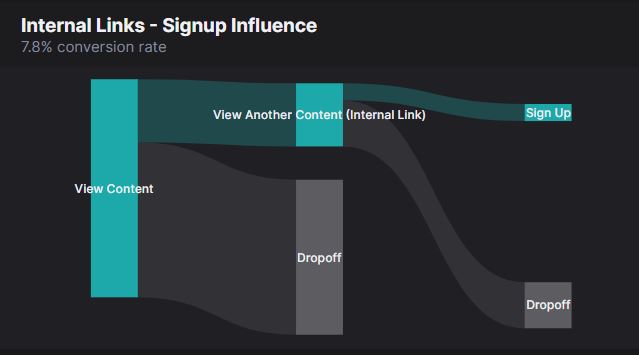
Essentially, you can get a complete picture of how successful your marketing efforts have been, helping you identify what to double down on and what can be improved.
HockeyStack Pricing
HockeyStack has two different plans, both of which have a 14-day trial with a 30-day refund guarantee.
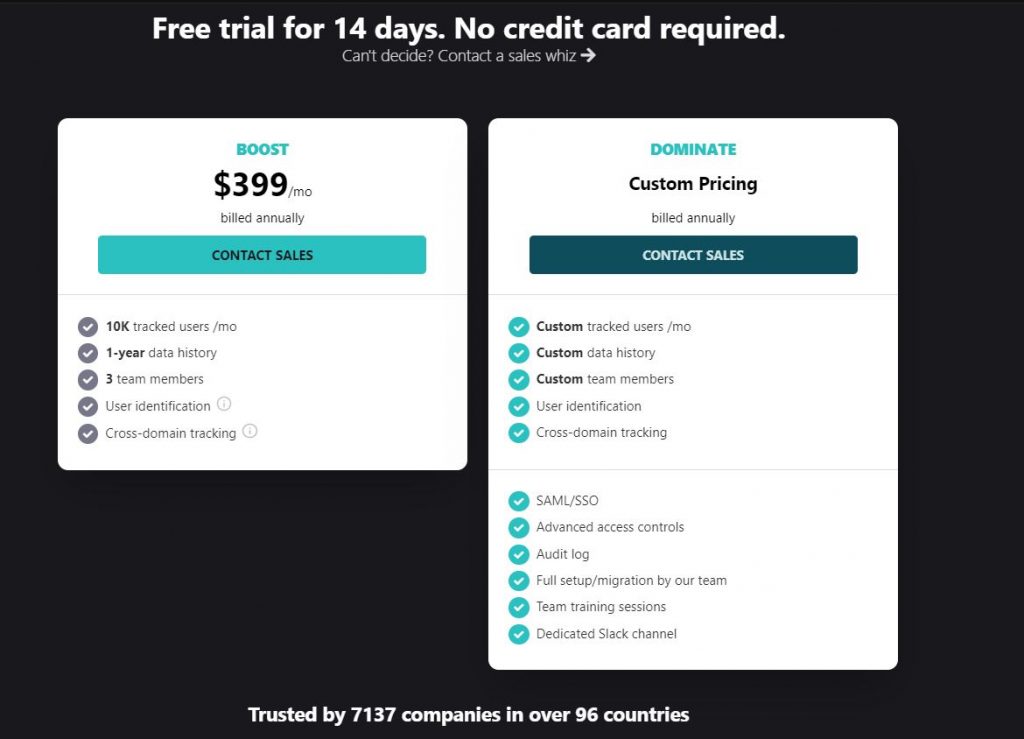
You can check out the pricing page here.
HockeyStack Integrations
- Paddle
- Stripe
- Hubspot
- Crisp Chat
- Salesforce
- Zapier (coming soon)
HockeyStack Pros and Cons
Here are some pros and cons of HockeyStack that will help you make an informed decision.
HockeyStack Pros
The unique benefit of HockeyStack is its ability to unify your marketing, revenue, sales, and product data using no code. This allows you to uncover unique insights that you wouldn’t be able to by using multiple tools as they cause you to have fragmented data.
- You can integrate with Stripe, Paddle, and Hubspot and build every single dashboard that you can think of, using all sales, marketing, revenue, and product metrics.
- You can create funnels, goals, and surveys, which are rare to get with other tools on this list.
- You don’t need any developers, tracking is cookieless, and the script is small, so it doesn’t increase your site loading time.
HockeyStack Cons
HockeyStack generally lacks reporting features as it’s not focused on agencies and other reporting-based businesses.
- HockeyStack doesn’t have weekly e-mail reports
- The tool lacks some integrations, such as Salesforce, Mailchimp, and Zapier. (which are on the roadmap)
Klipfolio
Klipfolio is a web-based dashboard platform that allows users to build real-time corporate dashboards. It enables you to connect to a range of data providers, automate data retrieval, and quickly and conveniently modify and display data. Klipfolio also includes a schema-less architecture, which allows non-technical end-users to connect to data sources more simply and separates data from presentation to allow for more efficient use and reuse of data sources throughout the platform. Klipfolio Inc. is a Canadian software company headquartered in Ottawa, Ontario, that was started in 2001 by Allan Wille.
Features
- Reports Interface
- Automodeling
- Suggested Results
- Interactive Dashboards
- Calculated Fields
- Customized Dashboards
- Data Discovery
- Collabration
- Workflow
- Integration API’s
Klipfolio vs. Supermetrics
- Klipfolio offers a diverse set of integrations. Within their platform, they have over 100 integrations. Supermetric, on the other hand, provides far fewer integrated tools but with superior usability and accuracy. It accepts more than 60 connections.
- Klipfolio is ideal for new-age firms, start-ups, and small businesses. It is rather pricey, and as a result, it does not have a large audience. Supermetrics, on the other hand, is excellent for start-ups, digital marketing firms, e-commerce businesses, and corporations that are very focused on digital components of marketing because it is less expensive than Klipfolio.
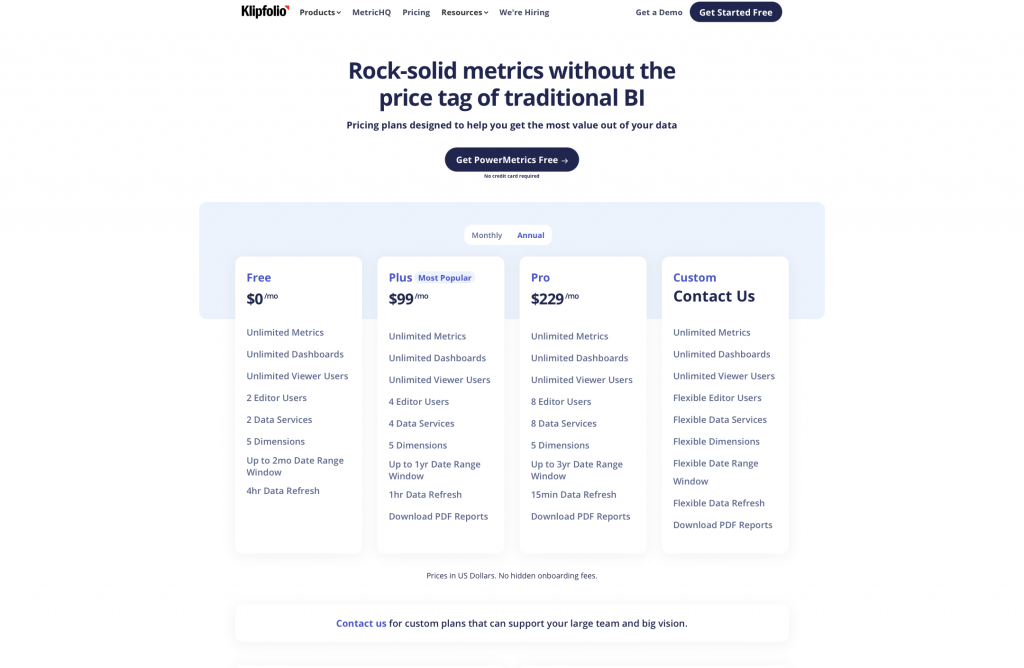
Pricing
Klipfolio offers four different monthly options as well as yearly plans. The four plans are priced as follows: $0/month, $99/month, $299/month, and custom plans.
Databox
Databox is a business software solution that centralizes all your data, allowing you to monitor performance and find insights in real-time. You may combine data from several sources in one dashboard to get a complete picture of your performance. Databox was founded in 2015. by Peter Caputa.
Features
- Graphs and Charts
- Prediction Analytica
- Dashboards
- Data Updates
- Historical Snapshots
- Real-Time Updating
- Email Reports
- Data Sources
- Dashboards
Check this article to read a more detailed comparison of Databox vs Klipfolio!
Databox vs Supermetrics
- Databox has its own reporting interface; unlike Supermetrics, they do not transfer the data elsewhere. The UI is completely customizable, making it extremely simple to link data and create dashboards.
- They provide additional integrations, such as Zapier, Pipedrive, Intercom, Asana, and Integromat, while Supermetrics does not.
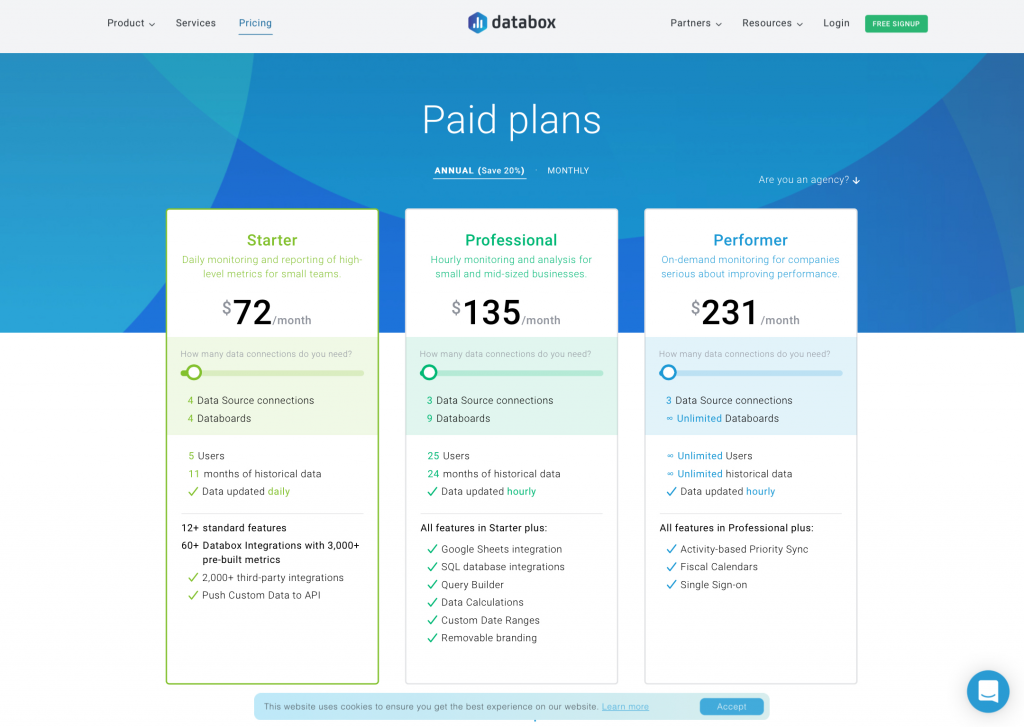
- Databox offers both free and paid options. different monthly options as well as yearly plans. Free Forever Plan allows you to benefit from 3 Data Source Connections,all standard features and 60+ Databox Integrations.
Pricing
There are three paid plans which are priced as it follows: $72/month, $ 135/month, $ 231/month. You need to pay extra for more databoards and data source connections you want.
Google Data Studio
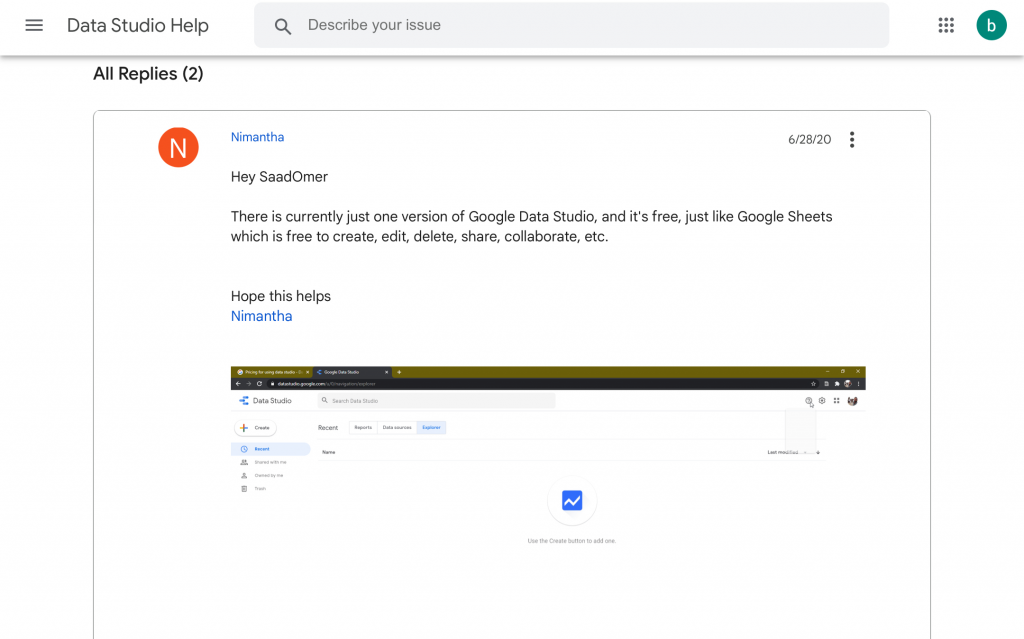
Google Data Studio is a web-based tool that was introduced by Google on March 15, 2016, as part of the business Google Analytics 360 package and as a component of Google’s Marketing Platform. In May 2016, Google released a free version of Data Studio for individuals and small businesses.
Features
- Reports Interface
- White Label
- Score Cards
- Historical Snapshot
- Email Reports
- Real-Time Updating
- Graphs and Charts
- Dashboards
Google Data Studio vs Supermetrics
- To use Supermetrics, you may be required to pay the fee of the plan you select. Google Data Studio, on the other hand, is available to everyone for free.
- Google Data Studio offers a variety of data connectivity choices; nevertheless, some users have claimed that particular data sources are more prone to failures. Although the majority of people prefer Supermetrics’ data sources.
- Google Data Studio requires a third-party software, despite having a highly straightforward interface. You must pay to have access to third-party connectors.
Pricing
Google Data Studio is free for all.
DashThis
DashThis is a digital marketing reporting solution that provides only the basic capabilities you want, with no misleading additional features.
They integrate with over 30+ data sources, and for anything else, there’s their handy CSV File Manager, which allows you to add any extra data you want to your dashboards. They are well-known for providing exceptional customer service. Stéphane Guérin founded DashThis in 2011.
Features
- Interface
- Steps to Answer
- Graphs and Charts
- Score Cards
- Spend Management
- Historical Snapshots
- Real-Time Updating
- Email Reports
DashThis vs Supermetrics
- DashThis is a great tool for creating visually appealing dashboards, but many users mistake it for Google Data Studio but far more sophisticated.
- It might be difficult to locate what you require at times. This is something to consider because having too much functionality leaves you unable to work, while not having enough causes you to return to Google Analytics.
- Some customers also experienced having to reload dashboards due to frozen widgets, and as a result preferred utilizing Supermetrics.
Pricing
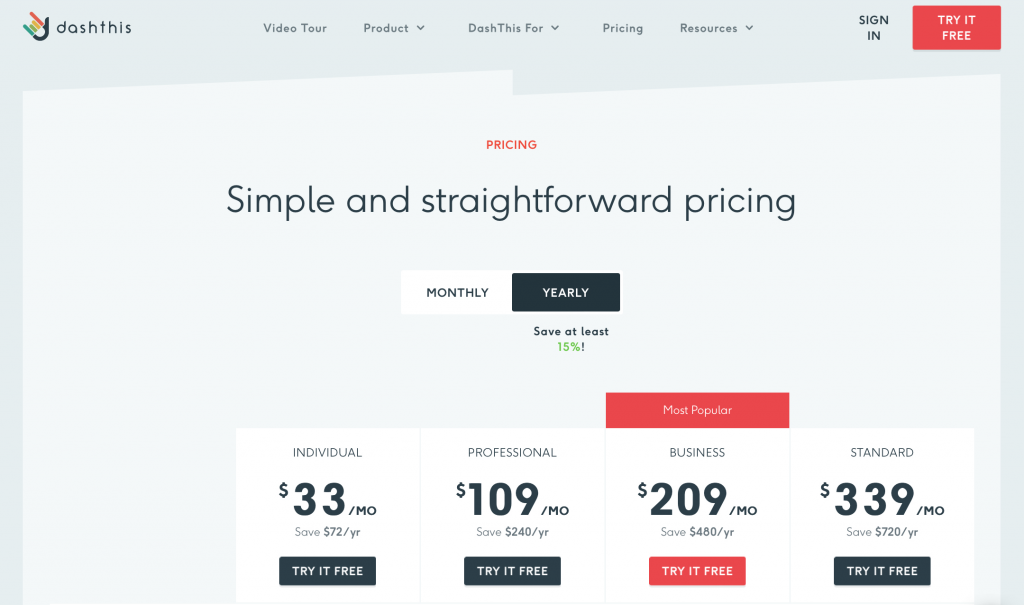
DashThis has four distinct plans to choose from. Individual, professional, business, and standard are the four types. Subscriptions can be paid on a monthly or annual basis if a discount is desired.
Cluvio
Cluvio is a tool for performing SQL queries against connected databases and displaying the results in interactive dashboards. For extra statistical analysis, the user can run a custom R query over SQL. It supports Amazon Redshift, Postgres, MySQL, and Amazon Aurora. Database connectivity is protected via SSH tunnels and firewall controls. The service complies with EU data protection regulations. It was started in 2015 by Ian Formanek and Marius Kirschke.
Features
- SQL Editor
- SQL Snippet
- Database
- Suggested Results
- Analytics to the Power of R
- Interactive Dashboards
- SQL Alerts
- Share Dashboards via Link
- Share Dashboards with your Colleagues
- Your data on the wall
Cluvio vs Supermetrics
- Supermetrics has three pricing tiers. Supermetrics can also be tried for free. It does not, however, provide a totally free version, unlike Cluvio.
- Cluvio is supported on Apple and Android while Supermetric is not.
- Cluvio provides live chat as well as support tickets, but Supertmetrics does not. Not sure what support tickets are? Check out this article.
Pricing
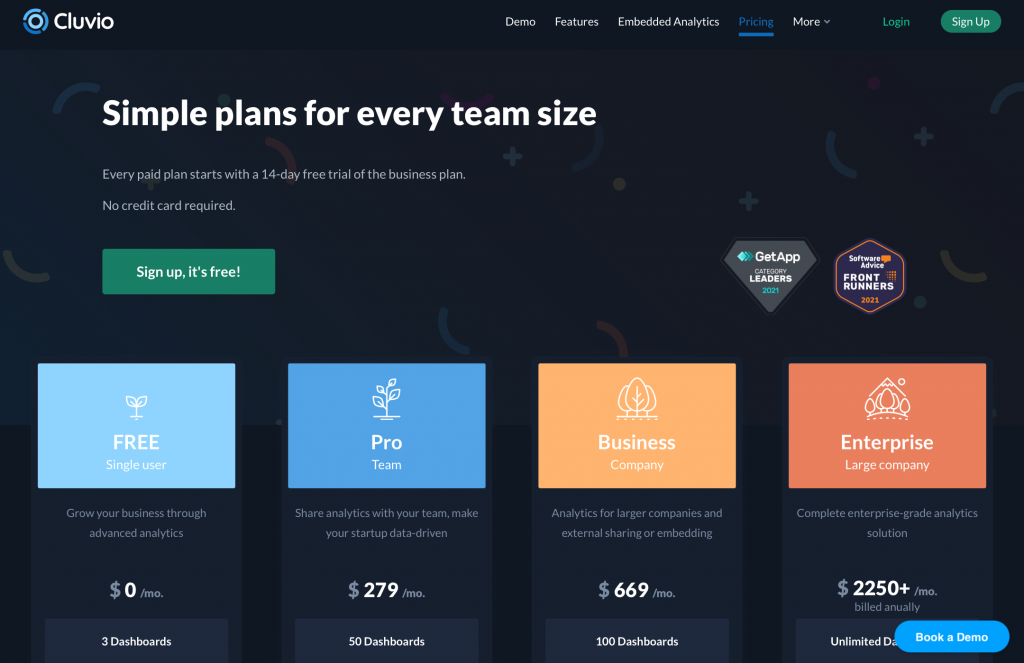
Cluvio has four price options. The first is a no-cost choice. There are three paid versions available: Pro, Business, and Enterprise.
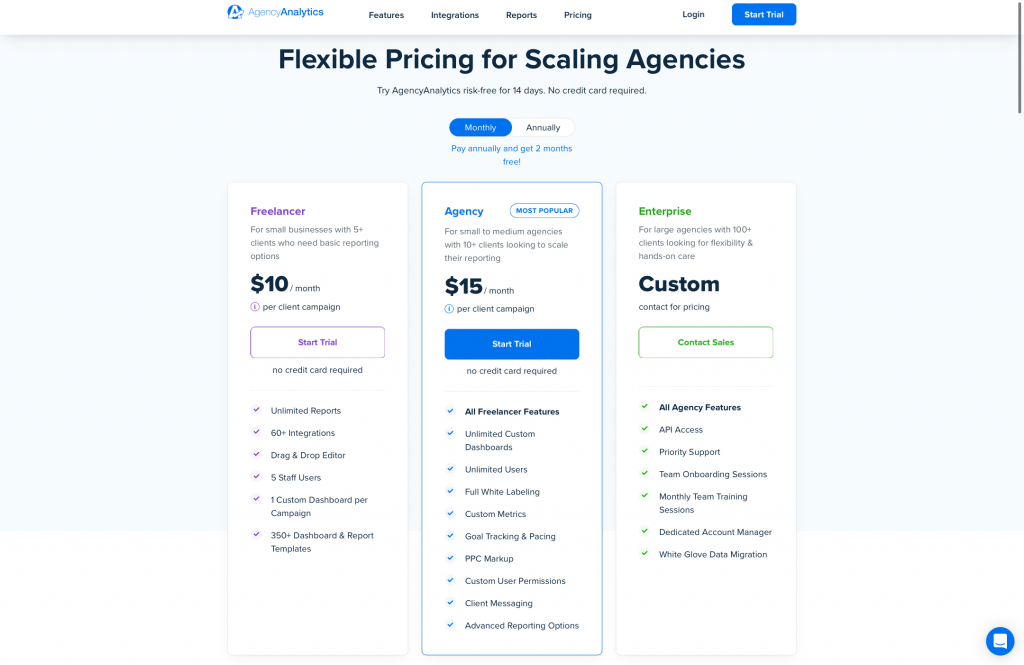
AgencyAnalytics
AgencyAnalytics is a marketing reporting tool that was initially designed for agencies. They provide analytical data and live marketing dashboards on a simple platform, allowing businesses to save time, earn more money. AgencyAnalytics integrates with over 60 platforms to evaluate and report on SEO, PPC, calls, social media, email marketing, and other operations. It was designed in 2010 by Joe Kindness.
Features
- ROI Tracking
- Data Collection
- Campaign Insights
- Reports and Dashboards
- Multichannel Tracking
- Link Building
- Keyword Research
- Rank Tracking
- Competitor Analysis
AgencyAnalytics vs Supermetrics
- AgencyAnalytics provides features like Keyword Rank Tracker, Site Auditor, Backlink Checker, Competitor Analysis while Supermetrics does not.
- The beginning price of AgencyAnalytics is lower than that of Supermetrics, making it a highly reasonable all-in-one internet marketing solution with very useable capabilities and built-in connectors with other software products.
| Features | AgencyAnalytics | Supermetrics |
| Starting Price | $10 | $49 |
| Free White Labeling | ✓ | X |
| Keyword Rank Tracker | ✓ | X |
| Drag&Drop Editor | ✓ | ✓ |
Pricing
AgencyAnalytics offers three price variants, the first of which is free. AgencyAnalytics is also available for a free trial.
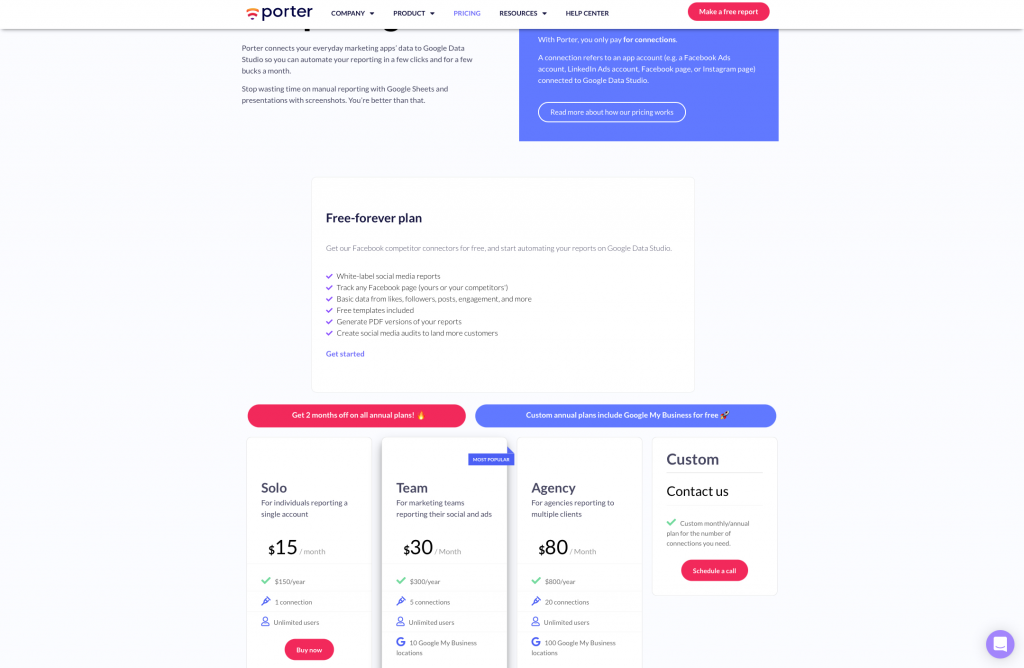
Porter
Porter is a business intelligence tool that uses Google Data Studio templates to automate marketing reports. It does not require any coding and is mostly applicable to Facebook (ads and organic) and Instagram. It is commonly used by marketing teams and agencies. It is founded in 2018 by Juan Bello.
Features
- Dashboard
- Custom Dashboard
- Reporting
- Analytics
- KPI’s
- Visual Discovery
Porter vs Supermetrics
- Porter can be integrated with more than 10 apps, including Facebook Ads, Facebook Insights, Instagram Insights, LinkedIn Ads, and Shopify. However, Supermetrics integrates with approximately 70 different systems, including CRM, social networking, advertising, and payment platforms.
- The pricing methods differ significantly between Porter and Supermetrics. Supermetrics charges a fee dependent on the number of data sources that are linked. Porter, on the other hand, charges by the connection, regardless of data source. That is, you get charged according on the number of accounts you have. As a consequence, you only pay for the accounts you use in Porter. Unlike Supermetrics, you would pay a different charge if you connected one vs ten Shopify stores.
Pricing
Porter price begins at $15.00 per month, per user. There is no free version available. However, Porter provides a free trial.
Conclusion
There are various Supermetics alternatives on the market. Even though several of them appear to be identical at first look, each one might serve a completely different purpose. Some of the tools on this list may be appropriate for bigger organizations with a broad variety of data sources and visualization needs, while others may be appropriate for smaller agencies looking for an easy-to-use tool.
Whatever your individual scenario and goals are, this article can guide you in selecting the best tool to employ.
Supermetrics is good for assisting marketers in better reporting, analyzing, and monitoring their data by linking marketing platforms to anywhere they wish to use the data.
There is a free version of Supermetrics, but it just allows you to connect Sheets to Google Analytics. Payment is required for more features. However, Supermetrics also provides a 14-day free trial of all of its products.


