The Most Important SaaS Metrics
Data from a recent report shows that the SaaS market grows by 18% each year. Although the market is growing quite rapidly, achieving sustainable growth is still challenging for SaaS companies. Since the competition is increasing at an unprecedented rate, it’s extremely important to keep track of certain metrics that will help you make the right changes to maximize retention and increase revenue.
So, what are these metrics and how should you measure them? Well, that’s what we’re talking about in this article.
Without further ado, let’s begin!
Monthly Recurring Revenue (MRR)
What is Monthly Recurring Revenue (MRR)?
Monthly Recurring Revenue, or MRR, is a metric representing the predictable revenue that a business is expected to earn each month. SaaS and subscription-based companies generally prefer to work on a monthly subscription basis, relying on the MMR value to monitor cash flow.
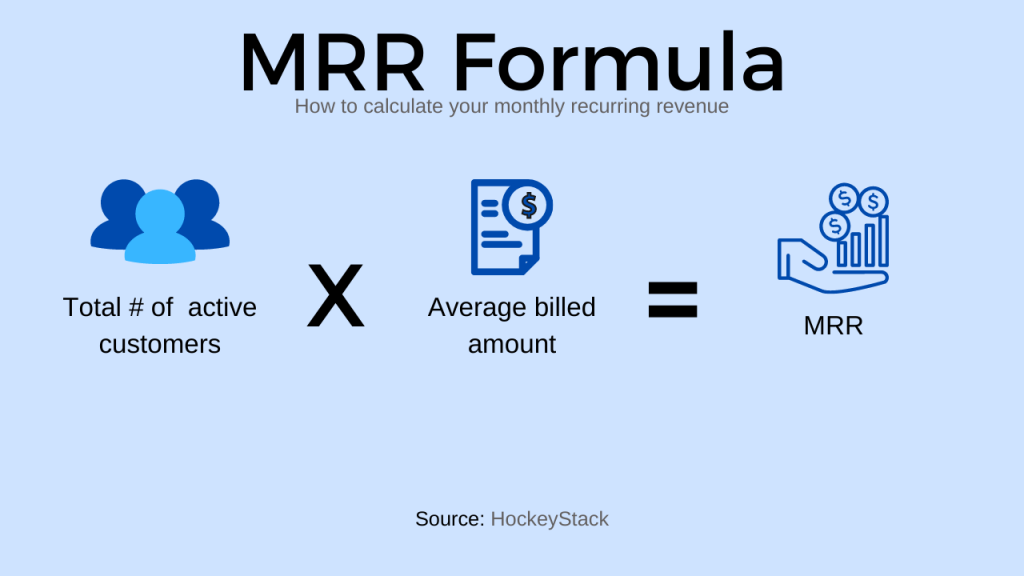
How to Calculate MRR
To calculate MRR, you can use the formula given in the image below:
Why is measuring MRR important?
The SaaS business model is based on recurring payments. It is, therefore, convenient to track and predict MRR. MRR is an essential metric for evaluating your SaaS business’s growth rate and success. Measuring this metric allows you to get information about success in reaching new customers, the extent of customer retention, and cash flow. This allows you to create well thought-out plans to improve the chances of gaining and retaining customers. Examining the numbers on the back of the MRR provides more detailed information about the sales process and an insight into increasing revenue.
Feature Engagement
What is Feature Engagement?
Future engagement is a metric that indicates how much users engage and interact with your product’s features. It is normal to expect the benefits of creating a feature in your company since you put your effort and time into making it. Finding the return of this effort and time depends on users adopting these features.
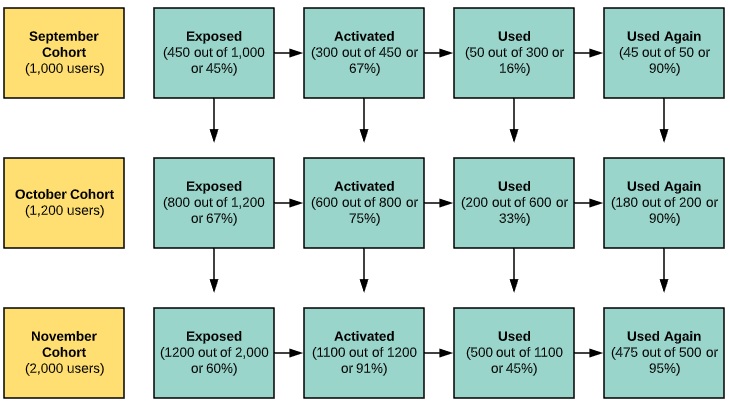
How to Calculate Feature Engagement
The first step is to track the level of engagement. Afterward, you can segment your users in 4 different categories based on how frequently they use the feature:
- Exposed: Users that are aware that the feature exists.
- Activated: Users that tested the feature.
- Used: Users that used the feature after trying it.
- Used again: Users that kept using the feature a number of times.
Why is Measuring Feature Engagement Important?
Feature engagement is an essential metric for the following reasons:
- It shows how well your target audience responds to the features of your product.
- It gives you an idea of how much and how well your features are marketed to users.
- A good feature engagement rate coupled with a well thought-out feature adoption strategy can help you reduce retain rate.
Revenue by Source
What is Revenue by Source?
Revenue attribution is one of the most important SaaS metrics that you need to calculate to expand and grow. Revenue by channel is a metric that identifies and measures the source of revenue.
How to Calculate Revenue by Source
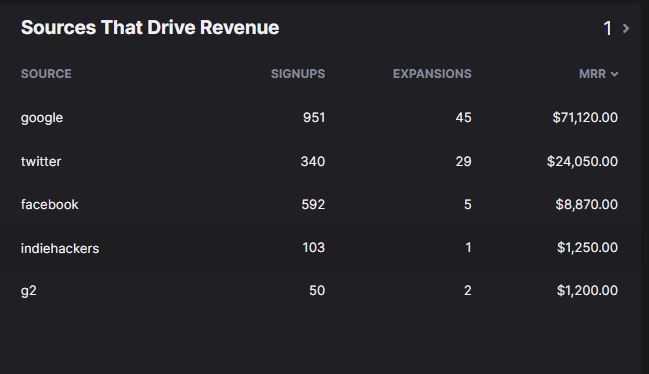
Using an analytics tool such as HockeyStack can help you track your revenue by attribution and find out your most profitable channels. Let’s take a look at HockeyStack’s dashboard in action:
Why is Calculating Revenue by Source Important?
The screenshot above shows the source of users, the number of signups and expansions, and the MRR of each channel. With this information, you can focus on the channels that are most lucrative for your business and develop strategies to make less profitable channels perform better.
There’s also another benefit of viewing all of this information together on a single dashboard. As shown in the screenshot above, Twitter may have a lower number of signups than Facebook, however, since the number of expansions is higher, so is the MRR of Twitter. This proves that it’s not enough to take independent numbers at face value and that it’s important to view the whole picture together.
NPS
What is NPS?
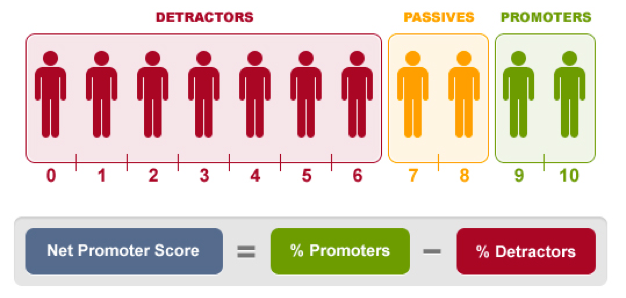
NPS is a metric that’s used to measure the positive impact of the recommendations of your company. A simple and common question to assess NPS is: “On a scale of one to ten, how likely are you to recommend our products?” In light of the answers given, customers are divided into three groups: promoters, passives, and detractors.
How to Calculate NPS
Detractors are customers who answered 0-6 and are less likely to recommend the product to their friends or family. Passives are the ones who vote 7-8, and they are using the promotion but remaining passive in terms of suggesting your product to others. Promoters, who score 9-10, are the loyal and enthusiastic customers likely to promote your product.
The formula used to calculate NPS is relatively simple. All you need to do is subtract the percentage of detractors from the percentage of promoters. So:
Promoters% – Detractors%
The NPS score varies from company to company and industry to industry but any score higher than 40 is considered a solid positive score. In SaaS companies, the average NPS in 2022 is 41. The number of passives is not included in the formula, but still, the percentage they hold is vital since there is an opportunity for you to convert them into promoters over time.
Why is Measuring NPS Important?
As Seth Godin said: “The secret to marketing success is no secret: Word of mouth is all that matters.”. And how can you calculate to what extent “word of mouth” benefits your business? NPS is the answer. NPS is a simple yet great metric to see directly how satisfied your customers are with your service. It is also a helpful metric for reducing the customer churn rate and ensuring growth.
Churn Rate
What is Churn Rate?
Retaining customers is as important as winning them. While it’s impossible for you to keep all the customers, it’s extremely critical for you to put some thought into retention strategies. Customer churn rate is the rate that shows the customers that are no longer willing to do business with you. The average annual churn rate for a SaaS company can vary between 32 and 50% depending on the product, so, you should ideally keep your churn rate below these numbers.
How to Calculate Churn Rate
The formula for calculating churn rate is far from complicated.
Customer churn rate = Customer beginning of a specific period – Customers end of a certain period / Customers beginning of a specific period
The critical point here is to use the right analytics tool and track your churn rate more efficiently. You can use HockeyStack to build a comprehensive churn dashboard and identify how your churn rate changes with time.
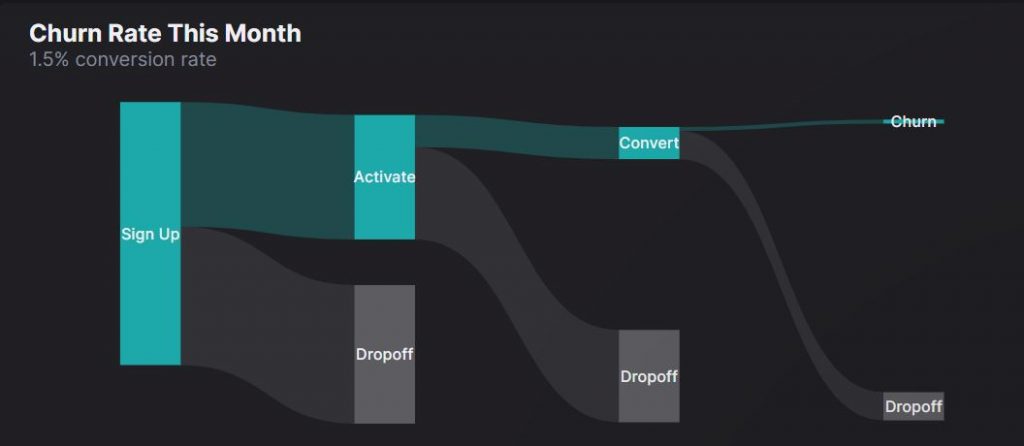
The screenshot from HockeyStack above shows how many users decided to stop proceeding to each stage of the sales funnel, allowing you to understand which stages you need to optimize for best results.
Why is Measuring Churn Rate Important?
The main reason is that customer churn rate is the metric that directly reflects revenue. By measuring the customer churn rate, you can find a numerical value for the customers you lost, find out why you are having trouble keeping customers, and find solutions to fix the addressed issues.
Daily/Monthly Active Users
What are Daily/Monthly Active Users?
Daily active users/monthly active users is another one of the most important SaaS metrics. This ratio denotes “stickiness” of your customers to your products. This ratio shows how long your customers will use your products. High stickiness is a hint that your service is engaging and valuable.
How to Calculate Daily/Monthly Active Users
To calculate stickiness, you must state two primary metrics:
- Daily Active Users (DAU): The number of your customers that use your product everyday
- Monthly Active Users (MAU): The number of your customers that use your product evert month
You can see the calculation of stickiness in detail in the image below:

The average daily/monthly active users are 13% in the SaaS industry.
Why is Measuring DAU/MAU Important?
DAU/MAU ratio shows how active your product is. It is an essential metric for predicting your potential earnings in the early stages of your business. It also helps you understand how satisfied users are with your product and can give you insight into how many of these users you’ll be able to retain.
High DAU/MAU has some advantages, such as:
- Reducing churn
- Making it easier to offer upgrades
- Leveraging word-of-mouth marketing
- Increasing LTV
ARPU
What is ARPU?
Average Revenue per User (ARPU) aims to determine the revenue from each customer. If you wonder what a customer is worth to you, this is the metric to look at. Here, ARPU helps you determine the upper limit of expenses for your business. If the potential to earn is low, you would not want to invest considerable amounts.
How to Calculate ARPU
ARPU can be calculated by dividing the total revenue by the number of customers.
The formula is: ARPU: Total Revenue/Total Number of Customers
Here, it’s imperative to take anything that drives revenue into consideration including:
- Upsells
- Cross-sells
- MRR or ARR
- Fresh purchases
- Lost MMR (from churn)
- Total paying customers
Inactive or free customers and free items should not be included in the calculation as they do not generate revenue.
Why is it Important?
ARPU is an important metric for measuring the level of engagement customers have with your products. ARPU is also a suitable metric for your SaaS business. It provides a forecast of your future earnings, offers an opportunity to evaluate your market channels, and gives an idea about how to set pricing.
Generally, a high ARPU is a good thing. Still, other metrics such as customer churn rate (CCR) and customer acquisition cost (CAC) should also be taken into account to draw a better picture of your overall success.
LTV
What is LTV?
LTV is the amount your customer is expected to spend on your business. How long each customer wants to do business with you and the profit they will bring to you differs. With LTV, you can measure how important a customer is to you over time.
How to Calculate CLV
The formula needed to find the CLV is: (Average Purchase Value x Average # of Purchases x Average Customer Lifespan)
The formula to find Average Purchase Value (APV) is Total Revenue/Number of Orders.
You can find CLV and shape your growth strategies with these formulas.
Why is it Important?
Acquiring new customers must be an important goal for your business. However, retaining existing customers is just as important because retaining engaged customers is much easier and less costly than acquiring new customers.
Identifying your loyal customers and increasing their CLV instead of wasting your business’s precious advertising budget makes sense. CLV helps you follow the proper marketing methods to increase loyal customers, determine an ideal customer profile, and better understand the financial return of your investments in the long and short term.
Activation Rate
What is Activation Rate?
User activation is the second of the 5 pirate metrics , called AARRR, which Dave McClure introduced.
The moment of activation is the moment when the user gets an idea of the value of your product and makes the first move. So, you can say that making a purchase or signing up for your tool after the trial version is the moment of activation. The activation rate is a metric that reveals how many users have reached the specified activation moment.

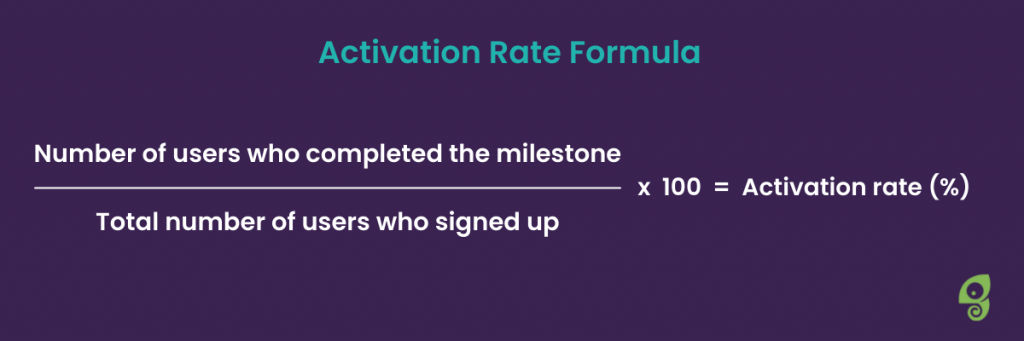
How to Calculate Activation Rate
Activation rate is the ratio of the users that reached an activation point ito then a total number of users. The formula to calculate activation rate is shown in the image below:
Why is it Important?
Of course, it is positive that your free trial service is preferred, but the important thing is how many of these free trials turn into regular customers. The activation rate shows how many users are able to identify the actual value of your product and how many users want to go beyond the trial version.
A low activation rate indicates that customers are not deeply committed to your business and that your offering is not too attractive to them. At this point, you should take a look at both your marketing strategies and the features of the product to understand why users aren’t too convinced.
CAC
What is CAC?
Customer Acquisition Cost (CAC) is the average total cost of acquiring a new customer. A low value indicates that your business is doing good in general. However, the CAC value can be affected by many parameters; some of them are:
- Conversion rate
- Duration of the sales
- Pricing and promotions
- Customer lifespan
One of the factors that most affect the CAC value is your company’s sector. The average CAC of SaaS companies is $205.
How to Calculate CAC
To calculate the CAC, all expenses incurred in acquiring new customers are divided by the number of customers. You can view the formula in the image below:

Although there is no fixed rule, some expenses should not be included in the CAC calculation. For example:
1) Research and development
2) Churn
3) Customer Success
Why is it Important?
Keeping CAC low is a requirement in almost every industry. However, the CAC value becomes even more critical as the SaaS industry is based on the customer’s lifetime value. CAC is the reflection of the future success of your business. CAC is also used to calculate the LTV/CAC ratio, an important parameter. The customer acquisition cost is important in determining how effective market strategies are.
Conclusion
The SaaS industry is growing day by day, and it is still among the most unpredictable industries. Getting a better picture of your business is more important than ever. Choosing the right metrics will help you make more constructive decisions about your business and achieve healthy growth.
The ten most important SaaS metrics I have listed in this article are the most suitable for the needs of SaaS businesses. You can use these metrics to better understand how your customers perceive your products, what improvements you can make, and get a good idea of how profitable your business can be in the months and years to come.
FAQ
What is the Rule of 40?
The Rule of 40 is a SaaS financial ratio that only requires two inputs: growth and profit margin. It is a straightforward metric that measures the attractiveness of a business by combining two strong indicators of a business’s success. According to the Rule of 40 principle, adding the growth and gross margin percentages should give you a result that’s higher than 40.
If your profit margin is 25% and your sales growth is 17.5%, your rule of 40 number is calculated as 42.5%. (25%+17.5%) Your company can be considered “attractive” since your rule of 40 number is above the 40% mark.
What is the difference between MRR and ARR?
ARR is the amount of recurring revenue from annual subscriptions, while MRR is a metric that represents monthly recurring revenue. SaaS businesses tend to work on a monthly subscription basis, and they utilize MRR to monitor cash flow. B2B companies prefer ARR since it is based on annual subscriptions. ARR can still be used to review the annual financial position.
To calculate ARR by MRR, you can use this formula: ARR = MRR x 12


