Top 10 SaaS Onboarding Metrics That You Don’t Track
70% of customers state that understanding how they use products and services is vital for purchasing decisions. For SaaS companies, the onboarding process is the essential phase in the customer journey that helps customers understand how they can benefit from the product to achieve their goals. A good onboarding will keep customers engaged, increase adoption, and reduce churn.
There are some essential SaaS onboarding metrics to track to measure onboarding success.
Keep reading to learn more about these metrics, why they are important, and how you can calculate them.
Time to Value
Time to Value (TTV) is a metric that measures how much time it takes for a customer to realize the value of your product.
There are different ways in which TTV can be measured. Here’s a list of them:
- Time to basic value
After using some basic features that you offer, the customer begins to see some value from your product. This is time to basic value or the time it takes for a customer to extract the minimal amount of value. It’s not necessary that the customer pays before receiving basic value; it can also happen on a free trial.
2. Time to exceed value
This is the time it takes for customers to see benefits from your product that they hadn’t realized before. It’s also when they get convinced to continue using your product. This often happens before the end of a trial.
3. Long time to value
Sometimes, it takes a long time for the customer to get value from your product. This is not necessarily a bad thing; it can happen because of the nature of the product. Maybe the onboarding process is slow, or the customer needs custom integrations. In any case, however, a long time to value can lead to customer impatience and frustration.
4. Short time to value
This is when it takes a short time for the customer to realize the value of your product. Having a short time to value is great for SaaS businesses, but it also leaves customers with high expectations.
5. Immediate time to value
This is when the customer gets value from your product right away. A website speed test is an example of a product with a short time to value. You enter your domain name and immediately get data on how users experience your site.
Why is Time to Value Important?
For SaaS companies, customers must realize the value of a product as soon as possible. Otherwise, it won’t be long before they churn and start looking for alternatives.
If your TTV value is low, it indicates that customers get a quick return on their investment, increasing the chances that they will continue to purchase from you.
It is best to avoid a high value of TTV not only for the apparent reason that it will drive customers away but also to have a good reputation as a company; being known to have a low TTV indicates that your SaaS quickly addresses the problems that customers are facing.
How to Calculate Time to Value
For every business, “value” might refer to something different. For example, the TTV of Dropbox is measured by the amount of time it takes for a customer to add a file to their shared folder.
So the first thing you need to do to calculate this metric is define what you mean by value. This can be the time it takes a customer to:
- Start using new features
- Upgrade from a free to paid version
- Achieve their desired ROI
It can also be another specific action that you defined.
Once you know what actions indicate value for your business, you can measure the time it takes for customers to perform those actions.
Time to Aha Moment
The “Aha moment” is an emotional reaction that the customer has when they first realize the value of your product or become convinced that your product provides a solution to a specific pain point they might have. You can think of this as the moment of realizing basic value in the TTV metric.
This moment isn’t easy to define since it’s subjective and can be different for you and your users. For example, for Netflix, if users find something to watch within the first 30-90 seconds, they’ve experienced the “Aha moment.”
The time to “Aha moment” is the time it takes for users to experience this moment.
Why is Time to Aha Moment Important?
Although the “Aha moment” can happen at different parts of the customer life cycle, it usually occurs during onboarding. The quicker the user experiences this moment in the onboarding process, the faster they see the value, and the more likely they will continue using your product.
How to Calculate Time to Value Aha Moment
To calculate this metric, you should first find your product’s “Aha moment.” The best way to do this is to listen to users who have been using your product for a while since they probably already experienced at least one of these moments.
By talking to many users about their experiences, you can start to notice patterns in what made them decide to stick with your product. Then you can measure the time it takes for users to experience these moments.
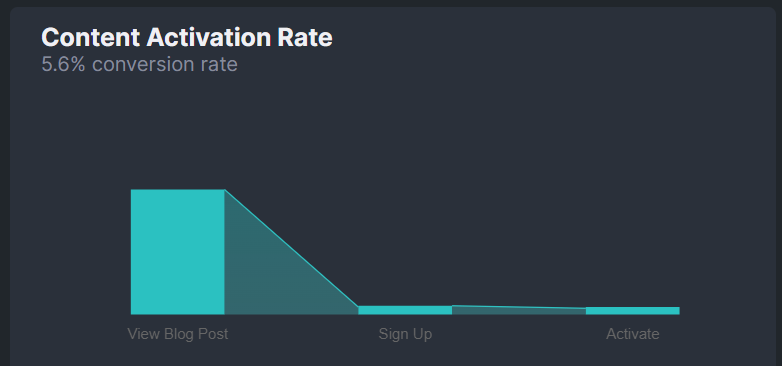
Activation Rate
User activation is the second stage in a set of five metrics known as the pirate metrics or AARRR. Activation happens when a user performs a key action known to deliver value. This action defines the point of activation. It can be:
- Creating a profile on a social media app
- Adding to a playlist on a streaming platform
- Signing up for a free trial and receiving benefits
Or anything the customer does that encourages them to continue using your product.
What makes activation different from the “aha moment” is that besides simply realizing value from your product, the user performs a key action and sees a benefit as a result of that action.
Activation rate shows how long it takes after signup for a user to perform a key action.
Why is Activation Rate Important?
Activation rate shows the effectiveness of your onboarding. If users don’t reach the point of activation, they don’t receive the value that comes with an action. And if they don’t receive value, there isn’t much they can do with your product, so they will simply quit.
If you have a low activation rate, it could indicate that users are dropping off somewhere in the onboarding process, which gives an opportunity to make changes. You can track and improve your product activation using various strategies and metrics.
Activation also has a direct impact on revenue. Among the pirate metrics, activation affects MRR the most in a 12-month period:
How to Calculate Activation Rate
To find the activation rate, you first need to define the points of activation. Then find the number of users who reached a point of activation and use the formula:
Activation rate = (# of users who reached a point of activation/ total number of users who signed up) * 100
Upsell Rate
Upselling is selling a higher package to an existing customer. This is different from cross-selling, which is selling a customer additional complementary products.
Upsell rate measures the number of upsell attempts you made that have been successful.
Why is Upsell Rate Important?
Since upselling is directed at existing customers, it’s an easier way to increase revenue than methods used to acquire new customers.
Moreover, the more upsells, the more profit you make from each customer, which increases your average revenue per user (ARPU). Since ARPU is directly proportional to customer lifetime value (LTV), this also increases customer lifetime value. At the same time, with higher LTV, the churn rate is reduced.
How to Calculate Upsell Rate
Upsell Rate = (total successful upsells you have made in a period/total attempts at upselling you have made during that period) * 100
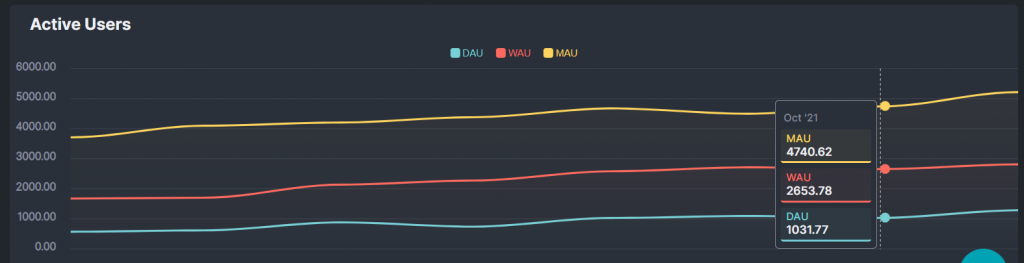
Monthly Active Users
Monthly active users is a product analytics metric that shows you the number of unique users that have interacted with your product over a month.
For this metric to be effective, you should determine the action that defines an active user. For one business, this may simply mean a visit to the site, while for another, it may mean engagement with a particular feature.
Why is Monthly Active Users Important?
The main purpose of MAU is to show user engagement in a given month, but it also directly affects many other metrics, including churn rate, retention rate, revenue, LTV, and o
thers.
MAU is also an indicator of business growth. An increasing MAU gives investors the impression that you have more new and repeat users by every passing month, which increases the chances of receiving funding for your business.
How to Calculate Monthly Active Users
Once you determine what an active user means for your business, you can measure how many of them you have over a given month. Note that the action should be based on unique visitors, no matter how many actions a unique visitor performs on the site.
NPS
NPS stands for Net Promoter Score. It’s a simple yet effective product success metric that measures customer experience. It is found by asking customers a question like: “On a scale of 1 to 10, how likely are you to recommend this product to friends and family?”
The answers are then categorized into groups in the following way to find the number of customers who are the most and least satisfied:
- Promoters (9-10): happy and loyal customers who are likely to recommend your business
- Passives (7-8): satisfied customers who are neither likely to recommend your business nor spread negative word-of-mouth
- Detractors (0-6): unhappy customers who may recommend against your business

We have a free survey tool that you can use to create NPS surveys. Check it out!
Why is NPS Imporant?
A good NPS value indicates high customer satisfaction and a higher chance that customers will recommend your business to others. Since recommendations from friends and family are the most effective way a business gets promoted, NPS can be used as an indication of the potential growth of your business.
NPS is also a great metric to compare customer satisfaction with competitors in the same industry.
To access the full value of NPS, however, it should be accompanied by a question that asks the customer the specific reason for their rating. Analyzing the negative feedback from this additional question can help you identify areas of improvement and reduce potential churn. The positive results can be used to increase referrals and shared on social platforms to increase trust among potential customers.
How to Calculate NPS
To find NPS, simply subtract the percentage of detractors from the percentage of promoters.
The NPS score will range from -100 to 100. Anything above 0 indicates you have more promoters than detractors. The closer it is to 100, the better.
Trial to Paid Conversion Rate
Trial to conversion rate shows the number of users who converted to a paid subscription from a free trial.
Free trials are an important part of the onboarding process that allows potential customers to test your product for themselves and determine if it is suitable for them. There are different types of free trials you can offer.
Opt-in free trials don’t require credit card payment before signup, and the user can choose to continue by making a payment when the trial period ends. On the other hand, opt-out trials require credit card payment before signup and automatically get renewed when the trial period is over. The conversion rate with an opt-out trial tends to be higher since the leads that sign up for it are high-quality leads.
Free trials are also differentiated by their features; some give full access to features, while others offer only limited features.
The free trial period for a SaaS can range from a week to 2 months, the most optimal being 14 days.
Why is Trial to Paid Conversion Rate Important?
The ultimate goal of a free trial is to convert users into paying customers. Some reasons for a low trial to conversion rate may be that:
- your product doesn’t meet users’ expectations
- users didn’t receive the full value of the product
- your product tour is long and uninteresting
- your point of activation is not clear
The trial to conversion rate can differ for each business based on industry, product, and type of trial.
How to Calculate Trial to Paid Conversion Rate
Trial to Paid Conversion Rate = (# of trial users in a period who converted / total # of trial users in that period)
Onboarding Completion Time
This is the time it takes users to complete the onboarding process. There isn’t a set figure for the best completion time since it will vary from one business to another. However, as a general principle, it’s best to keep this process short and simple.
Why is Onboarding Completion Time Important?
The completion time can give you an idea of how good your onboarding is. A high completion time can indicate that it is slow and complicated. This will result in lower customer satisfaction. A completion time that is too low can also suggest that users are moving too fast and don’t receive all the information they should during the process.
How to Calculate Onboarding Completion Time
You can define the beginning of the onboarding process by the customer’s first interaction with your product and the end of the process by the point at which the customer can independently use your product. Then calculate the number of days it takes from the beginning to the end of this phase.
Usage Time
Usage time is one of the product usage metrics that help you analyze how users engage with your product. It shows how much time users spend interacting with your product, whether you choose to calculate it daily, weekly, or monthly.
Why is Usage Time Important?
The amount of time users spend on your product gives a straightforward indication of user engagement. Generally, if this number is high, it’s a good sign since it means that you can keep users’ attention for long. However, if accessibility and speed are among the main promises of your product, then too much time spent in usage may not be a great indication.
How to Calculate Usage Time
To find the usage time, you can use users sessions. Find the number of sessions based on the period you want to calculate them: per day, week, or month. Then measure how long these sessions lasted and the overall time spent on them.
Feature Engagement
Feature engagement measures how much users interact with a particular feature over a period of time. There are different feature metrics you can use to track engagement:
- Feature stickiness shows the features that provide the most value to users.
- Feature retention tells you which metrics are the ones that customers keep returning to time after time
- Undiscovered features show you the features with the lowest amount of engagement
Why is Feature Engagement Important?
By measuring feature engagement, you can know what features users interact with the most and least. This will give you an idea of average performing features you should improve and low performing features that you may eliminate. Making changes as such will help you improve feature engagement.
How to Calculate Feature Engagement
One way to find feature engagement is by the formula:
Feature Engagement = (# of users of a feature in a given period/ # of user logins in that period)
Retention Rate
Retention rate is one of the most important customer retention metrics. It shows the number of users who continue using your product over a period of time. These users resubscribe to your service and continue to provide you MRR.

Retention rate is the opposite of churn rate, which is the number of users that stop using your service over a time period. You can calculate the retention rate on a weekly, monthly, quarterly, or yearly basis.
Why is Retention Rate Important?
Measuring retention is one of the best ways to understand how customers feel about using your product over an extended period. A healthy relationship with customers will result in a high retention rate and increase revenue.
A high retention rate can also increase your confidence when making investments in your business, making it easier to align your product, budget, and team with your future goals.
However, retention rate isn’t a stand-alone metric; it is best measured alongside churn rate. When you also know how many users stop using your product, you will have a clearer picture of how good your retention rate is.
How to Calculate Retention Rate
Retention Rate = ((# of customers at the end of a period – # of customers acquired over the period)/(# of customers at the beginning of the period)) * 100
Conclusion
The onboarding process for SaaS is a critical stage that should deliver value to users and guide them along with the product. However, there are many things to consider for an effective onboarding strategy, and it can be challenging to understand if your efforts are paying off. By tracking the SaaS onboarding metrics above, you can gain awareness into what is and isn’t working with your onboarding and make improvements to increase your users’ satisfaction and make them want to stay for long.
FAQ
Onboarding is essential for SaaS since onboarding starts with the user’s first interaction with your product, and the first impression will set the tone of the customer’s relationship with your business.
User onboarding software is designed to guide customers on the features of a product and help them understand and derive value from the product quickly.
Interacting with customers to receive their feedback and tracking the metrics listed above will help you measure the success of your onboarding.


