What is Sales Analytics and How to Get Started
The more data you have on your sales pipeline, the better decisions your sales team can make, and the more leads through the different stages in the buyer’s journey.
In this guide, I’ll show you all you need to know about sales analytics: why it matters, the benefits of using sales analytics, and key metrics to monitor on your sales analytics dashboard.
Let’s dive in.
What is Sales Analytics?
Sales analytics is the name for the process of analyzing your sales data and metrics to spot key trends, understand performance, and improve your overall sales performance.
Today, the best sales teams look to their sales analytics to inform almost every decision they make about past, present, and future campaigns they’re running.
Next, I’ll show you some of the key benefits of tracking your sales analytics.
Benefits of Using Sales Analytics
1. Optimize overall sales performance and improve pipeline
The number one reason to use sales analytics is that it can improve your overall sales performance.
You can track key metrics like your number of leads at every pipeline stage, pipeline velocity, total revenue closed, conversion rates, and any other sales metric you need to know.
When you know your numbers, you can make smarter decisions when it comes to things like:
- Planning future outreach campaigns
- How to engage with leads at different stages of your pipeline
- The best ways to convert your leads into customers
2. Spot conversion gaps that lead to missed revenue
You can apply sales analytics to every stage of your pipeline, from your cold email campaigns to your demo calls to your nurturing and deal-closing stages. When you have your data in front of you, it’s easy to spot conversion gaps that are hurting your deal conversion rate.
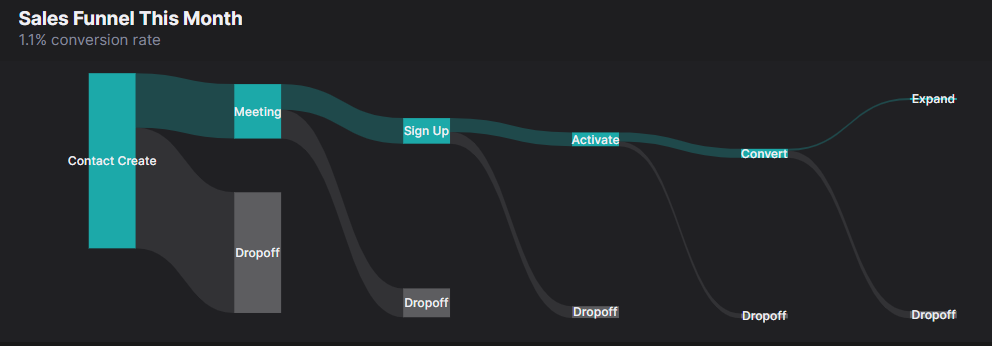
Source: HockeyStack
For example, if you see that you have a 50% reply rate to your cold emails but only a 2% meeting booking rate, you know there’s a high chance that you have a message or value proposition mismatch with the recipients.
Alternatively, if you’re able to consistently book meetings with prospects but only 5% of them convert into customers, you know that there’s a problem with the way your product demos are being handled.
When you have the data, you can quickly identify conversion gaps and opportunities in your sales pipelines and make actionable improvements.
3. Track individual and team performance against targets
Another benefit to having sales analytics in place is that you can set realistic targets for your sales team that are based on real data.
You can sit down with a sales rep, show them the data from their previous quarter, and work together to set targets for the next quarter that are realistic but push them to hit a new level with their results.
If you have sales analytics dashboards that your team can access and monitor, they can track performance over the quarter and see how they’re performing against their targets.
4. Improve your sales channel choice
As you collect data on sales performance, you can see which prospects and segments are engaging most with your sales team, as well as seeing which sales channel you first engaged with them on.
For example, if leads from LinkedIn outreach convert at a 20% higher rate than leads from your blog, you know that it’s worth investing resources into LinkedIn over your SEO strategy.
Over time, you can monitor and spot opportunities in your sales and marketing strategies to get the highest return on your investment and time.
Every move your team makes will be based on real data, and you’ll be tracking it moving forward so you can easily judge how new campaigns perform.
Sales Metrics to Monitor in Your Analytics Dashboard
To see the full list of SaaS sales metrics you should track, check out our guide here.
When it comes to your sales operations, you need more specific metrics that your team can look at on a regular basis.
In the next section, I’ll show you the most critical metrics to track in your sales analytics dashboards.
1. Lead Velocity Rate
Lead velocity rate is a fundamental sales metric that tells you the growth in leads month over month (or any period of time you choose).
To calculate it, use the formula:
(Number of Qualified Leads for Current Period – Number of Qualified Leads in Previous Period) / Number of Qualified Leads in Previous Period x 100 = Lead Velocity Rate
This metric is a good way to track the general success of your sales efforts. If things are working well, your lead velocity should continue to increase on a monthly basis.
2. Average Annual Contract Value
As your business grows and evolves, there’s a high chance you’ll optimize your efforts to focus on customer segments with a high annual contract value (ACV).
These customers generate more revenue and will therefore be prioritized in your sales efforts.
The metric isn’t always perfect when used alone, as it doesn’t tell you much by itself. However, if you look at ACV from a qualitative perspective and map it to your customer segments, your sales team can use the data to start prioritizing accounts and leads that have a higher than average ACV.
3. Win rate
Your win rate is arguably the most important sales metric of all. It tells you how many of your opportunities you’re turning into paying customers and gives you an evaluation of overall sales function effectiveness.
You can measure it with the following formula:
Win rate = (Deals successfully closed / Deals successfully closed – deals lost)
When you know your win rate, you can accurately forecast how many deals you’ll close, based on actions you take in your sales process.
For example: suppose you know that your deal win rate is 40%, and you can get an average of 10% meeting booking rate from your cold outreach.
If you send 1,000 cold emails and make 500 outbound sales calls in a month, you’ll schedule 150 meetings. If your 40% win rate holds up, you’ll close 60 new deals.
You can then scale up or down as needed to match your capacity and targets for the quarter.
4. Demo conversion rate
This is a more granular sales metric that focuses on a key part of your pipeline. If your sales outreach and pitch deck is working, you’ll be regularly scheduling demos and calls with potential customers.
Your demo conversion rate tells you how many of those leads are moving from a demo into a customer.
It’s simple to calculate. Just use this formula:
Demo conversion rate percentage = (Number of leads converted into customers / total number of demo calls) x 100
This is a signal of how well targeted your sales outreach is, and tells you how effective your demo process is. You can send outreach campaigns knowing that if you can get a lead on a call, you have a great shot at closing them.
5. Average reply rate
Your reply rate tells you how many leads are responding to your cold emails or LinkedIn outreach. This metric can be separated across channels for the best view.
For example, if the audience is equal but you have an 18% reply rate to your cold emails compared to an 8% reply rate to your LinkedIn outreach, you know that one channel is performing better for your business and to prioritize it.
To calculate your reply rate, you can use the following formula:
Reply rate % = (Number of replies to cold outreach / total number of outreach messages sent) x 100
Sales teams need to aim for an average response rate of 20% as a good benchmark. When analyzing the data from millions of cold emails sent with QuickMail’s cold email software, I found that the top 25% of cold emailers were able to get a 20% reply rate or more either through perfect targeting, or well-optimized email templates.

Anything lower than that and there’s a strong chance that your audience isn’t qualified for what you’re selling or you’re suffering from poor email deliverability that’s stopping your emails from landing the primary inbox.
If that’s the case, you can fix it by increasing the number of email accounts you manage and splitting your campaign volume between them, and using an email warm up tool to show email service providers that you’re a trusted sender.
Tracking Your Metrics in a Sales Analytics Tool
Tracking your sales analytics manually in a shared Google Sheet isn’t a productive use of time.
Today, most good sales tools will have built-in sales metrics tracking.
For example, a cold email outreach tool like QuickMail will track your email open, reply, and click-through rate.
A CRM like HubSpot, Pipedrive, or Salesflare can track metrics like lead velocity and the total potential revenue in your pipeline at any given time.

Source: Salesflare
You can also connect your product to a sales analytics platform like HockeyStack to analyze your top-performing customer segments.
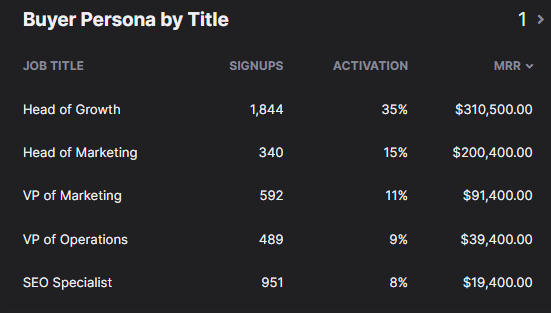
You can also analyze your new deals and see which type of customers are generating the most revenue for your business, and adapt your sales to cater to those customers.
When choosing your sales analytics tools, always verify that they have integrations with your other sales tools. This means you can connect them together and gain clarity into and it’ll be easier to view your key sales metrics in one place.
You also need to ensure it lets you bring different team members into the platform, or, give you shareable dashboards. This means every member of your sales team can keep track of performance and can make improvements to their process on an ongoing basis.
Conclusion
As you’ve seen, tracking your sales analytics has a range of benefits. You can:
- Improve how your overall sales operation performs,
- Track and forecast your revenue from sales,
- Set realistic goals for your team, and
- Focus on the highest ROI channels
The problem is, most sales teams don’t accurately measure their sales analytics and it’s easy to end up focusing on the wrong thing.
Start by tracking the sales metrics I’ve shown you in this article, and you’ll quickly spot opportunities to take your sales function to the next level.


