The Complete PPC Reporting Guide: Definition, Best Practices, And Tools You Should Try
Pay-per-click advertising, or PPC, is one of the most important yet misunderstood areas of digital marketing. PPC reports serve a critical role and help marketers get a complete understanding of the types of ads that resonate most with audiences and which marketing channels are performing the best to optimize ad spend and increase the chance of conversions.
While PPC reports are a great tool, it’s important to know which metrics to use in your reports to ensure you can make the most of your next PPC campaign. In this article, I will cover the essentials of PPC reporting, PPC best practices, and tools you should try to uncover much-needed paid advertising insights.
So, What Is PPC ?
As mentioned earlier, PPC is the short version of “pay-per-click.” Advertisers pay a small fee to the platform each time someone clicks on their paid advertisements.
When the ad is working right, this fee is much less than what the visitor pays to the business. For example, if we pay $10 for each click, but the click results in a $1000 sale, then we make a great profit. Hence, when done right, PPC is an incredible marketing technique that marketers should leverage.
But, what should you do to make your ads give you the revenue you need?
Well, a lot goes into a profitable PPC campaign. Not only is it essential to work really hard on creatives, targeting, keywords, and separate landing pages for each paid ad they launch, but it’s also important to keep a close eye on key metrics to ensure that you can optimize your PPC performance for best results.
What Is a PPC Report?
PPC report is an evaluation of key performance indicators of your digital ad campaigns. It’s a report that shows the marketing team how effective their ads have been & how profitable they are.
PPC reports are a part of marketing attribution reports as they report which campaigns are working & their ROI.
A good PPC report should have 9 metrics that will help the marketing team iterate & improve their ROI.
Why Do You Need a PPC Reporting Tool?
When analyzing your PPC campaigns, you need an accurate analysis of many metrics. Because, most of the time, the sole purpose of these campaigns is not to get the user to buy a specific product in one visit. In fact, it can take a few website visits and even a few follow-up emails before a user makes a purchase.
With so much to track, manual analysis and optimization will obviously become too much to handle.
With a PPC reporting tool, however, you’ll have much more control over your advertising campaign data. Complete with the right filters and visualization options, a PPC reporting tool can help you gather the insights you need. You’ll also have the option to choose from a selection of metrics that can affect how you see your PPC data.
PPC Metrics
- Total Clicks: The number of times a paid ad is clicked
- Cost per Click: The average amount spent per click
- Click Through Rate (CTR): How often your ad is clicked on after being seen
- Quality Score: Google’s measurement of the quality and relevance of your ads, keywords, and landing pages.
- Impression Share: How often your ads are displayed for a keyword.
- Conversion rate: How frequently a click results in a sale
- Cost per Conversion: How much it costs to drive each paid conversion
- Total Conversion Value: How much on average an entire conversion is worth
- Return on Ad Spend (ROAS): How much you make per dollar spent on advertising.
How to analyze each metric
Clicks
This is a tricky metric as the number you see on your ad manager is almost always more than the number you see on your web analytics tool. This is because some people click on your ad by mistake and leave it before your website loads. So, you should analyze this metric with a grain of salt.
Although it might be a tricky metric, it still gives you an idea about your ad’s performance- especially how much it resonates with your audience.
If the number of clicks is too low, then you can understand that the creative is not a thumb-stopping one.
Cost per Click
A good cost per click depends on your annual contract value because if it’s high, then your cost per click can be higher than others too. That said, your ads will still be profitable in the long term.
A good cost per click rate also depends on your conversion rate. If your retention rate is high, a high cost per click can be ignored.
Click through rate
Click-through rate also gives you solid insight into your creative’s performance, but it also allows you to understand if you are bidding on the right keywords. In other words, the click through rate of your ads will show you whether you are showing your ad to the right people.
If you are not, they might see the ad and not click on it because of incorrect ad targeting. You can A/B test your creatives, keywords, and audience to reach a higher click-through rate.
Quality Score
Quality score by Google is one of the most important metrics that you should focus on as it analyses your ads and lets you know how good they are.
Impression Share
Impression share lets you know how often your ads are displayed for a keyword. This, again, will give you an idea of how well you’ve selected the keywords for your ads.
Conversion Rate & Cost per Conversion
Conversion rate and cost per conversion are integral for digital marketing team to improve ROI. Conversion rate is the percentage of the visitors who converted into a customer. On the other hand, cost per conversion is the cost of a conversion.
Starting with these two metrics will give you a head start to optimize your marketing channels.
PPC Platforms
On top of different metrics that you can use for your reports, there are 10 different PPC platforms to choose from & report:
- Google AdWords
- Bidvertiser
- RevContent
- AdRoll
- Facebook Ads
- Bing Ads
- BuySellAds
- Advertise.com
- LinkedIn Ads
- Twitter Ads

Qualities Of The Best PPC Reports
Of course, not all PPC reports are created equal. There are some important qualities that differentiate a good PPC report from a bad one.
Goals and Business KPIs
A good PPC report should serve your business’s core KPIs and goals.
If your goal for the next quarter is decreasing the cost per click, the metrics that you include in your ppc reports must give you insight into ad spend and give you information on how to reduce it.
Historical Data
A good PPC report must have historical data in order to compare between different timeframes and see what is changed.
If your analytics tool doesn’t have a retroactive tracking feature, then it might be difficult to get historical data as you will only be able to get data from the time frame after you created your conversion goals.
Conversion Data
Conversion rate and cost per conversion must be on your PPC report as they are the core of PPC marketing & revenue attribution.
Without these two metrics, you won’t be able to really understand how much your business grew with marketing.
Compile Information From All Platforms Used
In order to create a PPC report that gives you the full picture of your strategy and results, you need to pull data from all platforms used.
This will allow you to measure attribution of different platforms, give you an idea to focus, and iterate on your strategy.
PPC Reporting Templates
Core Analysis Report:

A core analysis report can bring in your data from various advertising platforms and help you get a complete understanding of your ppc campaign’s performance. From conversions and clicks to the average clickthrough rate, a core analysis report gives you a complete picture of high level information your advertising campaigns.
Budget Utilization Report

A budget utilization report is ideal if ad spend optimization is your primary concern. Once you have a solid budget utilization report, you can leverage a marketing analytics tool to get a complete dashboard of your sales and marketing data or your product and revenue data to understand whether you’re on track.
Device Targeting Report:
A device targeting report can help you gain more insight into your customers’ journey including browsing habits and purchasing patterns.

All images are from PPCexpo.
Top 6 PPC Reporting Tools
Cyfe
Cyfe is a PPC reporting tool that allows monitoring and analyzing data from various sources via dashboards and blends them with multiple reporting options.
Its customizable reports allow you to monitor the situation instantly and enable you to make future forecasts on trends.
Features
- Real-time reports
- Social media analytics
- Sector Based KPIs
- Automated e-mail reports
- User specific reports
- Unlimited History
Integrations
Cyfe has a large pool of integrations, including Google Analytics, Google Ads, Twitter Ads, Facebook Ads, MailChimp, Salesforce, HubSpot.
With the advantage of this large pool, you can work collaboratively with many platforms.
Pros And Cons
| Pros | Cons |
| Cyfe has a not so steep learning curve. You can master the tool in a short time. | It sometimes crashes and has bugs at critical moments. |
| The customization options are satisfactory, and it is possible to create a unique visual experience for both dashboards and reports. | It may create unexpected additional fees when using some features. |
| The integration possibilities are vast and easy to integrate, so you don’t have to worry about the platforms you work with. | It doesn’t have satisfying qualitative data collection abilities. |
| It can export reports in many ways and easily automate them. This provides excellent convenience for sharing. |
Pricing
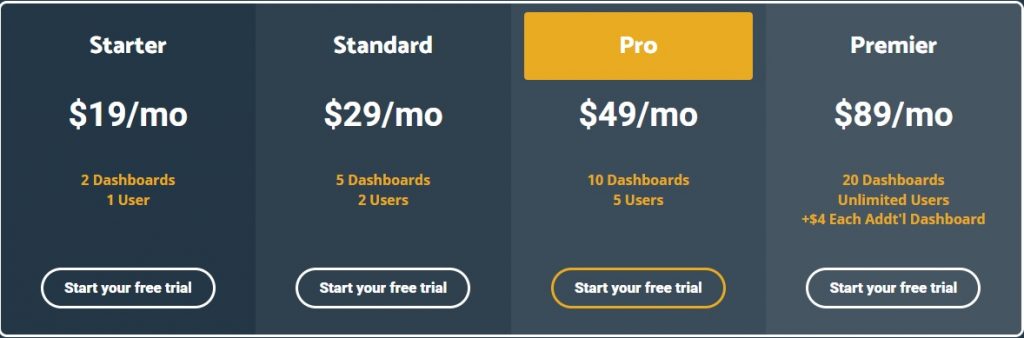
Cyfe has four packages.
- Starter
- Standard
- Pro
- Premier
Each package is based on the number of dashboards available and users. The dashboards in each package have the same features. That’s why you don’t miss out on any features because you’re in the low package.
If you’re unsure about the product, you can also avail the free 14-day trial period.
You can customize the Premier package according to your needs.
Google Analytics
Google Analytics can be considered the flagship among Google’s PPC tools in many ways.
It has many features that you need in PPC and is quite suitable for those looking for a complete tool.
However, it is necessary to keep in mind that although it has a reporting feature, it is not explicitly designed as a PPC reporting tool.
Features
- Reports on Advertising
- Reporting of Crash and Exceptions
- SDKs for iOS and Android
- Advanced Segmentation options
- Real-Time Reporting
- Seo Analytics
Integrations
Besides providing direct integration support to google environment products such as Google Play, Google Display Network, Google Tag Manager, Google Adsense, AdWords, Wildfire, it allows creating integration for third parties.
Pros And Cons
| Pros | Cons |
| Since it has a compact structure and appeals to a broad audience, the learning curve is not steep if you do not have extra needs. | Dashboard customization options have limits, which limits freedom. |
| Good at automating reports. It offers many options in this regard. | Since it is not specially designed for reporting, it does not give the most exceptional visuality and detailing results. |
| You can analyze data from many platforms with detailed import possibilities. | Although the data import options are praiseworthy, using these options requires technical details and time. That’s why you have to make sacrifices in return for a successful import. |
Pricing
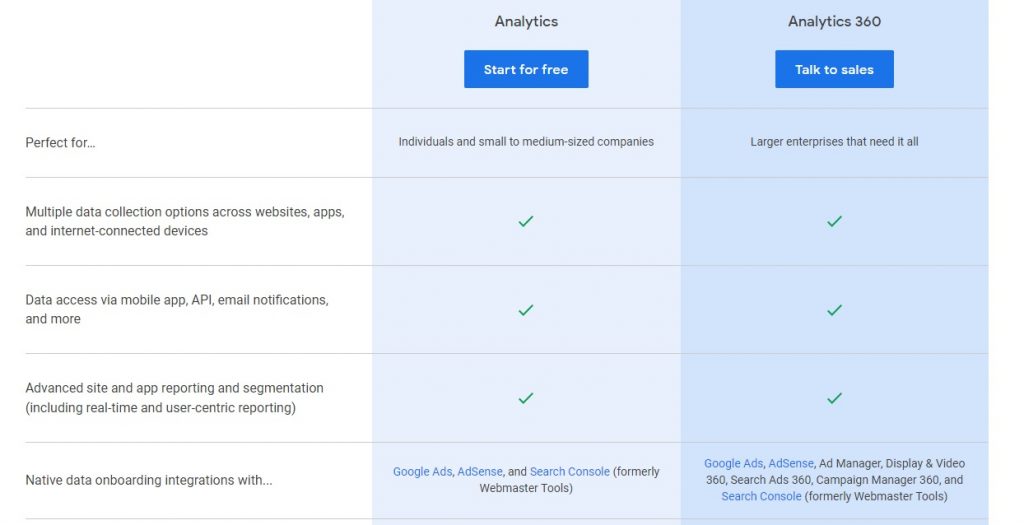
Google Analytics is a free tool that contains almost everything it can offer, especially in PPC reporting.
However, for users who want to work in much more detail with a PPC tool, there is also a paid version called Google Analytics 360.
You can learn pricing for this product by contacting the Google team.
Google Adwords
Google AdWords is an advertising tool that allows you to create advertising campaigns that will enable you to reach your target audience through the Google environment.
For this reason, it would not be right to consider AdWords as a specialized tool in the field of reporting.
Despite this, Adwords has understandable and straightforward reporting options. These reports can often help monitor metrics while working on the ad campaign without the need for additional tools to report in detail.
Features
- Reporting Editor
- Auction Insights
- Time Lag Report
- Reporting on Search Terms
- Scheduled email reports in varied formats
Integrations
Integration with many key platforms is available through the AdWords API. Almost all of the major platforms have GoogleAdwords integration.
Pros And Cons
| Pros | Cons |
| It offers significant dominance over the google environment. It is possible to reach many vital factors that API Cannot reach through Adwords. | Report sharing possibilities are minimal. People can only view reports via AdWords. |
| The scheduling facility is practical and effective. You can share data in the format you want whenever you want. | It’s pretty weak in visualization, as it wasn’t developed specifically for reporting. Customization options are also scarce. |
| It has Basic level reporting for many KPIs. With this facility, you are using that platform to analyze an advertising platform. This often eliminates the need for additional tools. | Its functional capabilities are not enough for users looking for detailed and compact analysis. It is tough to keep a regular report with specific filters without an additional tool. |
Pricing
Google Adwords is a free tool. Of course, you pay fees for your advertising campaigns.
But all the features you will use during the analysis and creation of these campaigns are provided free of charge.
Dataslayer
DataSlayer is a PPC reporting tool that collects data from many platforms and creates and transfers reports based on these data to other platforms such as Google Sheets, Google data studio, and Bigquery.
Dataslayer, which practically performs a simple purpose, is a great solution, especially for small and medium businesses.
Features
- Import/Export of Data
- Visualization of data.
- Drag and Drop
Integrations
Dataslayer can provide data from many sources, including Google Ads, Maria DB, Facebook, Google Analytics, Mailchimp, Google Search Console, DCM, Microsoft Advertising, Criteo, and YouTube.
Pros And Cons
| Pros | Cons |
| Practical and functional interface designed to serve its purpose | It might take a while to load while gathering a large amount of data. |
| A fast and reliable user support team brings practical solutions to your problems. | Although it cooperates with some important platforms, it does not have a vast data source pool. Accordingly, you may not be able to integrate some of the platforms you cooperate with. |
| It is very easy to use and does not require additional technical knowledge to specialize. This allows users of all kinds to use it. | In some critical moments, bugs and errors may appear. Accordingly, you may have to start the process from the beginning and lose time. |
Pricing
Dataslayer has a free basic version, and it provides most of what you need.
Other versions bring additional possibilities on API calls per day and user support.

Databox
Databox is a PPC reporting tool that allows you to create dashboards that you can customize in detail with data from different sources.
The tool aims to prepare the dashboards in a qualified manner and display these dashboards on many devices.
Features
- Dashboard Designer
- Metric Tracking
- KPI Scorecards
- Goal Tracking
- Looped Databoard
- Desktop,Tv and Mobile device support.
Integrations
Databox provides direct integration to many platforms, including Shopify, Linkedin, Google Ads, Google Analytics, Meta Environment, PayPal, Ahrefs, Hubspot, and more. Apart from that, its doors are open to third-party integration opportunities.
Pros And Cons
Some of the advantages and disadvantages of Databox compared to its alternatives are:
| Pros | Cons |
| They have blended a clear and visually pleasing interface with functionality. | The customization options that allow you to organize your dashboards almost limitlessly are not that effective when it comes to reporting. It isn’t easy to customize your reports functionally while creating them. |
| It appeals to all kinds of users. Ordinary users can specialize as much as users with a technical background. | Although technical knowledge is not required to specialize, you may need a long time to determine your needs. In the meantime, the number of pre-templates offered to you is very few. For this reason, the efficiency you get from the tool decreases in the process of creating your own style. |
| In many reviews of the tool, users report that they got good user support when they had a technical problem. | If you want to use an integration that you create, not an integration that the tool supports directly, the process is quite complicated. |
Pricing
Databox offers a free package with all standard features, 3 data source connections, and many integration possibilities. This package provides users with a basic level of use.
However, if you want to access the signature features of the tool and aim for high usage, there are also three separate paid packages where you can set the limits with a slide bar.

HockeyStack
HockeyStack is a SaaS analytics and attribution platform used by 7000+ companies.
Using HockeyStack, you can build any dashboard you need with metrics from different departments. Custom dashboards allow you to connect the dots to better understand what drives revenue for your SaaS.
For example, you can build a churn by the blog post user signed up report:

A trial to expansion funnel:

And even consolidate data from Google Ads, Bing Ads, Linkedin Ads, and a number of other advertising platforms.
On top of custom dashboards, HockeyStack has other features and capabilities too, such as
- Surveys
- Step-by-step user journey
- Funnels & goals
- Revenue Attribution
and more.
HockeyStack Pricing
You can check out the pricing page here.
HockeyStack Integrations
Here are some more data sources you can leverage with HockeyStack:
- Paddle
- Stripe
- Hubspot
- Crisp Chat
- Mailchimp
- Intercom
- Pipedrive
- Chameleon
- Salesforce
- Zapier (coming soon)
HockeyStack Summary
The unique benefit of HockeyStack is its ability to unify your marketing, revenue, sales, and product data using no code. This allows you to uncover unique insights that you wouldn’t be able to by using multiple tools as they cause you to have fragmented data.
- You can integrate with Stripe, Paddle, Hubspot and other SaaS platforms to build every single dashboard that you can think of, using all sales, marketing, revenue, and product metrics.
- You can create funnels, goals, and surveys, which are rare to get with other tools on this list.
- You don’t need any developers, tracking is cookie-less, and the script is small, so it doesn’t increase your site loading time.
Conclusion
PPC reporting tools eliminate the need to run tedious processes manually. It allows the user to analyze the right part of the data within the framework of the right metrics.
However, these tools are not the same. Choosing the right reporting tool in line with your company’s budget and needs is vital.
A properly selected PPC reporting tool can make you stand out radically compared to your competitors.
Using the tools effectively is as important as choosing the right tool. Expertise in marketing analytics provides great benefits in measuring the reporting capabilities of tools and making customizations accordingly.
You can take advantage of Marketing Analytics Courses to specialize in this subject and go one step ahead in this regard.
FAQs
A PPC report ideally evaluates 9 key metrics and shows how effective different marketing campaigns were and how their ROIs are. They are used by marketing teams to get feedback on their work and take further action accordingly.
PPC reporting starts with setting goals. You should decide on why you want these reports. What are you hoping to achieve? Why are you going to analyze these metrics? Once you decide on your goals start choosing your KPIs considering your audience and the big picture, and start sketching out your report.
In this article you can find the 9 key PPC metrics, how to analyze them, qualities of the best PPC reports, platforms that can help you with PPC reporting, and even four different types of templates to get you started.
A PPC report reflects each individual business’ goals and achievements, so it is pretty personal. That’s why there isn’t just one most important thing to include. You can look back at your own business and marketing campaign and goals, and evaluate which metric is more important for you.


