ActiveCampaign's Newsletter Vitals Dashboard
With over 1M subscribers, how does ActiveCampaign measure their newsletter’s contribution to revenue?
What does this newsletter dashboard measure?
This dashboard measures:
- Subscriber growth
- Cost per subscriber (paid)
- Revenue per subscriber
- Conversion lift of subscribers vs. non-subscribers
- Funnel metrics of subscribers in pipeline
- Influence of newsletter on sales velocity
- Blog views of subscribers vs. non-subscribers
- Trial conversion rate of subscribers vs. non-subscribers
- Self-reported attribution mentions of newsletter
How can I use this dashboard?
This dashboard will help you:
- Prove your newsletter’s contribution to revenue
- Forecast how much revenue a larger audience will deliver
- Benchmark cost of subscriber for organic promotions
- See if subscribers convert faster and pay more than non-subscribers
Newsletter Vitals Breakdown
How can you prove your newsletter’s influence on revenue? Not by reporting on platform metrics like opens, bounces, or click-throughs. If you want a seat at the revenue table, content teams need to connect newsletter investment to the business's bottom line. And that’s exactly what ActiveCampaign's newsletter dashboard helps you do in HockeyStack.
Let’s break it down.
Subscriber growth
First up, the dashboard helps you get core subscriber vitals at a glance:
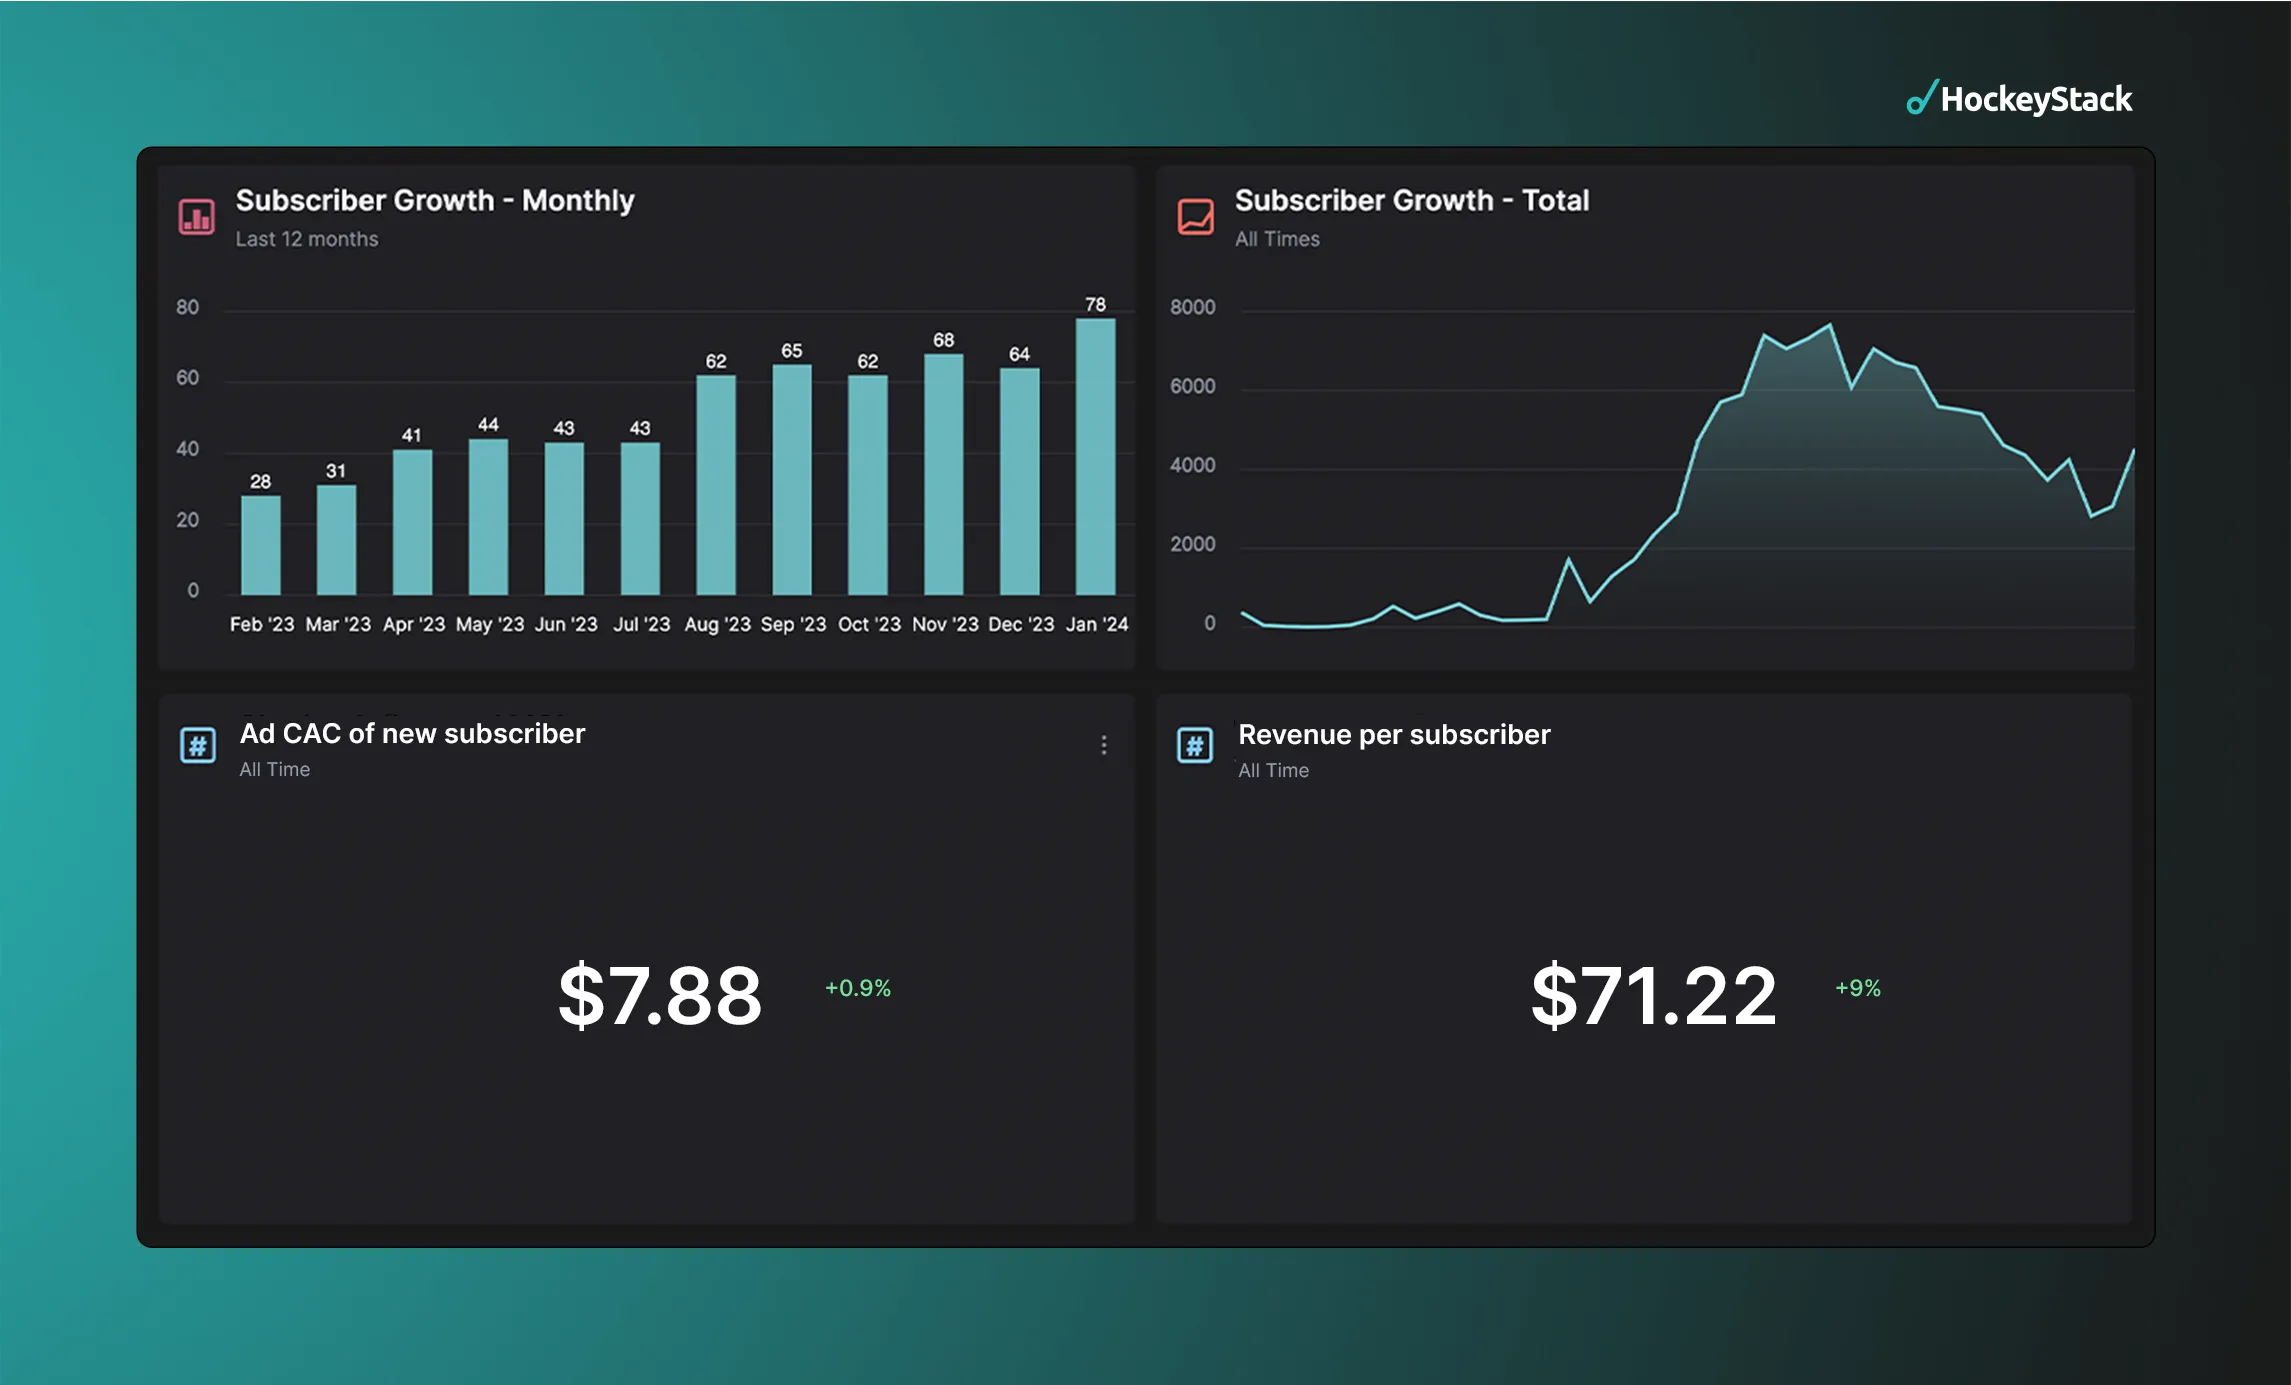
- Subscriber growth: Using a line chart to visualize historical growth, how many subscribers do you have? And how many subscribers have you gained overtime?
- Cost per subscribers (paid ads): If you’re running paid ads to promote your newsletter, then how many of those clicks convert into subscribers, and at what cost? This will tell you how fast you can scale subscribers on your budget, but it will also give you a benchmark for how much each organic subscriber is worth. You can use that benchmark to budget for organic promotions like giveaways or partner referrals.
- Revenue per subscriber: How much lifetime revenue have you generated from people who were subscribers first? Now divide that number by total subscribers to get your average revenue per subscriber. If a subscriber is worth $100 in revenue, you can estimate how much revenue a larger audience would produce if you grew it.
Based on this data, if you're going to invest in paid media to grow subscribers, it’s best to keep ad customer acquisition cost (CAC) under $71.22, otherwise you'll lose money on the investment.
Funnel metrics: subscribers currently in pipeline
Next, ActiveCampaign's newsletter dashboard highlights funnel metrics of subscribers currently in your pipeline:
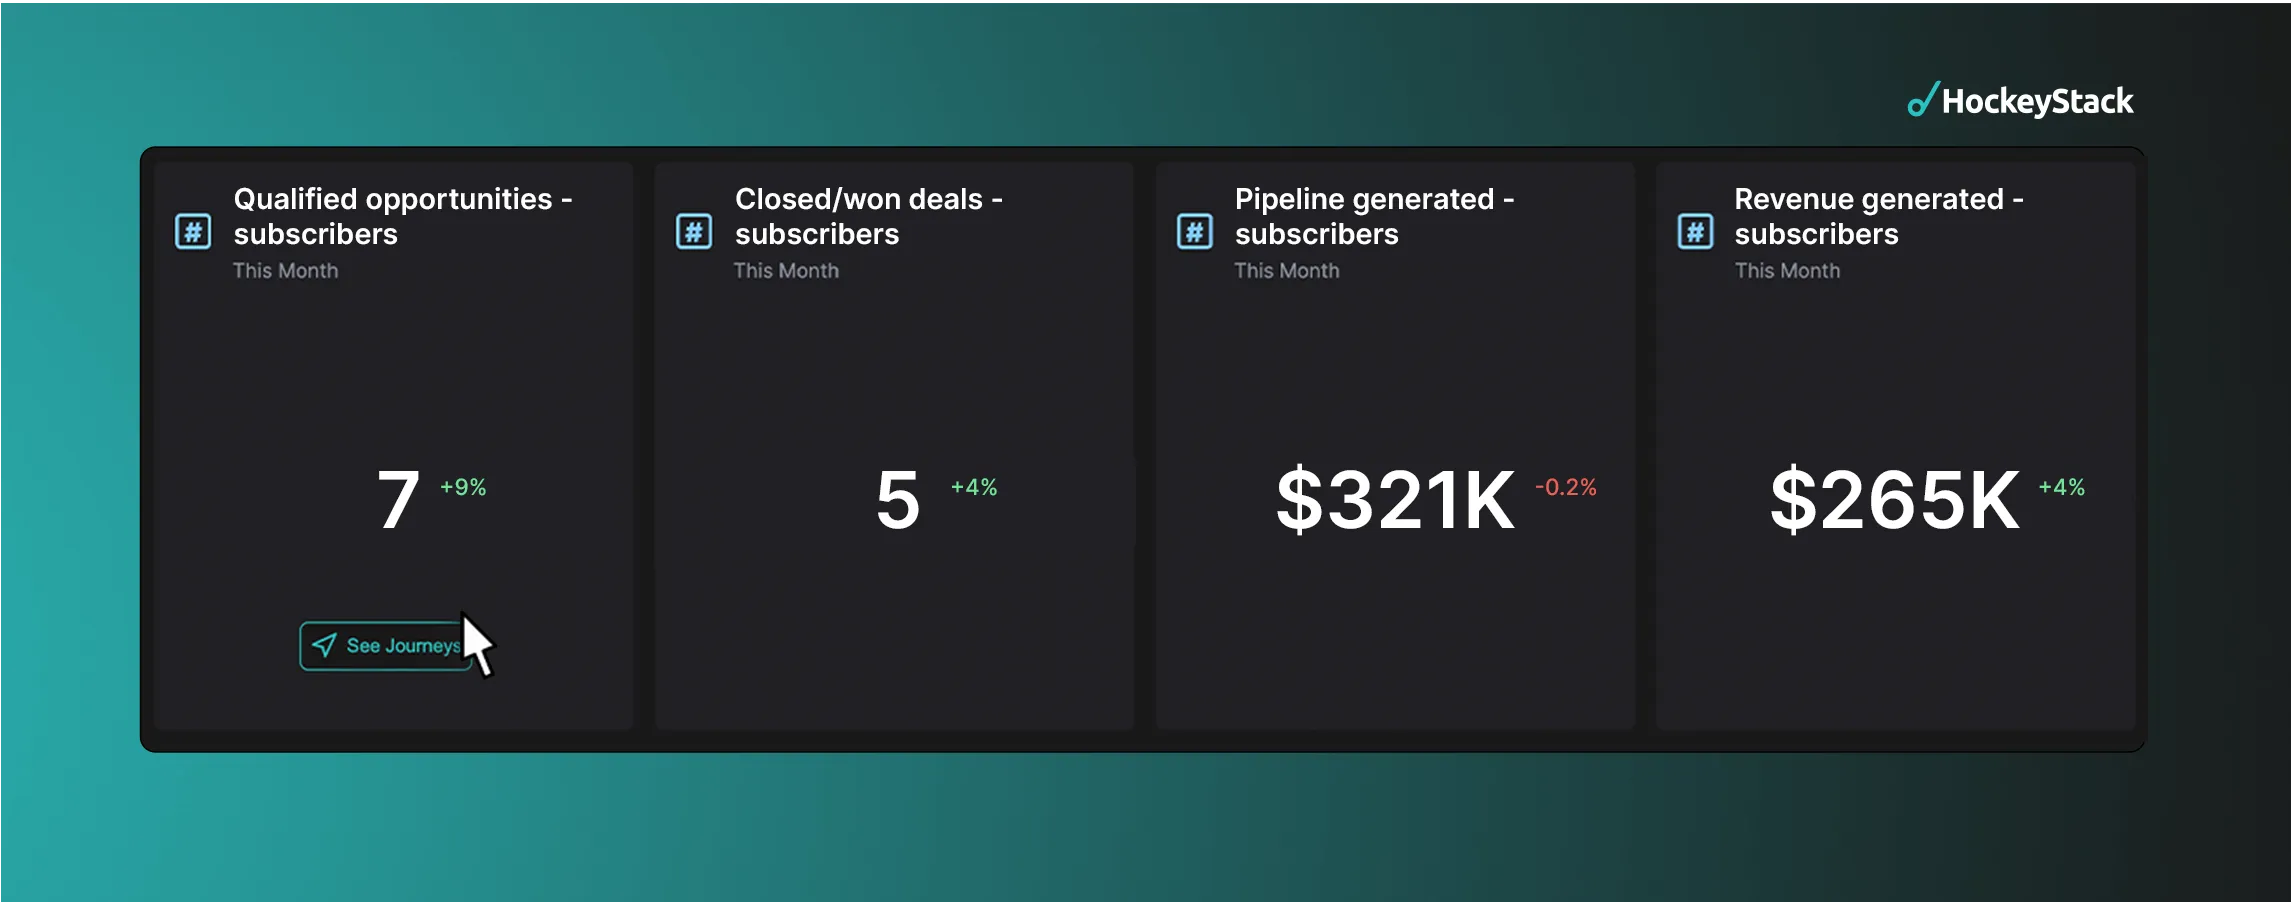
- Qualified opportunities: How many subscribers are currently in Stage 3, qualified pipeline?
- Closed/won: How many subscribers have become customers this month?
- Pipeline: How much pipeline have your subscribers contributed this month?
- Revenue: How much revenue have you generated from subscribers this month?
This report helps you identify how much revenue your business has generated from subscribers this month.
Bonus: if you hover over each metric, you can click "see journeys" and go directly to the account-level journeys of every account in that segment.
Incremental lift on sales velocity

How do subscribers compare to non-subscribers when it comes to sales efficiency? Enter: sales velocity. Sales velocity is a forecasting metric that predicts how efficiently revenue will move through your pipeline. To calculate sales velocity, multiply opportunities X deal value (annual contract value) X win rate, then divide that number by the sales cycle duration.

It’s marketing’s job to make sales more efficient by reaching and influencing future buyers in advance of purchase and by building a strong brand more people remember and consider when they move in-market. Therefore, effective marketing should influence sales velocity.
But since a forecasting metric doesn’t make for a good performance metric, we’re going to use the independent variables of sales velocity as a proxy for sales efficiency instead:
- Opportunities: the number of qualified opportunities (stage 2/3) that sit in your pipeline
- Deal value (ACV/ARPU): how much money, on average, each customer pays you
- Win rate: how well do you close deals- largely dependent on lead quality
- Sales cycle duration: how many days it takes someone to close
If effective, ActiveCampaign's newsletter will reach more of the right people, build strong affinity, reduce pricing power, and accelerate sales cycles, which will produce more qualified opportunities who pay more, stay longer, and close faster.
In this report, ActiveCampaign uses HockeyStack's cohort analysis to compare subscribers vs. non-subscribers and their influence on the independent variables of sales velocity (qualification rate, ACV, win rate, sales cycle duration).
By running a retrospective analysis of the independent variables of sales velocity, then comparing those metrics to people who took a certain marketing action (treatment group) vs. those who didn’t (control), you can gain a sense of the incremental influence those activities had on sales efficiency.
Use this report to prove your newsletter is doing the hard work of making future sales easier, as evidenced by the shorter sales cycles, higher win rates, higher qualification rates, and larger deal values compared to non-subscribers.
Trial + engagement lift

Next, do website trial conversion rates (CVR) go up after contacts subscribe to the newsletter? Yup- By a lot.
Trial CVR for subscribers is 10% compared to 1.8% for non-subscribers. That means that if you promote your newsletter more often and in more places, for every 100 new subscribers you can expect 10 new free trial signup.
Self-reported attribution mentions of newsletter

Last, how many people mention the newsletter as their self-reported attribution (SRA), and of those that do, how much revenue have they generated?
Self-reported attribution is far from perfect (read: 2024 Self-Reported Attribution Report), but it's a good indicator of whether or not the newsletter creates strong memories future buyers recall when they move in-market. HockeyStack makes it easy to organize SRA mentions next to other KPIs like pipeline, deal value, and revenue.
Learn more about how HockeyStack helps marketing, revenue, and sales teams surface and action insights like the ones in this template by exploring the interactive demo or booking a virtual demo.

About
About: ActiveCampaign helps small teams power big businesses with the must-have platform for intelligent marketing automation. Customers from over 170 countries depend on their mix of pre-built automations and integrations (including Facebook, Google, WordPress, Salesforce, Shopify, and Square) to power personalized marketing, transactional emails, and one-to-one CRM interactions throughout the customer lifecycle.
Website: ActiveCampaign