2025 LinkedIn Ads Benchmark Report for B2B Marketers

Summary:
- This report breaks down benchmarks and key trends in LinkedIn Ads spending, CPC, CTR, clicks and impressions, pipeline progression, and channel ROI. It’s based on data from 70+ B2B SaaS companies ($5 million to $1 billion ARR) covering $28M in ad spend over three years.
- Increased spend doesn't always boost performance for in-platform metrics like CTR and CPC. Both varied dramatically by quarter due to factors like buyer behavior and increased competition.
- CTR and CPC don’t tell the full story. Measuring in-platform metrics alongside precisely defined funnel outcomes will help marketers determine how LinkedIn Ad campaigns are progressing leads through the sales cycle.
- HockeyStack is a GTM intelligence platform enabling B2B marketers to directly tie LinkedIn Ad performance to pipeline and revenue.
Let’s face it—LinkedIn Ads aren’t getting any cheaper, and for B2B marketers, it’s easy to feel like you're pouring your budget into a money pit.
Does that mean you should forget about LinkedIn Ads altogether and just focus on other PPC channels?
Absolutely not – LinkedIn Ads are still the best advertising platform for B2B companies targeting high-level decision-makers. And if you’re curious to see how LinkedIn stacks up against Google, you can bookmark our Google Ads benchmarks report for later.
What you will have to do, however, is build and optimize your marketing strategy based on real-world statistics and benchmarks. And that’s where our report comes in.
We’ve analyzed data from 70+ B2B SaaS companies, representing $28 million in LinkedIn Ad spend, to bring you key insights into the most important funnel benchmarks and data.
Let’s see what the numbers are saying:
Methodology
Sample size and description: This report is based on data we collected for the past 3 years from more than 70 B2B SaaS companies, ranging from $5M to $1B ARR, with average customer values (ACV) between $5K and $120K.
How we defined MQLs: For the purposes of this report, Marketing Qualified Leads (MQLs) refer to high-intent actions such as demo requests, pricing landing page visits, and contact form fills—essentially any “hand-raiser” showing interest in a product or service.
Lower-intent actions, such as ebook downloads, lead-gen form submissions, and webinar registrations, were excluded from this definition to maintain the focus on leads with the highest chances of converting into revenue. We wanted to make sure that our industry benchmarks reflect high-quality leads rather than inflated metrics driven by less valuable interactions.
How we defined SQOs: A Sales Qualified Opportunity (SQO) is defined as any pipeline opportunity created from an MQL, including SQLs and other stages of the sales pipeline.
To provide consistent, comparable data, we combined the definition of an SQO across all companies, to make sure that every pipeline opportunity used in the analysis represents a big step toward conversion. This is crucial for generating meaningful benchmarks that show actual sales potential.
Why we focused on funnel benchmarks instead of in-platform benchmarks: Unlike traditional reports that focus solely on in-platform metrics such as CPC, CPL, and CPM, we wanted to put the spotlight on funnel benchmarks. And it’s because funnel benchmarks show precisely how LinkedIn Ads contribute to the progression of leads through the sales funnel, from MQLs to pipeline and ultimately to revenue.
Why is this focus on funnel benchmarks more beneficial for B2B marketers? In-platform metrics tell you how well your ads are performing within LinkedIn, but they don’t always reflect the full impact on business outcomes.
Funnel benchmarks, on the other hand, provide a clearer picture of how LinkedIn Ads are driving high-value actions like pipeline creation and revenue generation, which are more directly tied to business growth. With funnel metrics, B2B marketers can better understand the true ROI of their LinkedIn Ads spend.
Our attribution model: We used a Position-Based attribution model for this report, which assigns 40% of the credit to the first interaction and 40% to the last interaction, with the remaining 20% distributed evenly across all middle interactions.
This model helps to capture the full customer journey and recognizes both the initial awareness generated by the ads and the final conversion event. In some cases, we applied impression-level tracking to gain a more granular view of LinkedIn Ads’ contribution to pipeline and revenue.
LinkedIn Ads Key Metrics & Benchmarks at Glance
Ad Spend Benchmarks
B2B SaaS companies spent the most on LinkedIn Ads in Q4 – specifically, over 30% of their total annual budget. This year-end surge isn’t surprising, as it’s almost an industry standard for teams to ramp up spending at the end of the year to maximize revenue and hit financial goals before the close of the fiscal year.
In many companies, especially in the UK, the fiscal year ends in March, which also drives high Q4 spending. Some teams may even feel pressured to use their remaining budget to avoid having it reduced the following year.
Q1 followed closely, with nearly 27.5% of total budgets spent on LinkedIn. Teams want to ensure they have enough leads for sales to close deals throughout Q1 and Q2.
Interestingly, Q3 saw higher spend than Q2, with teams increasing ad budgets toward the end of summer in anticipation of a strong Q4 pipeline. Although July and August are typically slow months, September tends to see a big budget increase, as companies push to create a strong Q4 pipeline. This is somewhat surprising, as Q2 generally sees more pipeline creation than Q3.
The highest single month for LinkedIn advertising spend was February, even though it’s a shorter month. This spike suggests that teams increase their investment early in Q1 to generate deals that can close by the end of the quarter.
February spending is likely aimed at maximizing deals for March, as March sees the lowest budget allocation, possibly because teams believe they can’t influence the Q1 pipeline by that point.
💡HockeyStack Analysis: The trends we see suggest that spending aligns closely with fiscal cycles, but there’s an opportunity for more consistent spending throughout the year. For instance, the data shows that allocating more resources in December may not always lead to the highest conversion rates due to the holiday season.
While December has the third-highest budget, much of that spend might be driven by the need to use up the remaining budget to avoid cuts next year. A more even distribution across the year may bring better results in certain industries, and continuous demand creation, even in months like March, can help teams capture demand later in Q2.
Key Insights
- Companies spend the most on LinkedIn Ads in Q4, followed by Q1. Q4 spending is driven by a desire to maximize revenue before the end of the financial year.
- Q1 spending is driven by two factors: maximizing revenue before the end of the financial year for some companies and filling the top of the funnel with leads for sales teams.
- Surprisingly, Q3 has a larger budget allocation than Q2.
- The most spending occurs in February, followed by November, December, and January.
- February spending is likely aimed at maximizing deals for March, before the end of Q1.
- March has the lowest budget allocation, possibly due to teams believing they can't influence the Q1 pipeline anymore.
- Almost 25% of the total budget is spent in January and February, likely to maximize Q1 deals and revenue.
- Spending doesn't increase significantly in April at the start of Q2 but jumps in May.
- A similar pattern is seen in Q3, with spending decreasing in July, increasing in August, and skyrocketing in September.
- Spending doesn't decrease in October, despite being the start of a quarter, likely due to the high possibility of closing deals in Q4 and Q1.
- December has the third-highest budget allocation, possibly due to teams spending their remaining yearly budget to avoid getting a reduced budget next year.
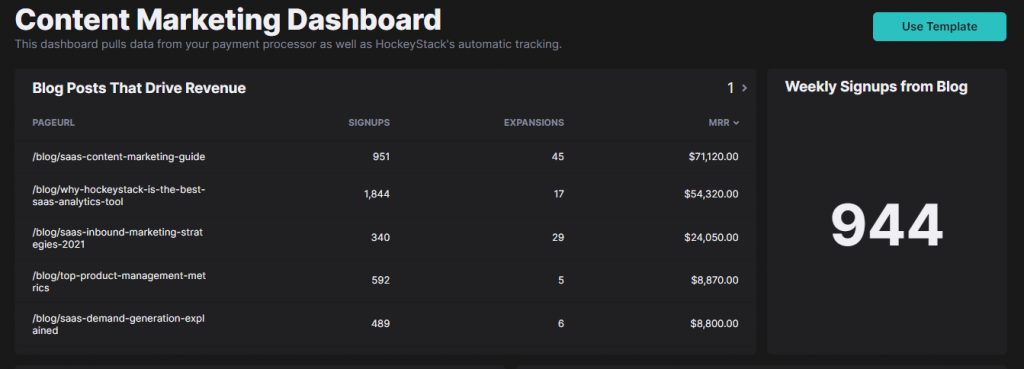
PRO TIP: Are you using other paid channels in addition to LinkedIn Ads, but have trouble connecting all the data and making sense of it? HockeyStack lets you connect all your different marketing tools (CRMs, ad platforms, social media, etc.) and get a more holistic overview of your performances across channels.
Below is an example of what you can get:
CPC and CTR Benchmarks
LinkedIn Ads performance metrics, such as click-through rate (CTR) and cost per click (CPC), fluctuate throughout the year due to factors like audience behavior, competition, and ad strategies. Interestingly, our data reveals that these two metrics don’t always correlate with ad spend, with different trends seen across different quarters.
Q3 stands out as the top-performing quarter for both CTR and CPC. During this time, companies experience the highest average CPC at $15.72, a 1.5x jump compared to Q1, likely due to increased competition as teams ramp up ad campaigns towards the end of summer.
Despite the higher costs, Q3 also delivers the best engagement, with an average CTR of 0.96%. September is the top month, with a CTR of 1.05%, suggesting that more targeted and optimized campaigns during this period lead to greater audience interaction.
On the other hand, Q1 has the lowest average CPC at $10.48, despite being the second-highest in terms of ad spend. This could be due to higher audience intent early in the year, where people are more likely to engage with ads, bringing down the cost per click.
However, even with lower CPCs and high spending, Q1 sees the lowest CTR at 0.82%. This shows that high ad spend doesn’t always guarantee better engagement rate, possibly because target audiences aren’t clicking on ads as much early in the year.
💡HockeyStack Analysis: The data suggests that while Q3 may be more expensive in terms of CPC, it also offers the best opportunity for engagement with a higher CTR. Marketers should take advantage of this by optimizing their awareness campaigns to capture audience interest, even if it means paying more per click.
On the other hand, Q1 offers a more cost-effective period for running ads, but marketers may need to adjust their creative and targeting strategies to boost engagement rates and overcome the lower CTR that’s typical for this quarter.
Key Insights:
- Q3 has the highest CPC at $15.72 and the best overall CTR at 0.96%, with September leading at 1.05%.
- Q1 has the lowest CPC at $10.48 but also the lowest CTR at 0.82%, despite high ad spend.
- CPC and CTR are not directly correlated with ad spend; factors like audience intent, behavior, and competition significantly impact these metrics across different quarters.
- Audience intent in Q1 may explain lower CPCs, as higher intent drives more clicks, lowering the cost per click.
- Q3’s higher CTR suggests more optimized campaigns, likely driven by a push to meet year-end targets and capture strong audience engagement.
- Spending more in Q3 may still deliver strong returns despite higher CPCs, as the increased engagement can make the higher costs worthwhile.
Clicks and Impressions Benchmarks
Across 2023 and into 2024, Q3 saw the best overall performance in terms of clicks and impressions.
September especially stood out with up to 117,095 clicks and over 10.9 million impressions, with companies likely preparing for Q4’s high-conversion periods.
Q1 had mixed results, with clicks ranging from 10 to 46,172 and impressions peaking at 1.7 million. While impressions remained relatively high in Q1, the click-through rate was lower compared to Q3.
Interestingly, despite high spend in Q4, we saw a slight dip in impressions compared to Q3, though clicks remained relatively stable. It could mean that competition for ad space is stronger toward the end of the year, making it harder to reach as broad an audience as in Q3.
💡HockeyStack Analysis: Q3 is the ideal time to get high engagement through clicks and impressions, with September leading the way in both categories. While impressions are also strong in Q1, the click performance tends to be lower.
Marketers should optimize their ad targeting and creative strategies during Q3 to fully capitalize on the high engagement potential. A good idea is to also test different ad types (dynamic ads, carousel ads, text ads, message ads, single image ads, LinkedIn video ads, etc.).
Key Insights
- September is the best month for both clicks (117,095) and impressions (10.9 million), and it signals strong engagement leading into Q4.
- Q1 shows mixed performance, with clicks ranging from 10 to 46,172 and impressions reaching 1.7 million.
- Despite high ad spend in Q4, impressions slightly dip compared to Q3, which could mean there’s more competition during this period.
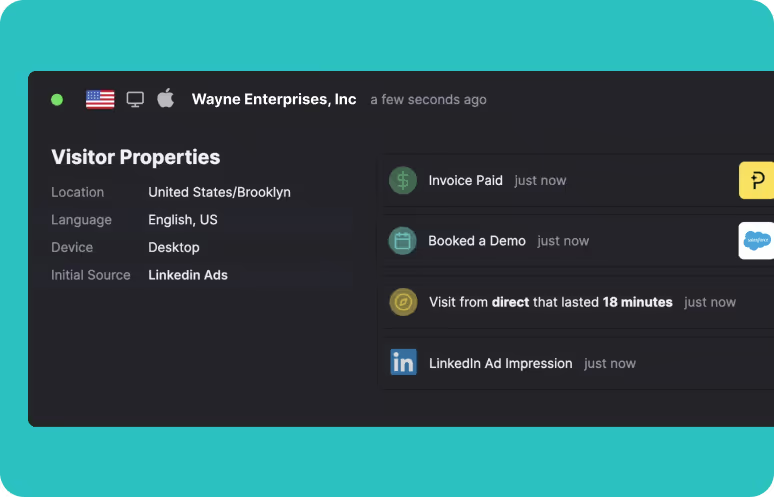
PRO TIP: With HockeyStack’s LinkedIn Ads integration, you can now see your LinkedIn ad impressions and engagement metrics in the account-level journey, and stack them in chronological order next to other trackable digital marketing and sales actions your company took.
MQL (Marketing Qualified Lead) Benchmarks
We found that Q1 was a strong period for MQL generation, with 27% of ad spend resulting in 27% of the total MQLs – meaning companies are getting what they paid for. This aligns closely with expectations, as companies increase their ad budgets early in the year to secure leads that can convert into deals within the same quarter.
February stood out as the month with the highest MQL rate, producing 139 leads during a period of high ad spend.
Interestingly, Q2 proved to be the most cost-effective quarter for MQL generation. Despite only 18% of the total LinkedIn marketing budget being allocated to Q2, this quarter generated 30% of the total MQLs. This suggests that marketing teams were able to hit their MQL targets with less spend.
The ratio of spend to MQL in Q2 reached 161.9%, making it the best quarter for MQL efficiency. Q3 followed a similar trend to Q1, with 22% of the total ad spend resulting in 22% of the MQLs.
However, Q4 posed challenges for MQL generation. Despite the highest budget allocation in Q4 (31% of the total budget), the quarter generated only 20% of the total MQLs. This decline in performance is likely due to the increased competition in ad auctions, which drove up the cost per MQL.
Across all quarters, Q2 stood out as the best period for cost-effective MQL generation, followed by Q3, Q1, and Q4.
💡HockeyStack Analysis: The data clearly shows that while Q1 and Q3 are reliable for MQL generation, Q2 stands out as the most efficient quarter in terms of cost per lead. In contrast, Q4 poses challenges, with the highest ad spend yielding fewer MQLs, likely due to auction dynamics driving up costs.
Key Insights
- Q1 ad spend results in 27% of total MQLs, with February being the standout month for lead generation.
- Q2 is the most cost-efficient quarter, generating 30% of MQLs with just 18% of the total budget.
- Q4 sees the highest spend but the lowest efficiency, with 31% of the budget generating only 20% of the MQLs.
- The most cost-effective ratio of spend to MQL was in Q2 (161.9%), followed by Q3 (100.8%), Q1 (99.3%), and Q4 (63.8%).
SQO (Sales Qualified Opportunity) Benchmarks
Based on our data, Q1 and Q2 stand out as the most efficient quarters for converting MQLs into SQOs.
In Q1, the MQL conversion cycle is the shortest, averaging 24 days. This is largely driven by the high intent of MQLs generated early in the year, as companies invest heavily in building their sales pipeline to hit early-year revenue targets. The high MQL volume in Q1 ensures a steady flow of SQOs, with many deals closing within the same quarter.
Q2 continues this trend, with the MQL cycle lengthening slightly to 45 days. However, this quarter remains highly productive, as MQLs generated in Q2 convert not only within the same quarter but also into Q3, creating a strong pipeline for the second half of the year. The extended sales cycle in Q2 reflects the beginning of longer-term deal-making, which is critical for companies with more complex sales processes.
Q3, while seeing a longer MQL cycle at 62 days, remains an important period for pipeline generation. MQLs generated in Q3 tend to convert into SQOs primarily in Q4, showing how long-term nurturing and follow-up to move these opportunities forward.
This longer cycle makes Q3 a time to focus on building relationships and optimizing follow-ups, as these SQOs will have a significant impact on Q4 revenue.
Q4, despite its heavy ad spend, experiences the longest MQL conversion cycle, averaging 68 days. This slower pace can be attributed to increased competition and the end-of-year focus on closing deals, leaving less time for nurturing new leads.
But while Q4 may be less efficient in terms of immediate SQO creation, many of these opportunities will convert in the first quarter of the following year.
💡HockeyStack Analysis: Q1 and Q2 provide the most efficient pathways for converting MQLs into SQOs, with shorter sales cycles that lead to quicker conversions. Q3 plays a big role in laying the groundwork for Q4 pipeline growth, despite the longer MQL cycle.
The data shows that while Q4 sees the highest ad spend, the extended sales cycle shows the need for sustained follow-up and nurturing efforts, as these SQOs will have a greater impact on the next fiscal year.
Key Insights
- Q1 has the shortest MQL conversion cycle, averaging 24 days, making it the most efficient quarter for immediate pipeline growth.
- Q2 remains highly efficient, with a 45-day conversion cycle, and MQLs generated in Q2 continue to convert into SQOs well into Q3.
- Q3 sees a longer MQL cycle of 62 days, with most conversions happening in Q4, making it a key period for nurturing long-term deals.
- Q4 has the longest conversion cycle, averaging 68 days, but these SQOs often impact the following year’s pipeline.
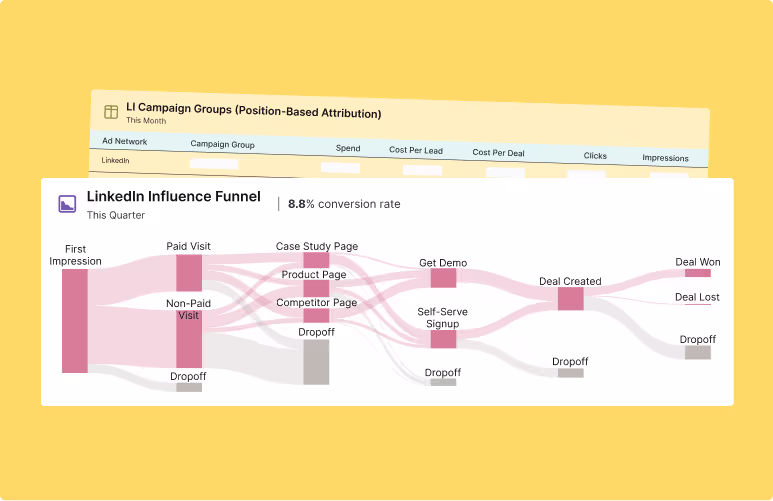
PRO TIP: You can use multi-touch attribution from HockeyStack to understand the true impact of your LinkedIn Ads across the entire customer journey. This feature assigns credit to every touchpoint, not just the first or last, helping you understand how each interaction drives conversions. Whether your focus is on MQL generation or sales-qualified opportunities (SQOs), this tool provides a more accurate assessment of LinkedIn Ads’ contribution to your sales funnel.
Pipeline Benchmarks
Once again, Q3 was the best quarter for pipeline generation, with companies creating up to $1.5 million in pipeline value.
This is in line with the strong performance of MQLs in Q2, where MQLs generated in Q2 converted into SQOs in Q3 and created a steady flow of opportunities.
Similarly, MQLs generated in Q3 continue to feed the pipeline in Q4 and beyond, with big momentum carried into the year-end.
Q1 also performed well in terms of pipeline creation, as companies generated 27% of their MQLs, which typically converted into SQOs within 24 days.
Pipeline generation in February 2023 reached $646,667, which suggests that companies were successful in converting early-year MQLs into sales opportunities. However, as ad spend in March decreased, pipeline generation also tapered off.
Q2 showed the most efficient conversion from MQLs to pipeline, with MQLs generated in Q2 converting into SQOs both in the same quarter and in Q3. Companies spent 18% of their budget in Q2 but saw major pipeline results, benefiting from the shorter MQL cycle in the first half of the year, averaging 45 days.
This data shows that LinkedIn Ads during this period are highly effective in generating leads that quickly convert into pipeline opportunities.
On the other hand, Q4 faced challenges similar to those seen with MQLs.
Despite allocating 31% of the budget to Q4, only 20% of the MQLs converted into pipeline. Additionally, Q4 MQLs took longer to convert into pipeline opportunities, with the MQL cycle stretching out to 62–68 days – a slower pace of conversions as the year-end approaches.
💡HockeyStack Analysis: The data shows that Q3 is the strongest quarter for pipeline generation, largely driven by the efficiency of MQLs generated in Q2. While Q1 performs well, the shortened sales cycle in the early months of the year boosts pipeline creation.
Marketers should capitalize on Q2 and Q3 to maximize pipeline creation, as these periods demonstrate the highest efficiency in converting leads to sales opportunities.
Key Insights
- Q3 leads pipeline generation, with up to $1.5 million in pipeline value created, largely driven by MQLs from Q2.
- Q2 is the most efficient quarter for pipeline creation, as MQLs generated in this period convert into SQOs both in Q2 and Q3.
- The MQL cycle is shortest in Q1 and Q2 (averaging 24–45 days), with conversion time extending to 62–68 days in Q4.
- Despite 31% of the budget allocated to Q4, only 20% of MQLs convert into pipeline.
ROI Benchmarks
Understanding the ROI at different stages of your funnel—such as pipeline creation and revenue generation—is critical for optimizing ad spend.
According to the data, Q3 is the most efficient quarter for pipeline ROI, delivering an impressive 6.01x spend-to-pipeline ROI. This strong ROI is due to the effectiveness of the MQLs generated in Q2, which converted into SQOs and pipeline opportunities in Q3.
In terms of revenue ROI, Q4 led the way, with a 2.46x spend-to-revenue ROI when measured using impression-level tracking. While Q4 is often seen as a challenging period due to higher ad costs and competition, the long sales cycles mean that the pipeline created in Q3 often results in revenue in Q4.
Q1 also performed well, as 27% of ad spend resulted in 27% of MQLs and a 2.44x pipeline ROI. But as we covered earlier, Q1’s CPC remained relatively low and it contributed to its efficiency.
Interestingly, Q2 saw the most cost-effective MQLs and pipeline generation, with an average spend-to-pipeline ROI of 2.53x. This means that companies were able to generate significant pipeline value with lower budgets, making Q2 one of the best-performing quarters in terms of ROI.
💡HockeyStack Analysis: The strongest ROI is observed in Q3, with Q2 delivering impressive results in terms of MQL generation and pipeline creation. Q4 sees the highest revenue ROI, largely driven by the pipeline generated in earlier quarters.
For marketers, a good plan would be to focus on Q2 and Q3 for strong pipeline growth, while Q4 remains a key period for closing deals and generating revenue.
Key Insights
- Q3 delivers the best pipeline ROI, with a 6.01x return for every $1 spent on LinkedIn Ads.
- Q4 leads in revenue ROI, with a 2.46x return, as the pipeline from earlier quarters converts into revenue.
- Q2 is the most cost-effective quarter, generating a 2.53x spend-to-pipeline ROI with lower ad spend.
- Q1 delivers solid returns with a 2.44x pipeline ROI, benefiting from lower CPC and high-intent lead targeting.
Stay On Top of Your LinkedIn Ad Performance with HockeyStack
Based on our data, LinkedIn is definitely a long-term game – while B2B companies might be seeing longer sales cycles, they’re also seeing stronger ROIs for pipeline and revenue, as well as better conversion rates from SQO to revenue.
To stay on top of your LinkedIn ad performance, you need a tool that not only tracks metrics but also helps you connect them to actual business results.
And HockeyStack could be the perfect fit.
With HockeyStack, you get a powerful marketing analytics and attribution tool that provides detailed insights into every touchpoint in your LinkedIn ad campaigns. It integrates seamlessly with LinkedIn Ads and you can use it to track ad spend, measure conversions, and tie performance metrics directly to pipeline and revenue.
The platform's multi-touch attribution feature ensures you understand the role LinkedIn plays in your entire marketing stack, so you can optimize for actual revenue rather than just clicks or impressions.
You'll also get access to custom reports, advanced filters, and real-time data, which allow you to adjust campaigns instantly and scale what's working.
In other words, you’ll have a complete picture of how LinkedIn Ads influence your entire sales funnel, allowing you to optimize for long-term growth.
But don’t just take our word for it – book a demo with HockeyStack and see just how easy LinkedIn Ads can be with the proper tools.