19 Best Marketing Attribution Software Solutions Reviewed for 2026
.avif)
Summary:
- Go-to-market teams continually struggle to determine which campaigns, content, and programs are driving real conversions.
- Lengthy and nuanced buyer’s journeys make it critical to have the right tools in place to effectively track, measure, and optimize touch points.
- This roundup details different marketing attribution solutions, including standout capabilities, notable limitations, ideal use cases, and pricing.
- HockeyStack is a GTM intelligence platform purpose-built for complex B2B buyer’s journeys, providing clear, actionable, and predictive insights into pipeline and revenue impact.
Marketing attribution is crucial for understanding the true impact of your campaigns, yet many businesses find it more complicated than it needs to be.
The issue? Most attribution tools are bogged down by complex interfaces and outdated tracking methods that leave marketers struggling to get clear insights.
As marketing continues to evolve and privacy regulations tighten, the tools that used to work simply don’t cut it anymore — and you’re left guessing which channels are truly driving results.
To avoid this unnecessary guess work, we’ve handpicked 19 of the best marketing attribution software available today.
If you’re looking for a solution that streamlines multi-touch attribution or provides clear, actionable insights, this list will help you find the right tool to optimize your marketing efforts.
Best Marketing Attribution Software at a Glance
1. HockeyStack
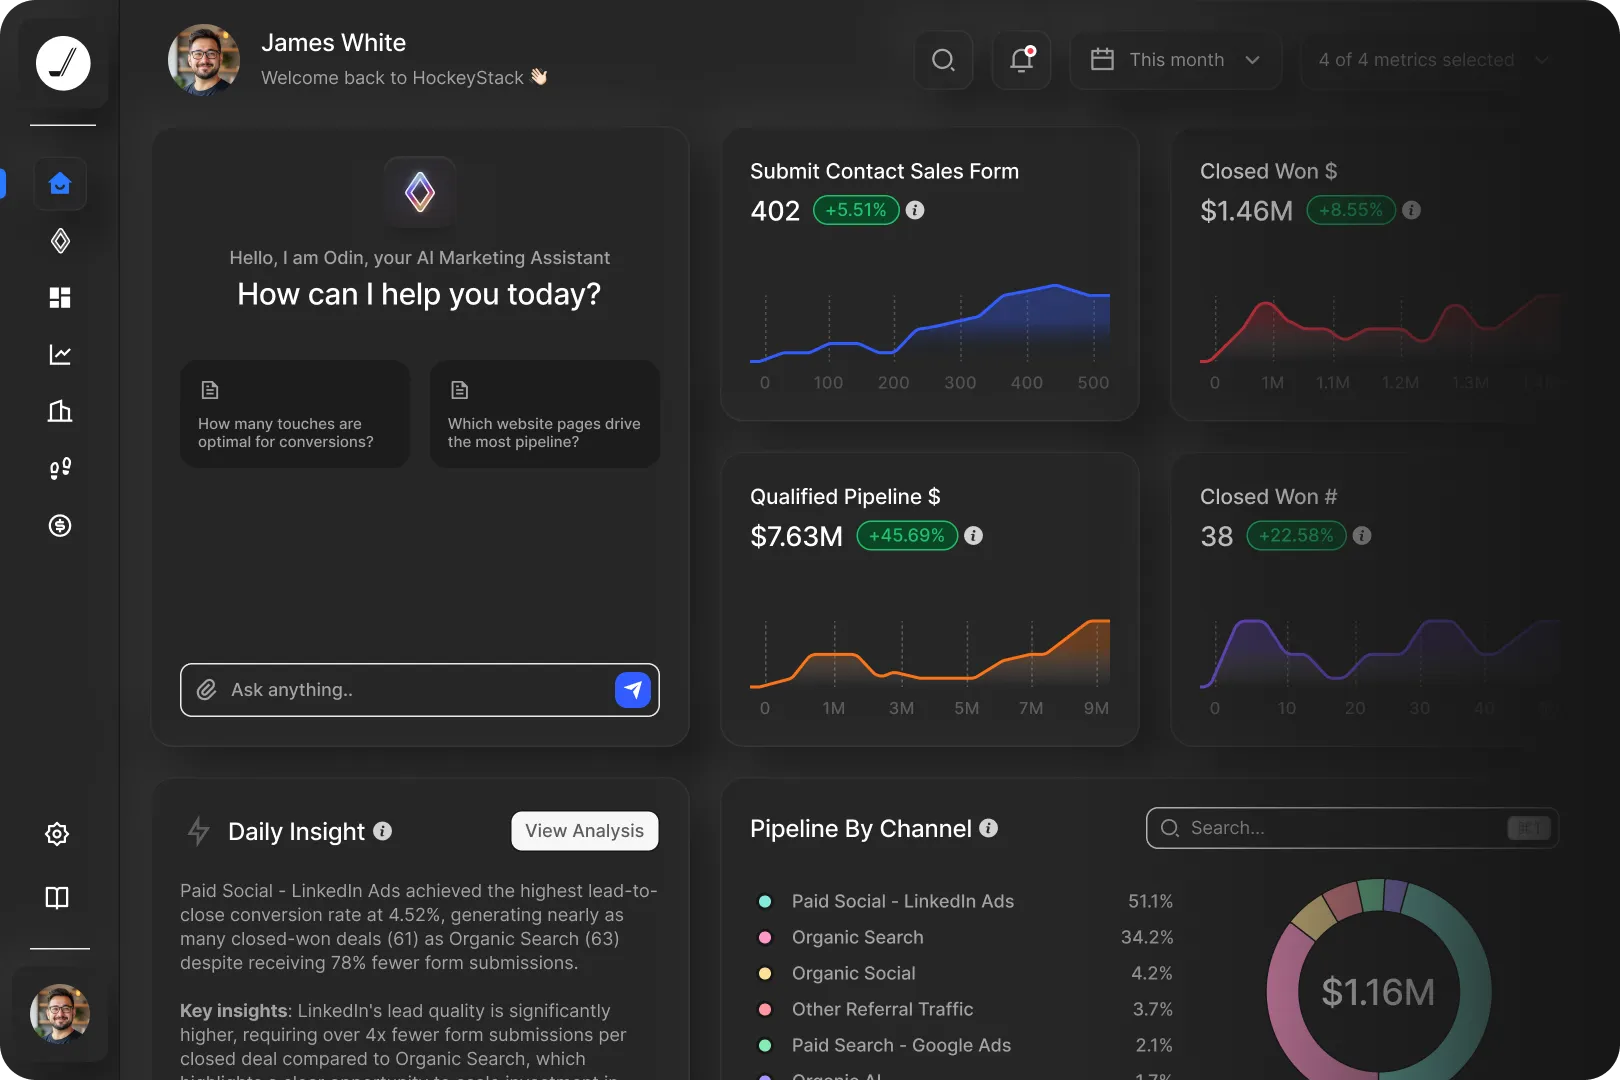
HockeyStack is a GTM intelligence platform built to solve the core challenges of B2B marketing attribution. It moves beyond simplistic models by first unifying data from across your entire customer journey—sales, marketing, website, and product—using its Atlas data foundation.
On top of this unified view, its AI agents analyze how every touchpoint contributes to pipeline and revenue, giving marketing teams clarity on what's actually working and enabling them to prove their impact.
Top Features
- Full-Funnel Journey Mapping: Tracks every single interaction across all channels (online and offline) for both accounts and individual users, providing a complete, visual map of the entire path to purchase.
- Flexible Attribution Modeling: Offers multiple attribution models (including first-touch, last-touch, linear, W-shaped, and custom models) allowing you to analyze performance from different perspectives and understand how various touchpoints contribute to revenue.
- AI-Powered Analysis (Odin): Odin allows you to ask complex attribution questions in plain English (e.g., "Which blog posts influenced the most enterprise deals?" or "What's the ROI of our LinkedIn campaigns?") and get instant, data-backed answers with visualizations, eliminating hours of manual reporting.
- Revenue & Pipeline Reporting: Provides out-of-the-box and custom dashboards specifically designed to connect marketing activities directly to pipeline generated, deals influenced, and revenue closed, making it easy to prove return on investment (ROI).
- Unified Data Foundation (Atlas): Solves the core data silo problem by automatically ingesting, cleaning, and unifying data from your CRM, ad platforms, website, and other GTM tools, ensuring your attribution is based on a complete and accurate dataset.
- Seamless Integrations. With integrations for Salesforce, HubSpot, Google Ads, and other popular marketing platforms, HockeyStack simplifies data synchronization and streamlines reporting across tools.
Why Companies Prefer HockeyStack
- Comprehensive Integration and Strategic Insight. HockeyStack is praised for its seamless integration with CRM systems and other third-party tools, enabling comprehensive visibility of the go-to-market (GTM) department’s performance. Users appreciate its effectiveness in communicating data across organizational levels, making it an essential part of strategic planning in enterprise B2B environments [*].
- Data-Driven Decision Making. Users rely on the tool daily to measure performance against goals and to understand which marketing efforts resonate most with potential buyers, facilitating data-driven decision-making [*].
- User-Friendly Interface and Real-Time Analytics. The intuitive interface and real-time data capabilities of HockeyStack allow teams to monitor user behavior and campaign effectiveness efficiently. This accessibility helps teams make quick, informed decisions, enhancing their ability to adapt and optimize marketing strategies swiftly [*].
- Direct Impact on Sales and Marketing Alignment. HockeyStack is noted for its ability to demonstrate the direct impact of marketing activities on the actual sales pipeline, not just on preliminary metrics like form fills or site visits. This clarity helps teams focus on activities that genuinely drive sales, supported by data integration that accommodates even messy CRM datasets [*].
- Detailed Buyer Journey Insights. The platform provides detailed insights into the buyer’s journey, allowing businesses to track and analyze the long-term engagement of prospects with content and marketing efforts. This depth of analysis is crucial for refining marketing strategies and identifying previously overlooked impactful touchpoints [*].
What Real Customers Are Saying About HockeyStack
Here's how leading B2B GTM teams are using HockeyStack to solve their attribution challenges and prove their impact:
- Kantox centralized fragmented marketing data, replacing Power BI, Excel, and slides with a unified view. This empowered their marketers with self-serve reporting and full-funnel visibility to make faster, data-backed decisions. [Read Full Case Study]
"With HockeyStack, we finally have the flexibility and visibility we lacked for years. Each marketer can create the views they need—without depending on BI or waiting weeks for answers.” — Lucía Delpozo, Head of Market Intelligence @ Kantox
- Pylon gained crucial visibility into channel ROI, identifying hidden pipeline drivers like Google Ads and enabling confident budget scaling. HockeyStack became their command center for pipeline accountability, saving significant internal RevOps and engineering time. [Read Full Case Study]
"HockeyStack has been an incredible ROI product for us. It’s given us visibility into something we were completely blind to—what channels are working and where we should double down.” — Marty Kausas, Co-Founder & CEO @ Pylon
- Firstup replaced disconnected tools worth $140K/year (like 6sense) and finally aligned sales and marketing around trusted account intelligence and full-funnel attribution, leading to faster, more confident decision-making. [Read Full Case Study]
“HockeyStack gave us full-funnel visibility, scoring we trust, and attribution that shows what’s actually working. Sales and marketing are finally aligned, and we can make faster, more confident decisions.” — Hollie Lemos, VP Revenue Marketing @ Firstup
Pricing
HockeyStack offers custom pricing tailored to your specific GTM needs.
Every plan includes seamless integrations with your GTM tools and CRM, hands-on support from our success team, custom setups for complex data environments, and real-time ROI tracking and performance reporting.
To learn more, book a demo with our sales team.
2. Ruler Analytics
Ruler Analytics is a specialized B2B attribution platform that focuses on providing closed-loop marketing insights by connecting marketing efforts directly to revenue.
It features multi-channel tracking capabilities that ensures that every touchpoint— online or offline—is captured and attributed. This makes it ideal for businesses that want to understand the impact of multi-touch campaigns, from initial engagement through to deal closure.
Top Features
- Visitor-Level Data. Captures granular, visitor-level data, tracking how specific users engage with your site and marketing campaigns.
- Ad Spend Attribution. Integrates with ad platforms like Google Ads and Facebook Ads to track ad spend and attribute conversions back to specific ads and keywords.
- Lead Source Attribution. This feature tracks where leads originate from (e.g., organic search, social media, paid ads), providing clarity on which channels and campaigns drive the most qualified traffic.
- Call Tracking. Provides advanced call tracking, enabling businesses to track inbound calls and connect them to specific marketing campaigns or keywords.
- Form Tracking. Tracks form submissions on your website and attributes them to the marketing activity that generated the lead.
What Do Users Like About Ruler Analytics?
- Better Lead Source Visibility. Ruler Analytics boosts clarity on where leads come from, allowing for more accurate marketing decisions and alignment with business goals [*].
- Easy Integration and Strong Support. The solution automates attribution with minimal manual work and integrates well with popular platforms like Google, Bing, and HubSpot. Users also benefit from highly responsive customer support [*].
- Detailed Conversion Tracking. The platform provides in-depth information on each form submission and phone call, including source, duration, and conversion paths [*].
What Do Users Dislike About Ruler Analytics?
- Limited Attribution Options. Ruler Analytics focuses on first and last-click attribution, which might not meet the needs of businesses that require full user journey tracking.
- Performance Lags. Some users report slow dashboard load times, making it harder to access real-time data efficiently [*].
- Data Sync Delays. Users have noted delays in syncing phone call data with CRM systems, affecting timely decision-making [*].
Pricing
- Small business. £179 per month.
- Medium business. £584 per month.
- Large business. £999 per month.
- Advanced. Custom.
3. Dreamdata
Dreamdata delivers data-driven insights into the customer journey, connecting revenue outcomes with marketing and sales activities. It aggregates and analyzes data from various sources, including CRM systems, marketing automation tools, and ad platforms.
The platform tracks both first-party and third-party data across the customer journey, using advanced tracking to map interactions over time—starting from the initial touchpoint with a prospect to the final closed deal.
By unifying this data, Dreamdata provides businesses with a clear view of the touchpoints driving conversions, allowing for better decisions on budget allocation and strategy optimization.
Top Features
- Touchpoint Analytics. Analyzes individual touchpoints, such as webinars, emails, or ad clicks, to measure their impact on lead progression and conversions.
- Sales Cycle Analysis. Provides deep insights into the length and performance of your sales cycle.
B2B Attribution Modeling. Assigns credit to various marketing and sales touchpoints across long, complex buyer journeys, providing a clear understanding of which activities drive revenue.
- Marketing Performance Dashboards. customizable dashboards that provide a comprehensive view of marketing performance across all channels.
Predictive Analytics. forecasts future performance, such as lead conversion and revenue generation.
What Do Users Like About Dreamdata?
- Comprehensive Attribution Insights. Dreamdata offers a full view of the customer journey, allowing users to assess how each marketing channel and touchpoint contributes to conversions [*].
- In-Depth Conversion Tracking. The platform tracks every step in a buyer’s journey, from first engagement to deal closure, helping marketers make strategic, data-driven decisions [*].
- User-Friendly and Insightful. Dreamdata’s intuitive interface is accessible to non-technical users and provides valuable insights into how marketing campaigns drive business outcomes. Exceptional customer support enhances the overall user experience [*].
What Do Users Dislike About Dreamdata?
- Steep Learning Curve. Some users find the platform’s reports overwhelming at first, with a notable learning curve. The cost can be a challenge for smaller businesses, making the investment a key consideration [*].
- Integration Challenges. Users report gaps in integration features, limiting the ability to track complex sales like upsells or access more detailed advertising data in ABM dashboards [*].
- Limited Custom Reporting. Dreamdata lacks flexible reporting options, especially for comparing different time periods, forcing users to manually switch between reports to analyze trends, which can be time-consuming [*].
Pricing
- Free. $0 per month.
- Team. $999 per month.
- Business. $2,499 per month.
- Enterprise. Custom.
Related reading: Bizible vs Dreamdata vs. Hockeystack: Head-to-Head Comparison
4. HubSpot Marketing Attribution
HubSpot’s Marketing Attribution tool is part of its comprehensive CRM platform, designed to track and analyze marketing efforts across the entire customer journey. It integrates data from various touchpoints, including email, social media, content interactions, and paid ads, into a single interface.
HubSpot’s attribution models include both first-touch and multi-touch approaches, giving teams flexibility in how they assess the effectiveness of their marketing strategies. These models help businesses track the impact of each channel on lead generation, nurturing, and closing deals.
The platform’s built-in analytics engine processes data in real-time, visualizing user journeys and enabling marketers to make data-driven decisions about where to invest resources for maximum marketing ROI.
Top Features
- Multi-Touch Attribution Models. Offers several marketing attribution models (first-touch, last-touch, linear, etc.), allowing businesses to assign credit to every interaction along the customer journey for a more accurate measurement of marketing performance.
- Dynamic Attribution Reports. Generates dynamic reports that can be filtered and customized to focus on specific time frames, segments, or marketing activities.
- Contact Timeline Tracking. Tracks every interaction a contact has with your brand, from initial website visits to email opens and social media clicks.
- Goal-Based Attribution. Allows marketers to set specific goals (such as form submissions, downloads, or purchases) and attribute credit to the marketing activities that contribute to achieving these goals.
- Content Attribution. Measures how specific pieces of content (e.g., blog posts, videos, case studies) contribute to conversions and revenue.
What Do Users Like About HubSpot Marketing Attribution?
- Comprehensive and User-Friendly. HubSpot Marketing Hub is known for its wide range of features, including journey automation, social media tools, and customizable templates, all within a user-friendly interface [*].
- Seamless CRM Integration. Small business owners appreciate HubSpot’s CRM integration, which works well with various advertising and communication channels, streamlining operations [*].
- Interconnected and Customizable Tools. Users value HubSpot’s ability to connect different business functions, from email marketing to deal tracking, and its robust customization options, particularly the landing page builder [*].
What Do Users Dislike About HubSpot Marketing Attribution?
- Limited Automation in Lower Plans. The basic plans offer limited automation, with more advanced workflows and email campaigns only available in the higher-priced Pro tiers [*].
- High Pricing Tiers. Users often express concerns about the steep pricing, which can limit small businesses from accessing more advanced features [*].
Data Management Issues. HubSpot can pose challenges with lead management and data integrity, especially if not properly maintained, and managing data between HubSpot and other systems can be complex [*].
Pricing
- Free. $0/month
- Starter. $20/month per seat
- Professional. $890/month (3 seats included)
- Enterprise: $3,600/month (5 seats included).
5. LeadsRx
LeadsRX is a leading B2B marketing attribution platform that delivers cross-channel attribution insights, making it easier for businesses to track and optimize marketing efforts across both digital and offline channels.
Compared to many traditional attribution tools, LeadsRX provides real-time insights into customer touchpoints, enabling businesses to connect the dots between marketing activities and revenue generation. This approach provides businesses a clear view of which campaigns and channels are delivering results, helping them eliminate wasted ad spend.
Top Features
- Offline Attribution (TV and Radio). Tracks offline marketing efforts such as TV and radio ads, attributing them to online and offline conversions.
- Touchpoint-Level Reporting. Breaks down performance at the touchpoint level, providing detailed insights into how each individual touchpoint, whether it’s a banner ad, social post, or TV spot, contributes to the customer journey.
- Competitive Benchmarking. compares campaign performance with industry benchmarks, providing insights into how well their marketing efforts stack up against competitors and areas for improvement.
- Universal Conversion Tracking Pixel. Provides a single tracking pixel that works across all marketing channels (digital, radio, TV, podcasts).
- Customer Journey Mapping. Visually maps the entire customer journey, showing every interaction a lead has with your brand across touchpoints.
What Do Users Like About LeadsRx?
- Valuable Growth Insights. LeadsRx provides in-depth data that helps users create strategic plans for acquiring new clients and expanding existing relationships, contributing to business growth [*].
- Flexible Data Visualization. Users appreciate the tool’s ability to present data in multiple formats, allowing customization to meet specific client needs and make the insights more relevant [*].
- User-Friendly Interface. The application offers responsive, intuitive design, making it straightforward for users to execute digital marketing campaigns. Its adaptability to different budgets, without forcing users into expensive plans for unnecessary features, is also seen as a positive aspect [*].
What Do Users Dislike About LeadsRx?
- Excessive Email Notifications. Users find the frequent email notifications overwhelming, with no simple way to reduce their frequency, leading to frustration [*].
- Dependence on External Platforms. LeadsRx’s reliance on external tools like Google and Adobe creates issues, especially when platform updates, ( such as Google’s transition from Universal Analytics to GA4), disrupt the tool’s functionality [*].
- Limitations in Tracking Live Mentions. The tool struggles to track live mentions in media like radio, leaving certain brand promotion efforts unrecorded, potentially undervaluing campaign effectiveness [*].
Pricing
- LeadsRX Attribution. Request pricing.
- LeadsRX Journey. Request pricing.
- Attribution for Agencies. Request pricing.
6. Adobe Analytics
Adobe Analytics is a web analytics platform designed to help businesses track, measure, and optimize customer interactions across digital channels.
The platform is equipped with advanced features like real-time analytics, predictive intelligence, and segmentation tools, enabling marketers to track key performance metrics, user journeys, and conversion rates.
In addition, Adobe Analytics integrates seamlessly with other Adobe Experience Cloud products, enhancing its ability to unify data from multiple touchpoints.
For example, Its AI-driven analytics, powered by Adobe Sensei, offer advanced capabilities such as anomaly detection, predictive modeling, and automated insights. This allows businesses to quickly identify trends, optimize customer experiences, and adjust their marketing strategies in real time.
Top Features
- Segmentation IQ. Automatically identifies key audience segments using machine learning, helping businesses target specific user groups with personalized content.
- Flow Analysis. Visually represents user navigation paths across a site or app. This feature helps marketers understand how users move between pages, identify bottlenecks, and optimize site flows for improved engagement and conversions.
- Anomaly Detection. Using AI-powered algorithms, it automatically identifies unexpected deviations in your data (e.g., unusual traffic spikes or dips in key metrics) ensuring immediate attention and response.
Report Builder. This is an Excel plug-in that allows users to pull data directly from Adobe Analytics into custom reports.
What Do Users Like About Adobe Analytics?
- Flexible Data Handling and Visualization. Adobe Analytics offers robust data analytics capabilities, allowing users to generate insights in various formats. Its customizable dashboard makes it easier to tailor data to specific needs [*].
- Seamless Integration. The platform integrates smoothly with marketing, analytics, and content management tools, making it highly effective for creating personalized marketing campaigns [*].
- User-Friendly Interface. With an intuitive and visually appealing interface, Adobe Analytics is accessible to non-technical teams, reducing the need for IT support [*].
What Do Users Dislike About Adobe Analytics?
- Lack of Feedback Mechanism and Storage Limitations. Users express frustration over the absence of a feedback system to improve functionality, as well as limited storage capacity, which hinders long-term project work [*].
- High Costs. Adobe Analytics is often seen as expensive, especially for smaller businesses with tight budgets, making it less accessible to those companies [*].
Integration Delays and Resource Demands. Some users experience delays when integrating Adobe Analytics with other platforms. Additionally, it requires significant server capacity, making it resource-intensive and costly to maintain [*].
Pricing
- Select. Request pricing.
- Prime. Request pricing.
- Ultimate. Request pricing.
7. Google Analytics 360
Google Analytics 360 is the enterprise-level version of Google Analytics, offering advanced features and capabilities tailored for large organizations that require more robust data handling, reporting, and analytics.
It is part of the Google Marketing Platform and provides enhanced data processing, deeper insights, and expanded reporting options compared to the standard version of Google Analytics.
The platform’s advanced attribution modeling allows businesses to apply customized attribution models across their data sets. This enables companies to accurately measure the performance of marketing channels and campaigns and determine how different touchpoints contribute to conversions.
Additionally, Analytics 360 offers data freshness with intra-day reporting and increased hit limits, allowing for more granular tracking and analysis in real-time.
Top Features
- Unsampled Reports. Provides access to unsampled reports, meaning you can analyze full data sets without sampling, even for large volumes of data.
- Custom Funnels. Enables businesses to create custom funnels that track user paths based on specific events or conditions.
- Custom Metrics and Dimensions. Creates custom metrics and dimensions that align with their specific business goals. This feature ensures more flexibility in tracking and reporting based on unique KPIs.
- Data Freshness. Provides faster data processing, with data typically available within 4 hours (compared to 24 hours for the standard version).
- Audience Sharing with Google Ads. enables seamless audience sharing between Google Analytics 360 and Google Ads. Marketers can build highly segmented audiences in Analytics 360 and then directly sync them with Google Ads for more precise targeting and retargeting.
What Do Users Like About Google Analytics 360?
- User-Friendly Dashboard. The dashboard offers multiple filtering options, allowing for tailored data analysis, which users find extremely beneficial for drilling down into specific metrics [*].
- Reliability and Simplicity. The platform is noted for its user-friendly interface, minimal bugs, and reliability, making it a preferred choice for continuous and hassle-free data analysis [*].
- Support and Continuous Improvement. Google Analytics 360 is praised for its comprehensive support system, including a well-documented help center and responsive feedback mechanisms [*].
What Do Users Dislike About Google Analytics 360?
- Data Reprocessing Limitations. Users express frustration over the inability to reprocess or recover incorrectly recorded or lost data, which can lead to significant information gaps [*].
- Complex Setup. The setup process is considered complex by some users, hindering the initial adoption and integration of the platform [*].
- Cost Prohibitive for Small Users. The high cost of Google Analytics 360 is seen as a barrier for small-scale users or businesses with limited budgets [*].
Related reading: Best Google Analytics 4 Alternatives and Competitors
Pricing
Contact sales for pricing.
8. AppsFlyer
AppsFlyer is a mobile attribution and marketing analytics platform that provides businesses with detailed insights into the performance of their mobile app marketing campaigns.
The platform tracks user interactions from various acquisition channels such as paid ads, social media, and organic traffic, attributing conversions and app installations to the appropriate sources. This helps businesses optimize their ad spend by understanding which channels, campaigns, or creatives drive the most engagement and conversions.
AppsFlyer’s real-time attribution engine enables marketers to track app installs, in-app events, and user behaviors with precision. The platform also offers advanced fraud detection and prevention tools, ensuring that businesses get accurate data by identifying and blocking fraudulent installs and clicks.
Top Features
- OneLink. This is a universal deep linking solution that dynamically routes users to the appropriate destination, whether it’s the app store, a website, or specific in-app content.
SKAdNetwork Support. AppsFlyer supports Apple’s SKAdNetwork, which allows marketers to measure campaign performance in iOS 14+ environments while respecting user privacy. This feature helps track conversions in a privacy-compliant way, particularly in response to Apple’s App Tracking Transparency (ATT) framework.
- Protect360 (Fraud Prevention). This is AppsFlyer’s anti-fraud solution that protects ad campaigns from mobile ad fraud, including click spamming, click injection, and install hijacking.
- Data Locker. Provides secure storage for raw, user-level data. This feature allows businesses to export, access, and analyze granular data outside of the AppsFlyer platform, enabling deeper insights and custom analysis using third-party tools.
- Rich Push Attribution. tracks the impact of push notification campaigns, attributing app reopens or other user actions to specific push messages.
What Do Users Like About AppsFlyer?
- Detailed Performance Tracking. AppsFlyer provides comprehensive insights into mobile app performance, tracking key metrics such as installs, user acquisition, retention, and revenue with high accuracy [*].
- Effective Data Management. Users appreciate AppsFlyer’s ability to track both organic and non-organic installs, offering reliable data and detailed reporting, which helps in making informed marketing decisions [*].
- Seamless Integration. AppsFlyer is praised for its seamless integration with various platforms, allowing centralized tracking of multiple ad sources, making it highly efficient for marketers [*].
What Do Users Dislike About AppsFlyer?
- Bugs and Interface Issues. Users report encountering bugs, especially in the event management section, where certain in-app events are hard to search or track, affecting the overall functionality [*].
- Steep Onboarding and Learning Curve. AppsFlyer has a complex onboarding process, with a significant learning curve for new users. The quality of support varies, making it challenging for smaller businesses to get timely assistance [*].
- Data Discrepancies and Fraud Detection Concerns. Some users note discrepancies in raw data reports, and there are concerns that the fraud detection system may flag legitimate activities, questioning its overall accuracy and fairness [*].
Pricing
- Zero. Free.
- Growth. 7¢ /conversion.
- Enterprise. Custom pricing.
9. Adinton
Adinton is a marketing attribution and optimization platform that specializes in helping businesses understand and optimize their ad spend across multiple channels.
The platform uses advanced attribution models to track and analyze user interactions with marketing campaigns, assigning appropriate credit to each touchpoint in the customer journey. This enables businesses to get a clear view of which campaigns, channels, and keywords are driving conversions and revenue, allowing for more precise budget allocation.
A key feature of Adinton is its ability to optimize bids and campaign performance dynamically, leveraging machine learning algorithms to adjust bids in real-time based on user behavior and conversion likelihood. This feature helps businesses maximize ROI by automatically shifting budgets toward higher-performing campaigns and channels.
Top Features
- Predictive Bid Management. Provides predictive bid management for paid advertising campaigns, using machine learning to adjust bids automatically based on real-time data.
- Click Fraud Detection. helps marketers detect and prevent click fraud by analyzing suspicious click patterns.
- Channel Performance Optimization. Offers insights into how different marketing channels contribute to conversions and revenue.
- Ad Performance Dashboard. Provides a comprehensive view of campaign performance across all channels. It displays metrics such as clicks, conversions, and revenue, allowing businesses to track KPIs and optimize their marketing strategy.
- Cost Aggregation and ROI Tracking. Aggregates cost data from various ad platforms, enabling businesses to measure ROI for each campaign or channel.
What Do Users Like About Adinton?
- Comprehensive Campaign Management. Users appreciate the real-time audience creation based on interests, which enhances targeting accuracy. Its predictive features help distinguish between potential buyers and non-buyers across platforms like Facebook, AdWords, and Twitter, improving marketing efficiency and boosting sales [*].
What Do Users Dislike About Adinton?
- Data Export Limitations. Users note a limitation in exporting tracking report data to Excel, which can restrict the ability to perform further analysis or share insights outside the platform, reducing the flexibility and usability of the data for some users [*].
Pricing
Starts at €300.
10. Factors.ai
Factors.ai is a B2B marketing analytics and attribution platform that provides businesses with insights into their marketing performance by connecting data across multiple channels.
It offers advanced multi-touch attribution models that track customer interactions throughout the entire funnel, from initial engagement to conversion. The platform also uses predictive analytics to forecast trends, identify high-value customer segments, and recommend optimization strategies for marketing efforts.
Factors.ai’s ability to track the buyer’s journey in granular detail allows marketers to understand the specific touchpoints and campaigns that are most effective in driving conversions.
Top Features
- Account-Based Marketing (ABM) Insights. Provides ABM-specific insights, tracking how target accounts engage with campaigns across multiple channels.
- Cohort Analysis. Allows users to analyze customer behavior by grouping them into cohorts based on shared attributes or behaviors.
- Lead Scoring Models. Ranks leads based on their engagement and behavior. This feature helps businesses prioritize the most promising leads for follow-up and nurturing, ensuring sales teams focus on high-potential opportunities.
- Segment-Level Reporting. Allows users to create custom audience segments and track their performance across marketing channels.
- Funnel Analysis. Tracks the progression of leads through the marketing and sales funnel, offering insights into where prospects drop off and where they convert.
What Do Users Like About Factors.ai?
- Immediate Traffic Quality Feedback. Factors.ai quickly provides insights into the quality of traffic from various channels, allowing users to assess the success of campaigns almost instantly [*].
- Easy Setup and Strong Support. Users appreciate the platform’s easy setup process and responsive customer support. Features like lead deanonymization and seamless integration with marketing tools enhance its practicality [*].
- Flexible and Easily Integrated. Factors.ai’s flexibility and quick responsiveness to user needs make it a popular choice. Its easy integration with existing tech stacks and user-friendly interface contribute to its widespread adoption [*].
What Do Users Dislike About Factors.ai?
- Complex Navigation. Users find the platform challenging to navigate, making it more suitable for dedicated marketing operations professionals rather than general marketers [*].
- Cumbersome Visitor Analysis Interface. The interface requires users to frequently switch between pages to analyze visitor activity, which can be time-consuming, especially for companies with many visitors [*].
- Data Synchronization Issues. Discrepancies between data in Salesforce and Factors.ai, along with glitches in segment views, create confusion and reduce trust in the accuracy of the platform’s data, complicating precise marketing efforts [*].
Pricing
- Free. $0 per month.
- Basic. $399 per month.
- Growth. $999 per month.
- Enterprise. Custom.
11. Attribution
Attribution is a marketing analytics and attribution platform that specializes in providing multi-touch attribution insights to help businesses understand how their marketing efforts contribute to customer acquisition and revenue.
The platform integrates data from a wide range of marketing channels, including digital advertising, social media, email campaigns, and CRM systems, to map the entire customer journey.
Attribution’s advanced attribution models, including time decay, linear, and position-based models, allow businesses to evaluate how different channels and campaigns impact conversion. Its flexible attribution framework provides marketers with the ability to customize models to reflect their unique sales cycles and customer behaviors.
Top Features
- Campaign-Level ROI Analysis. Tracks the ROI of individual campaigns by measuring the revenue generated relative to marketing spend.
- Conversion Path Visualizations. Provides visual representations of the paths users take before converting, making it easy to analyze the most common routes to conversion.
Granular Event Tracking. Allows for granular tracking of user actions, including clicks, form submissions, and video plays.
- Real-Time Reporting. Delivers real-time insights into campaign performance, allowing businesses to make immediate adjustments to their marketing strategies based on data-driven insights.
- Account-Based Attribution. Specifically designed for B2B marketing, this feature tracks the effectiveness of account-based marketing (ABM) efforts by attributing touchpoints to target accounts rather than individual leads.
What Do Users Like About Attribution?
- Ideal for E-commerce. Attribution is praised for its quick and easy setup, especially for e-commerce businesses using popular platforms. The built-in integrations and responsive support enhance the overall user experience [*].
- Simple Setup and Name-Based Attribution. Users appreciate the platform’s straightforward setup, which requires minimal technical knowledge. Its name-based attribution feature effectively links leads to specific pathways, providing clear insights [*].
- Seamless Integration with Major Platforms. Attribution integrates smoothly with major ad platforms, Segment, and Stripe, giving marketers valuable insights into organic traffic and revenue generation [*].
What Do Users Dislike About Attribution?
- Custom Integration Challenges. Users with unique setups face difficulties due to a lack of robust documentation and built-in integrations. Custom solutions often require extensive support through emails and calls [*].
- Dependence on External Tools. The need for additional tools like Segment complicates the setup process for users who don’t already have these tools, adding an extra layer of complexity [*].
- Performance Issues with Large Data Sets. The platform can struggle with performance, especially when dealing with large data sets or long date ranges, leading to slow load times and occasional timeouts [*].
Pricing
Not publicly disclosed. Request custom quote.
12. TripleWhale
TripleWhale is a performance analytics and attribution platform designed specifically for eCommerce brands to track and optimize their marketing efforts.
The platform integrates data from various sources like Shopify, Facebook Ads, and Google Ads, providing a unified view of marketing performance, customer acquisition costs (CAC), and return on ad spend (ROAS).
TripleWhale offers predictive analytics to forecast future sales and trends, allowing brands to adjust their marketing strategies in advance to maximize performance.
It also features customizable dashboards and reporting tools that allow eCommerce brands to monitor key performance indicators in one place. For instance, The Return on Ad Spend (ROAS) dashboard provides detailed insights into how well paid media campaigns are performing in terms of revenue generated compared to ad spend.
Top Features
- Creative Cockpit. Helps businesses optimize their ad creatives by analyzing the performance of individual assets such as images, videos, or headlines.
- Pixel Integration. TripleWhale includes its own tracking pixel, allowing businesses to collect detailed user data on their websites. The pixel captures a variety of events such as purchases, form submissions, and page views.
- Product Performance Analysis. Allows businesses to track the performance of specific products, showing how they contribute to overall sales and revenue.
- Net Profit Dashboard. Calculates and displays net profit after factoring in ad spend, COGS (Cost of Goods Sold), and other operational costs. The Net Profit Dashboard provides a clear understanding of profitability on a daily basis, making it easier for businesses to track financial health.
Post-Purchase Attribution. Tracks user actions even after a purchase, showing how post-purchase touchpoints (e.g., emails, upsells) contribute to repeat sales.
What Do Users Like About TripleWhale?
- Enhanced Campaign Monitoring. Triple Whale improves users’ ability to track and analyze campaign performance with real-time data aggregation from multiple platforms, allowing for more precise media spending and better results [*].
- Streamlined Client Management. For marketing agencies, Triple Whale enhances client reporting with clear and accurate metrics, building trust and satisfaction through reliable data [*].
- Multiple Attribution Models and Easy Integration. The platform offers a variety of attribution options and simplifies the integration of all paid media channels, making it easier to manage diverse advertising strategies [*].
What Do Users Dislike About TripleWhale?
- Difficult Cancellation and Billing Issues. Some users have faced challenges canceling their subscriptions, leading to continued billing despite attempts to terminate the service, causing frustration [*].
- Limited Ad Optimization Capabilities. Triple Whale doesn’t pass data back to platforms like Facebook to improve ad optimization, limiting its effectiveness for users who rely on dynamic campaign adjustments [*].
- Complex and Overwhelming Data. While Triple Whale offers advanced metrics, some users find the data overwhelming and too complex, making short-term decision-making more difficult instead of easier [*].
Pricing
- Growth. Starts from $1,290 per year.
- Pro. Starts from $1,990 per year.
- Premium. Starts from $2,790 per year.
- Premium+. Starts from $4,790 per year.
13. Branch
Branch is a mobile linking and attribution platform designed to help businesses track and optimize user interactions across different devices and channels.
The platform specializes in deep linking, which allows businesses to create seamless user experiences by directing users to specific app content, regardless of where they originate—whether from ads, emails, social media, or other sources. Branch’s deep linking technology ensures that users land on the exact content they expect, driving higher engagement and retention rates.
Top Features
- Link Routing Rules. Allows businesses to set up conditional rules for Branch links. For example, marketers can create different rules for routing users based on platform, country, or device type, optimizing the user experience for each segment.
- NativeLink™. Branch’s NativeLink technology improves deep linking performance across social platforms, where traditional deep links may not work as intended.
- Journeys (Smart Web-to-App Banners). Enables businesses to create customizable web-to-app banners that encourage users to download or engage with the app.
- Branch Links API. Enables developers to generate dynamic, trackable links programmatically. The Branch Links API can be integrated into existing workflows, enabling automatic link creation for specific user segments, campaigns, or products.
- Deferred Deep Linking. Branch allows deferred deep linking, meaning users who do not have the app installed are directed to the app store, and upon installation, are taken to the intended in-app content.
What Do Users Like About Branch?
- Responsive Customer Support. Branch is praised for its prompt and helpful customer support, ensuring users get the assistance they need to enhance their experience [*].
- Effective Cross-Platform Tracking. Branch excels in tracking installs across various ad partners and provides quick links for campaign performance monitoring. It also adapts well to user engagement tracking, particularly navigating challenges with iOS limitations [*].
- Robust Analytics and Integrations. Users appreciate Branch’s detailed analytics and reporting tools, which provide comprehensive insights for optimizing performance and making informed decisions [*].
What Do Users Dislike About Branch?
- Complex Features and High Pricing. Some users find certain features less intuitive, requiring a deep dive into documentation. Additionally, the pricing can be steep, making it less accessible for smaller businesses or startups [*].
- Challenging Configuration. The setup and integration process, especially with third-party platforms, can be complicated and difficult for users without technical expertise [*].
- Data Reporting Discrepancies. Users occasionally report discrepancies in install numbers across sources, leading to confusion and affecting the accuracy of campaign tracking and attribution [*].
Pricing
- Self-serve. $0 per month.
- Enterprise. Custom pricing.
14. Windsor.ai
Windsor.ai is a marketing attribution and data integration platform that provides businesses with detailed, multi-channel insights into their marketing performance.
The platform collects data from a wide range of sources, including advertising platforms, CRM systems, and analytics tools, to create a unified view of the customer journey. Windsor.ai connects this data to various attribution models, allowing businesses to track which marketing activities drive the most revenue and conversions across both online and offline channels.
Windsor.ai also supports multi-touch attribution, offering customizable models such as first-touch, last-touch, linear, and time-decay. This flexibility allows businesses to tailor attribution models to their specific sales cycles and customer behaviors, ensuring they receive accurate and actionable insights.
Top Features
- Marketing Mix Modeling (MMM). Analyzes the effectiveness of different marketing channels and helps allocate budget more effectively.
- Multi-Currency Reporting. Supports multi-currency reporting for businesses operating in different regions. This feature converts revenue and cost data into multiple currencies, helping global businesses track their financial performance across regions.
- Real-Time Attribution. Provides real-time data collection and reporting, allowing marketers to monitor campaign performance as it happens.
- Advanced Data Integrations. integrates with over 50+ marketing platforms, including Google Ads, Facebook Ads, HubSpot, Salesforce, and Google Analytics.
- Customizable Dashboards. Allows users to visualize marketing performance metrics, such as conversions, revenue, and ROI. These dashboards are tailored to specific needs and help teams monitor KPIs across campaigns and channels.
What Do Users Like About Windsor.ai?
- Highly Responsive Customer Service. Windsor.ai is commended for its excellent customer service. Users appreciate the timely and efficient support provided by the development team, which adds new features upon request [*].
- User-Friendly Interface. Users appreciate its ease of use and the speed with which data loads, making it a convenient choice for users looking to work efficiently [*].
- Powerful Data Integration. Windsor.ai allows users convert data sources to desired destinations, simplifying complex tasks like incorporating social metrics into reports [*].
What Do Users Dislike About Windsor.ai?
- Data Accuracy Issues. Users report problems with data accuracy, particularly with API integrations not pulling data correctly [*].
- Cost and Support Concerns. Some users find the platform expensive given the features offered, and express dissatisfaction with the level of priority given to support requests based on payment levels. This has led to perceptions of the tool being less valuable for those on tighter budgets [*].
- Interface Complexity. While Windsor.ai is generally user-friendly, some non-technical users find the interface challenging to navigate initially. This learning curve can deter those who need to quickly adapt to new tools [*].
Pricing
- Free. $0 per month.
- Basic. $19 per month.
- Standard. $99 per month.
- Plus. $249 per month.
- Professional. $499 per month.
- Enterprise. Custom pricing.
15. Oktopost
Oktopost is a B2B social media management and employee advocacy platform designed to help businesses manage, track, and optimize their social media efforts at scale.
It focuses on delivering advanced analytics and attribution insights, enabling businesses to link social media activities (from LinkedIn, Facebook and X (formerly Twitter)), directly to lead generation, customer acquisition, and revenue growth.
This gives businesses a clear picture of which posts, campaigns, or social channels drive the most engagement and conversions. This attribution data enables marketers to fine-tune their social media strategies, optimize content, and allocate resources to the most effective channels.
Top Features
- Social Listening and Monitoring. Allows businesses to track social media conversations in real-time.
- B2B Social Media Analytics. Provides detailed analytics designed for B2B marketers, offering insights into key metrics such as engagement, reach, and lead generation.
- Social Campaign Tracking. Tracks the performance of social media campaigns, providing data on clicks, conversions, and leads generated.
- UTM Tracking. Supports UTM tracking for all social media posts, enabling marketers to track the effectiveness of specific campaigns and understand how traffic flows from social platforms to websites and landing pages.
- Advanced Segmentation. Enables marketers to segment their audience based on behavior, demographics, and engagement.
What Do Users Like About Oktopost?
- Advanced Data Analytics. Oktopost is recognized for its robust data analysis capabilities, providing deep insights that are crucial for making informed decisions [*].
- Ease of Use and Integration. Oktopost offers user-friendly interface and integration capabilities, particularly with platforms like Microsoft Teams, which streamline workflow and communication [*].
- Comprehensive Platform. Users appreciate it as an all-in-one solution for analytics and reporting, making it possible for individuals to efficiently manage social media strategies on their own [*].
What Do Users Dislike About Oktopost?
- Time Zone Management. Users face challenges with managing time zones, particularly when coordinating posts across different geographical locations, like the US and Europe. This limitation can lead to scheduling errors and confusion among international teams [*].
- Tagging and Posting Limitations. Some users find the tagging capabilities within the posting tool limited and complex, often requiring manual adjustments on social media sites [*].
- Feature Limitations Compared to Competitors. Oktopost is perceived to have fewer features than some of its competitors, particularly in areas like image and title customization in posts, and comprehensive reporting [*].
Pricing
Not publicly available. Contact sales to learn more.
16. Adjust
Adjust is a mobile attribution and analytics platform designed to help businesses track and optimize their app marketing campaigns. It provides detailed insights into user acquisition, in-app behavior, and the performance of advertising channels.
The platform integrates with various ad networks, enabling comprehensive tracking of paid and organic user acquisition.
Adjust’s advanced attribution models offer flexibility, allowing businesses to choose between single-touch and multi-touch attribution models. This enables marketers to accurately assign credit to different touchpoints within the user journey, from initial app discovery to post-install events.
Top Features
- Deep Linking. Supports advanced deep linking to direct users to specific in-app content, improving user experience and engagement, while tracking the attribution source.
- Fraud Prevention Suite. Detects and blocks fraudulent activities like click injection, click spamming, and install hijacking.
- Subscription Tracking. Tracks subscription events, allowing businesses to monitor and optimize subscription-based revenue models.
- In-App Event Tracking. Tracks in-app events such as purchases, level completions, and user engagement. This feature provides granular insights into how users interact with apps post-installation, helping optimize in-app monetization strategies.
- Mobile Attribution. Measures mobile app installs and user actions, assigning credit to the correct marketing channels and campaigns.
What Do Users Like About Adjust?
- Fraud Prevention and Real-Time Data. Adjust stands out for its robust fraud prevention features and real-time data visualization, making it easier to monitor live campaigns [*].
Excellent Customer Support. Users commend Adjust for its strong customer support, offering comprehensive training and quick technical assistance. The interface is simple and convenient, enhancing the user experience [*].
- Effective App Performance Tracking. Adjust helps users accurately track and analyze app performance, enabling more informed marketing decisions and improved user acquisition strategies [*].
What Do Users Dislike About Adjust?
- Tracker Management. Users face challenges with managing old or unused trackers in Adjust. When these trackers misfire, users incur unnecessary costs [*].
- Inaccurate Data. Particularly on the iOS side, Adjust is reported to not provide 100% accurate data. Additionally, the graphical report displays are considered confusing, and the report downloading feature lacks flexibility in file customization [*].
- Complex Setup. Some users find Adjust complex to set up and configure, which can be time-consuming and require substantial technical expertise [*].
Pricing
- Base. Free.
- Core. Contact sales.
- Enterprise. Contact sales.
17. SegMetrics
SegMetrics is a marketing attribution and analytics platform that helps businesses track, measure, and optimize the performance of their marketing efforts by connecting revenue data with customer behavior.
It provides detailed insights into the ROI of marketing campaigns, enabling businesses to understand which channels, funnels, and touchpoints are driving conversions and revenue growth.
In addition, its advanced cohort analysis features allow businesses to segment customers based on their behaviors and actions
SegMetrics also integrates seamlessly with popular marketing automation tools, CRMs, and advertising platforms, offering a unified view of customer journeys and campaign performance.
Top Features
- Lifetime Analytics. Provides lifetime analytics on customers, tracking every interaction they have with the business from the first touch to final purchase and beyond.
- Cross-Channel Attribution. Consolidates data from multiple marketing channels (paid ads, organic traffic, email, etc.) into one platform.
- CRM and Marketing Automation Integration. Integrates with popular CRM and marketing automation platforms such as HubSpot, ActiveCampaign, and Infusionsoft.
- Subscription and Payment Tracking. Allows businesses to track recurring payments and subscriptions, linking them to the marketing efforts that led to customer acquisition.
- Ad Spend Attribution. Connects advertising spend to specific conversions and revenue, allowing businesses to measure the performance of paid media campaigns.
What Do Users Like About SegMetrics?
- Effective Marketing Attribution. Users appreciate the simplicity of determining where high-quality leads originate, facilitating more efficient media buying and scaling [*].
- User-Friendly Interface. While the setup is straightforward, the platform is also praised for its ease of use compared [*].
- Clarity on Sales Impact. SegMetrics provides clear insights into which advertising platforms are driving actual sales, helping to identify the most profitable leads and their long-term value [*].
What Do Users Dislike About SegMetrics?
- Need for Better Onboarding. There is a call for more comprehensive onboarding resources, such as detailed tutorials or courses, to help users maximize the tool’s capabilities [*].
- Complexity in Customization. While the platform offers significant flexibility in reporting and modeling, it requires a deep understanding of data, which can slow down the realization of its value [*].
Billing Issues. Some users have experienced significant challenges with billing, particularly with being charged post-cancellation, which has led to frustration and trust issues [*].
Pricing
- Essentials. Starts from $95 per month.
- Intelligence. Starts from $295 per month.
- Business. Starts from $565 per month.
- Custom. Custom pricing.
18. RockerBox
Rockerbox is a marketing attribution platform that provides businesses with detailed insights into their multi-channel marketing efforts, helping them optimize campaigns and maximize ROI.
The platform is designed to unify data from various sources, including digital advertising, social media, offline channels, and customer interactions, to give businesses a comprehensive view of how marketing activities drive conversions.
Rockerbox offers advanced multi-touch attribution models, which provide businesses with a granular understanding of the effectiveness of each marketing channel. It also integrates seamlessly with popular tools like Google Ads, Facebook, and programmatic platforms, making it easy to gather data from multiple sources.
Top Features
- Unified Marketing Data Hub. Rockerbox unifies all marketing data from online and offline channels into a single platform.
- Real-Time Data Ingestion. Supports real-time data ingestion, allowing marketers to track user interactions and campaign performance as they happen.
- Offline Attribution. Tracks the effectiveness of offline marketing efforts, such as TV ads, radio, direct mail, and out-of-home advertising, and ties them to online conversions.
- Lookback Windows. Adjusts the attribution lookback windows to fit their sales cycles. This feature ensures that the assigned credit accurately reflects the time it takes for leads to convert.
- API Integration. Integrates via APIs with a wide range of marketing tools, CRM systems, and data platforms.
What Do Users Like About RockerBox?
- Efficiency in Ad Spending. Users report significant budget savings in paid advertising while maintaining revenue levels by identifying and optimizing ad impressions [*].
- Intuitive Use. Users find Rockerbox easy to use and effective right from the start, appreciating the technology behind its ability to display all marketing channels in one view for smarter decision-making [*].
- Supportive Service. The Rockerbox team is noted for their exceptional customer service, actively seeking feedback and offering assistance to ensure users fully benefit from the platform’s capabilities [*].
What Do Users Dislike About RockerBox?
- Challenging Setup. The initial setup process can be tedious and resource-intensive, requiring significant technical support and time investment, which may hinder early adoption [*].
Integration Limitations. Challenges with integrating view-based channels and additional charges for certain services have been noted [*].
Data Sharing Restrictions. The inability of some platforms to share comprehensive impression data complicates the accuracy of view-through conversion analytics [*].
Pricing
Pricing information is not publicly available. Contact sales to learn more.
19. NorthBeam
NorthBeam is a marketing attribution platform built specifically to help e-commerce businesses track, analyze, and optimize their customer acquisition and conversion efforts.
Unlike general attribution platforms, NorthBeam focuses on providing deep insights into the e-commerce customer journey, helping businesses identify which marketing touchpoints are driving the most value.
The platform’s powerful analytics engine provides detailed cohort analysis, enabling marketers to segment audiences based on behavior and campaign engagement.
In addition, it offers real-time reporting, which allows businesses to track key performance indicators , such as ROAS, CAC, and revenue attribution.
Top Features
- User-Level Data Insights. Tracks individual user interactions and provides granular data on how users engage with marketing content across various channels.
- Automated Reports. Offers automated reporting that delivers regular insights into campaign performance, including conversions, ROI, and customer acquisition cost (CAC).
Cost Data Aggregation. Pulls in cost data from multiple ad platforms (Google Ads, Facebook Ads, etc.), giving marketers a clear view of how much is being spent across different channels. It helps businesses calculate and optimize their cost-per-acquisition (CPA).
- ROAS Reporting. Evaluates how much revenue each marketing channel generates in comparison to the ad spend.
- Real-Time Data Tracking. Tracks marketing performance in real-time, offering immediate insights into campaign effectiveness. This feature allows marketers to make quick adjustments to optimize campaign performance based on live data.
What Do Users Like About NorthBeam?
- Detailed Insights on Customer Behavior. Northbeam’s detailed insights into customer behavior and sales performance are highly valued for making quick and effective business decisions [*].
- Supportive Team and Clarity in Reporting. The platform offers user-friendly reports and a supportive team, making complex multi-channel marketing concepts easier to explain and manage [*].
- Comprehensive Insight and Optimization. NorthBeam provides deep insights that enable businesses to optimize their marketing programs more effectively. Users also appreciate the clean UI for its speed and ease of use [*].
What Do Users Dislike About NorthBeam?
- Limited Product Sales Visibility. Users desire more features, such as visibility into which products are selling through which channels, to better understand performance by product type [*].
- High Costs for Smaller Operations. The expense associated with Northbeam makes it less suitable for smaller eCommerce brands, which might benefit from more affordable solutions [*].
Modeled Data Limitations. The reliance on modeled data restricts access to blended performance reports [*].
Pricing
- Starter. $1,000 per month.
- Professional. $2,500 per month.
- Enterprise. Custom pricing.
HockeyStack: The Solution for Easy and Accurate Revenue Attribution
No code. Simple set up. Accurate revenue attribution. That’s all you get with HockeyStack.
Many attribution tools claim to offer seamless, accurate tracking, but too often they fall short.
From issues like outdated interfaces, slow data processing, down to reliance on third-party cookies, these platforms complicate the process.
In fact, in some instances you’ve likely encountered limitations that create blind spots in your data, forcing you to piece together fragmented insights and miss out on key opportunities to optimize your campaigns.
💡Read Case Study →How Delve Scaled Demos Booked with HockeyStack’s AI Analyst
But with HockeyStack, those frustrations disappear. Whether it’s real-time data analysis or cookie-less tracking that adapts to privacy regulations, HockeyStack gives you the tools you need to make smarter decisions faster.
No more struggling with outdated features or delayed data — HockeyStack integrates effortlessly into your existing systems, allowing you to see the full picture without jumping through hoops.
Choosing HockeyStack isn’t just about picking another tool — it’s about investing in a solution that works as hard as you do.
If you’re aiming for accurate multi-touch attribution, seamless integration, or future-proof tracking, HockeyStack is the platform that delivers where others fall short.
Ready to experience effortless attribution? Start with HockeyStack today.
FAQs
Why is unifying data so important for accurate attribution?
Accurate attribution is impossible without unified data. Your customer interacts with multiple channels (ads, website, email, sales calls) managed by different tools. If your attribution software can't connect all these touchpoints into a single, chronological journey, it's working with an incomplete picture. Unifying data ensures your attribution model sees every interaction, giving you a trustworthy view of which efforts actually influenced the deal.
How does AI actually improve marketing attribution?
AI takes attribution beyond simple rule-based models. Instead of just following predefined rules (like giving 40% credit to the first touch), an AI marketing agent like HockeyStack's Odin analyzes all your historical customer journey data. It uses machine learning to identify the complex patterns and touchpoints that have the highest statistical correlation with winning deals for your specific business. This results in a more accurate, data-driven, and often custom attribution model.
How do I choose the right attribution model for my business?
There's no single perfect model. The best approach is to start by moving away from flawed single-touch models. For most B2B companies, a multi-touch attribution model like U-shaped or W-shaped is a great starting point as it balances key conversion milestones. The ultimate goal is often an AI-driven (algorithmic) model, as it's the most accurate, but requires a platform capable of unifying data and running the analysis. The right model is the one that gives you the clearest, most actionable insights based on your specific sales cycle and GTM motion.
Can HockeyStack track offline touchpoints like events or direct mail?
Yes. While HockeyStack automatically captures all digital touchpoints, you can easily import offline interaction data (like trade show attendance lists or direct mail campaign recipients) via CSV or integrations. This allows you to include crucial offline activities in your buyer journey mapping and attribution models, giving you a complete picture of performance across all channels.