CFO-Proof Marketing
Accurate forecasting is not just for CFOs, but for everyone. This 3-part blog reveals our journey of growth acceleration and demonstrates how HockeyStack enables CFO-level forecasting.
Part I
The impact of Google Ads on B2B marketing has turned out to be more significant than initially expected, though not entirely in a positive way. Often praised as transformative, especially for introducing the idea that nearly every aspect of marketing is measurable and predictable, this concept has fundamentally shifted how marketers approach campaigns and the expectations finance teams hold for marketing efforts. However, this perspective deserves a thorough critique.
Google Ads has indeed revolutionized B2B marketing by introducing a level of measurability previously unseen. It emerged as a pivotal change, offering clear insights into the effectiveness of ads through metrics such as cost per impression, clicks, and conversions, thereby revealing the exact cost of acquiring a customer. The premise was compelling: if you can measure it, you can scale it.
However, this emphasis on quantifiable outcomes has led to a narrow definition of success, prioritizing immediate results over broader, strategic objectives such as demand creation and brand awareness activities. CEOs and finance teams started asking the same toxic question: "If we can generate cheaper conversions from Google, why not allocate more budget there?"
The problem with Google Ads arose when it became clear they were great at tracking direct ad responses but missed the more nuanced aspects of marketing, like the impact on brand presence. This gap led to predictions that often missed the mark, with strategies skewing towards quick wins over long-term objectives. The thinking went something like this: if 10 conversions cost $100, then 100 conversions should cost $1000, right? That was the illusion sold by Google.
Over time, it became clear that in-platform metrics alone couldn't measure or forecast all essential elements, and single-touch attribution models were inadequate for understanding and optimizing the customer journey. Reflecting the fundamental principle of macroeconomics, demand was finite; without enough volume, conversions would drop. Google realized this and introduced multi-touch models and broad match to keep showing marketers that they were doing well.
This illusion peddled by Google created a significant gap in the forecasting process, leading to increased costs and lower volumes. Consequently, CEOs and CFOs began handling their forecasting instead of relying on marketing, highlighting a crucial gap in strategic planning.
Part II
I remember the first time my CMO asked me to work on an alternative budget model. Not so long ago, but in startup years, it feels like a decade. She mentioned the revenue team was working on their budget model, but since we're the ones monitoring the channels and spending the money, we needed to develop our own model and forecast. This way, we could compare our data with their projections.
Unlike traditional models, she said I should start from the bottom and reverse engineer it. So let's say—these numbers are completely fictional—our monthly revenue target was $1M, and we knew that the average SQO:CW conversion rate was 10%. Then we'd need a $10M pipeline to close $1M (For the sake of simplicity, I'm ignoring the sales cycle lengths and sales performance commitments).
So, we needed a $10M pipeline; our ACV was $50K, which meant that we had to generate 200 SQOs. Considering that our MQL:SQO conversion rate was 20%, this meant that to generate 200 SQOs, we needed 1000 MQLs. Perfect.
Our cost per lead—which heavily relied on demand capture—was $100. This meant that to generate 1000 MQLs with this cost per lead, we'd need a $100K budget.
We were generating around 700 MQLs then, and we estimated that the cost per lead would increase as we generated more MQLs, since more companies would target our audience and our ICP wouldn’t grow that fast. So, we estimated that the cost per lead was going to increase by 15%, which left us with a $115K budget.
Then she said something I didn't fully understand at that time—"we're disregarding the brand impact." She mentioned our G2 ranking was improving, and we were seeing more traffic and conversions from there; we were investing in the brand, running our first reach campaigns, and considering sponsoring podcasts and events. She said we needed to try to calculate the impact of the brand, and we created three versions: low-brand investment, mid-brand investment, and high-brand investment.
Each scenario would have different outcomes. For instance, if organic website traffic increased by 10%, and considering we have a 10% demo form conversion rate from organic users, then a 10% increase in organic traffic would equate to a 1% increase in demo requests.
Since there was going to be an increase there, actually, we wouldn't need to generate 1000 MQLs, but rather 990 MQLs from the paid channels—it was the impact of the brand. (oversimplified)
Once we created that plan, we realized that our numbers were significantly different from what finance was forecasting. They were only relying on the current numbers and assuming that if we were investing $10K and generating 20 MQLs, then investing $20K would generate 40 MQLs—assuming that everything would stay the same without any changes. But nothing stays the same: the world changes, stars die, humans get older, and black holes grow. It's all part of entropy.
From our side, we were also trying to forecast something that wasn’t really forecastable—we were using the historical paid data, yes, but also trusting our gut since we had no historical data about the potential outcomes of brand investment.
We spent weeks developing that model and even more weeks getting it approved.
More than three years have passed since then.
I've created similar models for Cognism, Kaspr, and Mailtastic, where I led the paid growth, and for ten other companies where I advised on the entire growth — but this has always been the case; we had to estimate. And CFOs have never liked estimations.
Fast forward to today. There’s HockeyStack. It feels like the early-internet age, when people started sending emails in seconds instead of mails in days.
I think I haven’t really talked about why I joined here in the first place. I was one of their first customers back in 2021 - they were the first tool I brought in when I started at Cognism in 2022. In these three years, they’ve built the product I’ve always needed. The product that I started to use more than anything else. I thought, how many times does one have a chance to work on a product that they love, and believe in?
And things have been going really well since - well as in, HockeyStack grew by 2x in revenue in the last 95 days. So I decided to write this bit to explain how I use HockeyStack for HockeyStack’s growth, and how you can use it to create accurate forecasting for your company—CFO-level accurate.
Part III
Unified Analytics & Reverse Funnels
The first step starts with understanding the micro-level data—what's influencing what to what extent? So, I begin by analyzing the pipeline and revenue with both linear and uniform attribution models to understand the impact of online activities. I mainly look at two things: channel ROI and sales velocity.
Then, I create reverse funnels to understand the influence of marketing and sales touchpoints in different circumstances—such as the influence of outbound emails after the first website visit vs. before the website visit in the enterprise deals; if we send the HockeyStack Labs newsletter after the pricing page view, will this actually increase our ACV? Do we lose more deals if they see certain ads on certain platforms?
Cohort Tables
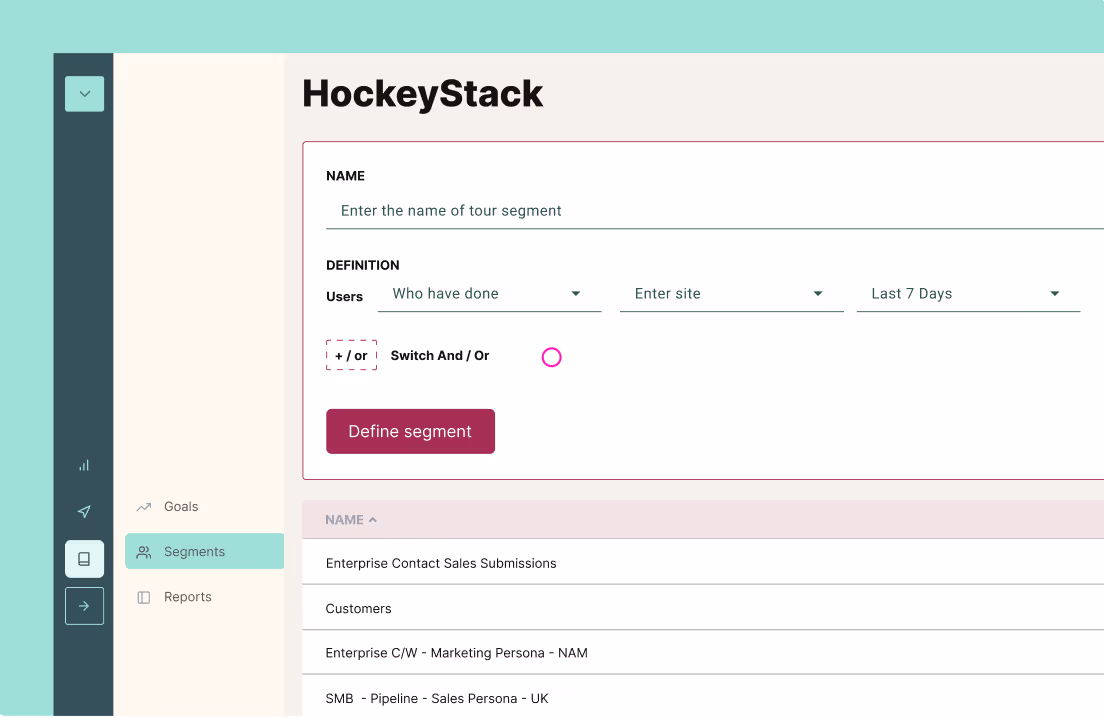
This is the second step: understanding your ICP. It’s common for most companies to have more than one ICP, but who is your most profitable ICP? What's the difference between their sales cycles and ACVs? This is the first step because you can’t create forecasting without knowing who you are going to sell to.
I do this exercise every quarter because what we see in the pipeline is volatile; it changes constantly, and there’s always a time lag from impression to conversion, especially if you have long sales cycles and large buyer committees. I use cohort tables to filter deals by region, company size, and buyer persona to see which customers had the highest ACV, which industries caused more closed-lost deals, and what size of companies have the fastest sales cycle.
Once I see patterns, I then analyze journeys independently to see if what I’m seeing was caused by a specific channel, activity, campaign, or ad; or is it happening everywhere. And then I visualize these trends over months and compare buyer personas, sales cycles, and ACVs all together with the time lag between impressions to conversions.
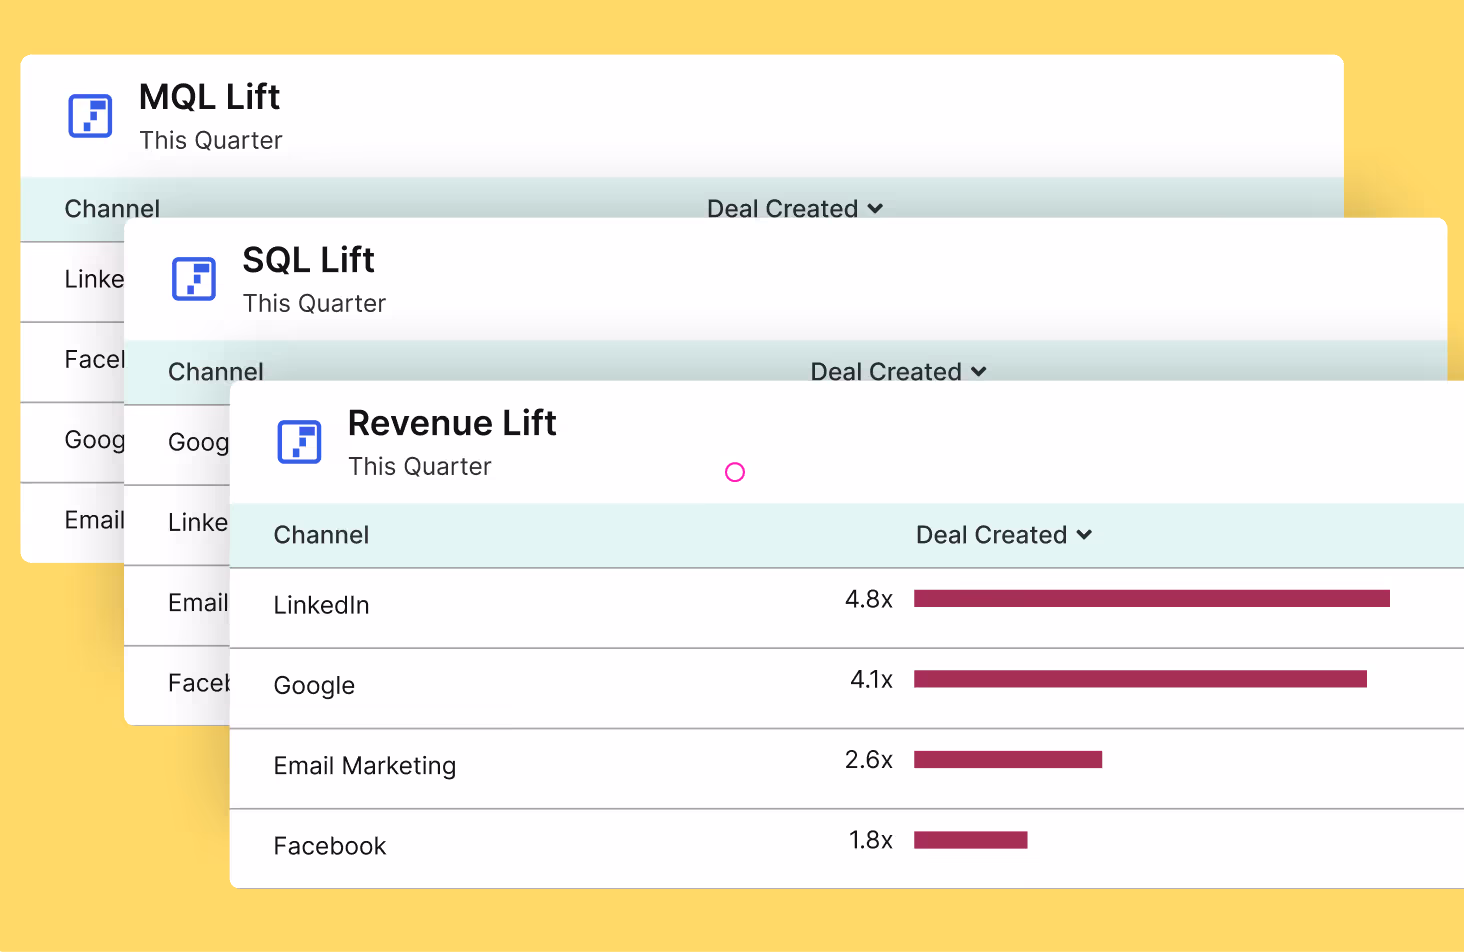
Lift Reports
The third part of my strategy involves lift analysis, where I try to understand the causal influence of marketing activities. Now, after the first step, I know who I should be spending my budget on, what's bringing in revenue to what extent, and what's not - but how can I understand the causal impact of certain activities and touchpoints so that I can build my paid and offline strategies accordingly?
So, I create control groups to understand if there were any channels or activities that influenced revenue more than others in these personas. This means that I create retroactive control groups, like what's the pipeline lift of my connectedTV campaign at the marketing directors' persona level for software companies, or what’s the pipeline lift of people who said “podcast” in the Gong recordings or self-reported attribution answers.
These lift incrementality reports also help me to validate what I see in the multi-touch attribution reports. For example, we know that it's not only about conversions, but it's about the entire buyer journey. So, by using multi-touch attribution and lift incrementality together, I can see what pre- and post-deal touchpoints my ICP engages with, and how much these touchpoints influence my revenue.
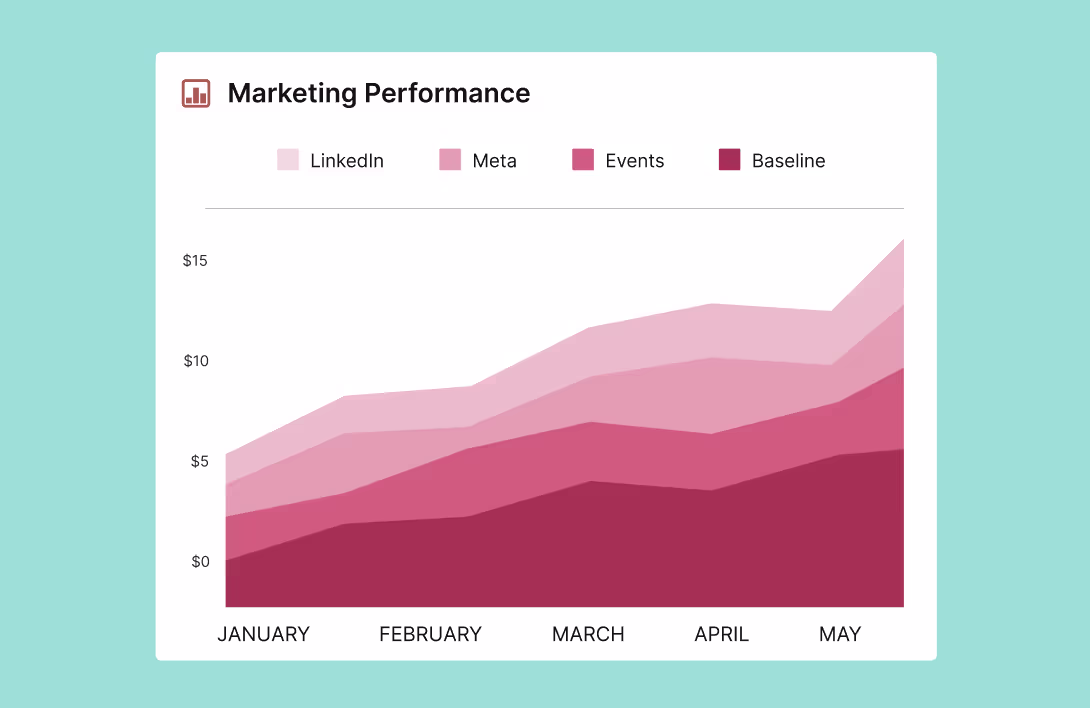
Modeling
The fourth part involves marketing mix modeling, where I measure the incremental contribution of macro-level activities. So, in the second part, I observe the relationship between different activities and their contributions to revenue. With marketing mix modeling, I measure this contribution on the macro level, not focusing on campaigns or ads anymore, but on online and offline levels on a high-level - especially now that we’re sponsoring events and podcasts.
More importantly with MMM, I can easily simulate different budget scenarios such as what would have happened if I had allocated a different amount of budget to Linkedin last quarter; which channels could have used more budget, where the growth came from, and where I could have done a better job.
Forecasting
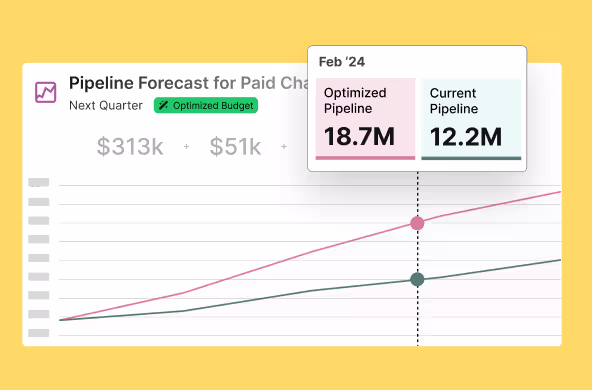
The last part involves forecasting and budget optimization. With modeling, I see what would have happened if I had a different budget for different scenarios; now, I apply this for the next quarter. Based on historical data, I create different budgets and targets to estimate growth rates. For example, what would I need to reach x% more pipeline this quarter?
But the important thing here is that it’s not just about historical data; it’s about prediction. Based on the historical trends, HockeyStack can predict growth over a specific time period - so with a couple of clicks, I can see what the growth rate of the Linkedin pipeline will be in the next 45 days or which channels can help me grow more efficiently in the next quarter. Therefore, by using forecasting, I plan the budget allocation, manage the budget, and create the quarterly forecast easily - just in a couple of hours instead of weeks!.
That’s why I’m trying to distance HockeyStack from the attribution category, because it's not just attribution; it's a revenue movement, a movement where we understand the past and change the future, where we end the fight between sales and marketing. It's a revenue revolution.
To highlight the importance of this, we got a rebrand two weeks ago and launched two new products alongside many new features. Now everything I used at HockeyStack in the last three months is available to customers.
For this revenue revolution, I couldn’t think of a better way to partner up with a CFO that I truly respect, a CFO that I grew up with, David Wallace.
Accurate forecasting is not just for CFOs, but for everyone.
Odin automatically answers mission critical questions for marketing teams, builds reports from text, and sends weekly emails with insights.
You can ask Odin to find out the top performing campaigns for enterprise pipeline, which content type you should create more next quarter, or to prepare your doc for your next board meeting.
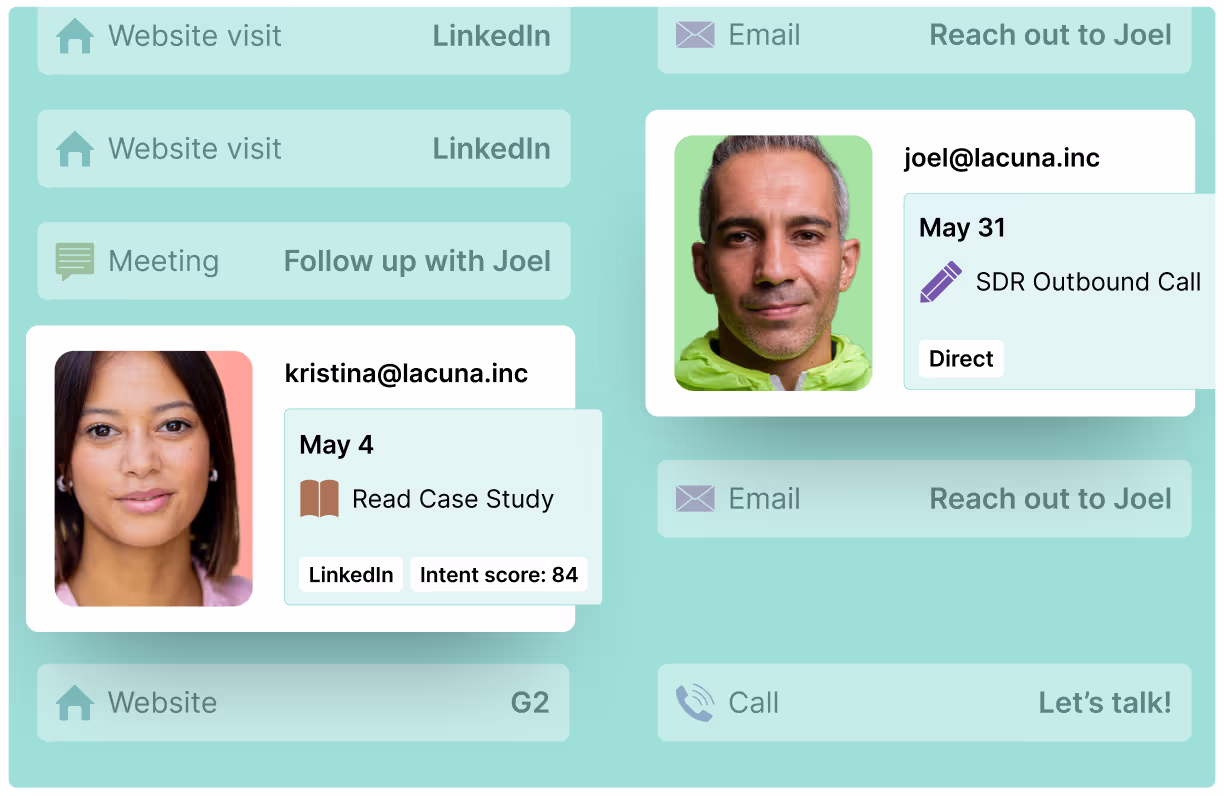
Nova does account scoring using buyer journeys, helps automate account research, and builds workflows to automate tasks.
For example, you can ask Nova to find high intent website visitors that recently hired a new CMO, do research to find if they have a specific technology on their website, and add them to the right sequence.
Our customers are already managing over $20B in campaign spend through the HockeyStack platform. This funding will allow us to expand our product offerings, and continue to help B2B companies scale revenue with AI-based insight products that make revenue optimization even easier.
We are super excited to bring more products to market this year, while helping B2B marketing and sales teams continue driving efficient growth.
A big thank you to all of our team, investors, customers, and friends. Without your support, we couldn’t have grown this fast.
Reach out if you want to learn more about our new products and check out HockeyStack!
About HockeyStack
HockeyStack is the Revenue Acceleration Platform for B2B. HockeyStack integrates with a company’s CRM, marketing automation tools, ad platforms and data warehouse to reveal the ideal customer journey and provide actionable next steps for marketing and sales teams. HockeyStack customers use this data to measure channel performance, launch cost-efficient campaigns, and prioritize the right accounts.
About Bessemer Venture Partners
Bessemer Venture Partners helps entrepreneurs lay strong foundations to build and forge long-standing companies. With more than 145 IPOs and 300 portfolio companies in the enterprise, consumer and healthcare spaces, Bessemer supports founders and CEOs from their early days through every stage of growth. Bessemer’s global portfolio has included Pinterest, Shopify, Twilio, Yelp, LinkedIn, PagerDuty, DocuSign, Wix, Fiverr, and Toast and has more than $18 billion of assets under management. Bessemer has teams of investors and partners located in Tel Aviv, Silicon Valley, San Francisco, New York, London, Hong Kong, Boston, and Bangalore. Born from innovations in steel more than a century ago, Bessemer’s storied history has afforded its partners the opportunity to celebrate and scrutinize its best investment decisions (see Memos) and also learn from its mistakes (see Anti-Portfolio).

