HockeyStack Academy 101 - Building a Basic Report
This guide will help you build a basic report.
In HockeyStack, navigate to Definitions > Reports.
This page is your dictionary of reports.
You can click on the + icon on the top right corner to create a new report.
Basic reports are:
- a set of numbers
- broken down by a property,
- and optionally, filtered to show a certain segment
The reporting screen is organized in this format.
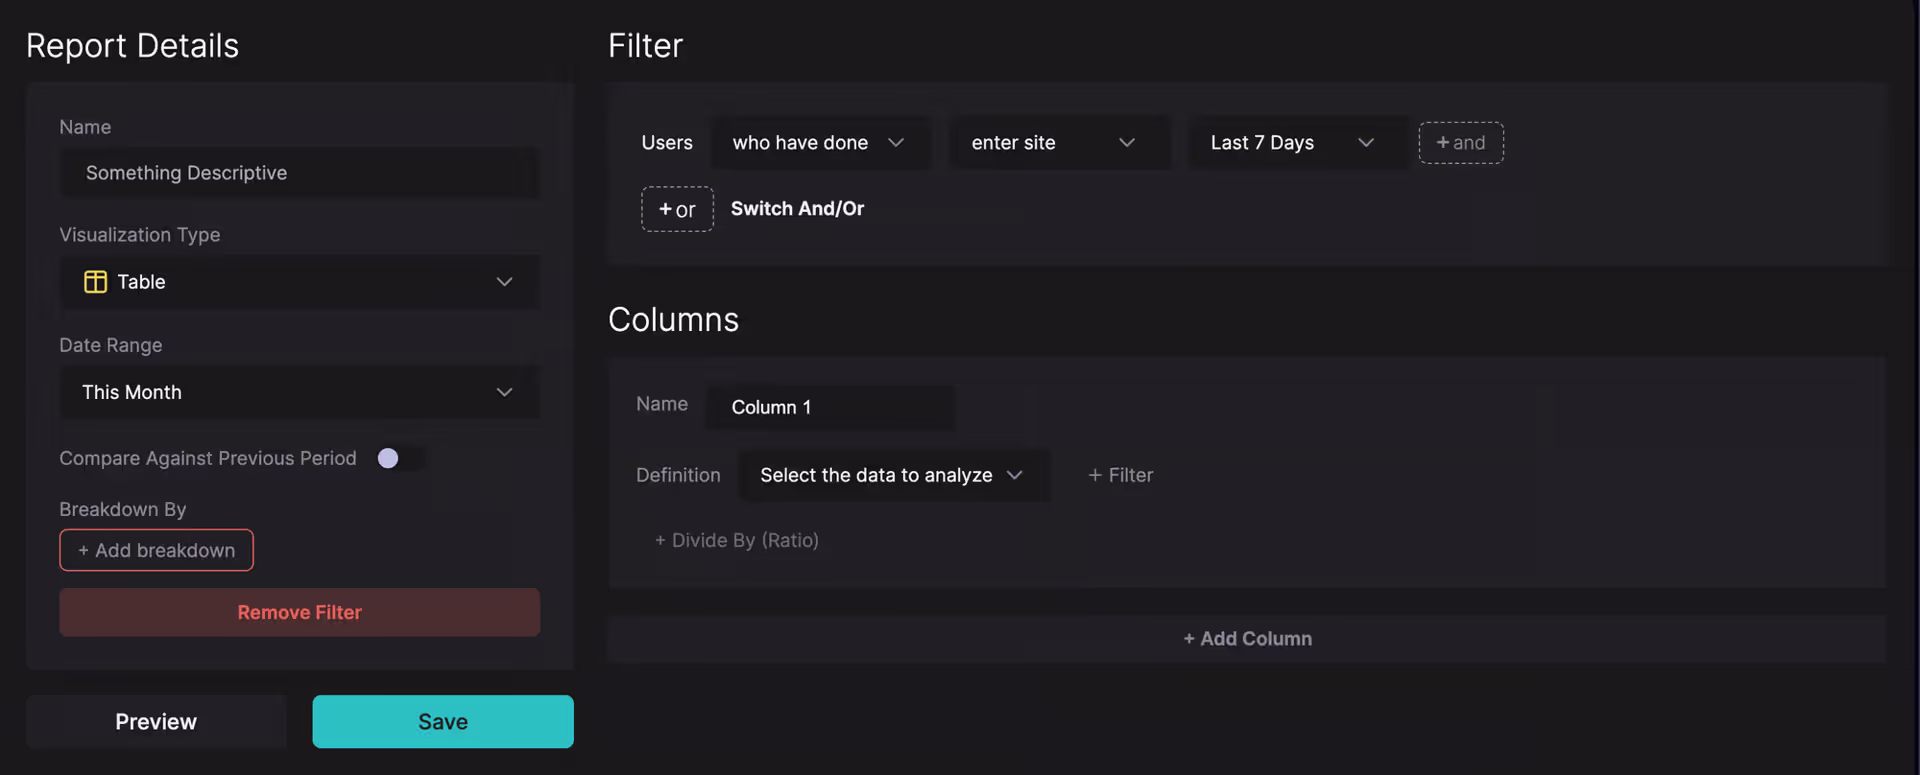
- Your numbers will be defined on the right side where it says “Columns”
- “Breakdown” is where you configure which property to break the numbers down by
- And the top level Filter defines the segment of users or companies that the report is filtered to.
Report Details also houses some additional configuration details on each report type.
How to think about building reports
HockeyStack beginners usually struggle with building reports because they jump right into creating the report without thinking about what the report will look like.
Our suggestion to all HockeyStack users is to very specifically define the three main pieces of a report before starting to create it.
For example, if I want to create a report that shows pageviews to each page coming from outside the US, my report will have:
- Numbers: Pageviews
- Breakdown: Page URLs
- Filter: Country is not US
Then, creating the report is just a matter of finding the right dropdown and selecting the right option, which is easier than thinking about what the report will look like.
Even more often than the above, HockeyStack beginners try to build a report without knowing what data the report will show. For example, a question you have in your mind might be “What products and content is our non-US audience interested in?” If you land on the reporting page with this question in mind, your first job is to think about “What datapoint(s) and what type of report(s) would help me answer this question?” If you don’t run through this exercise before building a report, you will not be able to answer your question.
To sum up,
- Think of a specific question you want to answer
- Figure out exactly what the report and the data to answer that question will look like
- Figure out the:some text
- Numbers
- Breakdown
- Filter
- Finally, land on the HockeyStack dashboard to build the report.
As you can see, most of the work in analyzing your marketing must be done before you land on the reporting screen. The rest of the reporting documentation will focus on the 4th step.
Navigating the reporting screen
Let’s continue with our example: a report that shows pageviews to each page coming from outside the US
- Numbers: Pageviews
- Breakdown: Page URLs
- Filter: Country is not US
This report demonstrates a couple very important concepts about reports in HockeyStack.
The numbers in the report are pulled from actions. In this case, the Pageview data refers to the total number of actions with action_type = enter-page .
The breakdown, breaks down the actions in the report by their properties. In this case, we selected Page URL. So each action with action_type = enter-page is broken down into their page_url properties.
The date range we selected refers to the timestamp of the actions. In this case, we are counting the pageviews that happened within This Quarter.
The report-level filter is used to filter users and companies that are considered in the report. This is a commonly confused point. The report-level filter is only used for user and company properties, and user and company behaviors. The report level filter would not filter, for example, the pages that are in the report. Because pages/pageviews are related to actions. If I were to create a filter that says “User has done Homepage View”, this would find the visitors who have had a homepage visit, and would still show all the other pages they visited in this report! I’m also specifying that this is the “report-level” filter, because there are other filter types with different behaviors.
Odin automatically answers mission critical questions for marketing teams, builds reports from text, and sends weekly emails with insights.
You can ask Odin to find out the top performing campaigns for enterprise pipeline, which content type you should create more next quarter, or to prepare your doc for your next board meeting.
Nova does account scoring using buyer journeys, helps automate account research, and builds workflows to automate tasks.
For example, you can ask Nova to find high intent website visitors that recently hired a new CMO, do research to find if they have a specific technology on their website, and add them to the right sequence.
Our customers are already managing over $20B in campaign spend through the HockeyStack platform. This funding will allow us to expand our product offerings, and continue to help B2B companies scale revenue with AI-based insight products that make revenue optimization even easier.
We are super excited to bring more products to market this year, while helping B2B marketing and sales teams continue driving efficient growth.
A big thank you to all of our team, investors, customers, and friends. Without your support, we couldn’t have grown this fast.
Reach out if you want to learn more about our new products and check out HockeyStack!
About HockeyStack
HockeyStack is the Revenue Acceleration Platform for B2B. HockeyStack integrates with a company’s CRM, marketing automation tools, ad platforms and data warehouse to reveal the ideal customer journey and provide actionable next steps for marketing and sales teams. HockeyStack customers use this data to measure channel performance, launch cost-efficient campaigns, and prioritize the right accounts.
About Bessemer Venture Partners
Bessemer Venture Partners helps entrepreneurs lay strong foundations to build and forge long-standing companies. With more than 145 IPOs and 300 portfolio companies in the enterprise, consumer and healthcare spaces, Bessemer supports founders and CEOs from their early days through every stage of growth. Bessemer’s global portfolio has included Pinterest, Shopify, Twilio, Yelp, LinkedIn, PagerDuty, DocuSign, Wix, Fiverr, and Toast and has more than $18 billion of assets under management. Bessemer has teams of investors and partners located in Tel Aviv, Silicon Valley, San Francisco, New York, London, Hong Kong, Boston, and Bangalore. Born from innovations in steel more than a century ago, Bessemer’s storied history has afforded its partners the opportunity to celebrate and scrutinize its best investment decisions (see Memos) and also learn from its mistakes (see Anti-Portfolio).

