How to Measure B2B Marketing ROI: A Practical Framework for Revenue Attribution

Most B2B marketing ROI discussions focus on basic metrics like MQLs, conversion rates, and channel attribution. But these metrics tell a dangerously incomplete story.
Your marketing investments ripple across multi-touch customer journeys, influence deal velocity, and impact expansion revenue in ways that traditional ROI frameworks simply fail to capture.
The main problem with traditional ROI frameworks is that they tend to reduce months of sophisticated marketing work into oversimplified metrics that ignore how B2B deals actually close.
Below, we’ll explain why conventional ROI metrics fail and show you exactly how you can change your approach to measuring B2B marketing ROI and do it the right way.
What is ROI in B2B Marketing?
ROI in B2B marketing measures the financial return you generate from marketing activities relative to their cost.
The most basic formula for calculating B2B marketing ROI is:
(Revenue Generated from Marketing - Marketing Investment) / Marketing Investment × 100.
However, calculating your marketing ROI is more complex in B2B contexts than B2C due to longer sales cycles, multiple decision-makers, and varied touchpoints throughout the buyer's journey.
Why is B2B Marketing ROI So Difficult to Measure?
The reality is that traditional ROI measurement frameworks break down when applied to B2B marketing – and for a good reason.
Here are the key challenges that make B2B marketing ROI particularly difficult to track and prove:
- Long and complex sales cycles: B2B purchase decisions often span 6-12 months or longer, which makes it that much more difficult to connect early-stage inbound marketing activities to eventual revenue. During this extended timeframe, buyers may interact with dozens of marketing touchpoints while their needs and evaluation criteria change.
- Multiple touchpoints: B2B buyers engage with your marketing across numerous channels and content types before they make a purchase decision. A single deal might involve downloadable resources, webinars, sales meetings, product demos, and customer references. Without a robust attribution model, marketers struggle to determine which touchpoints had the greatest influence on conversion.
- Difficulty tracking offline conversions: Many B2B marketing touchpoints also happen offline – from trade shows and industry events to sales presentations and in-person meetings. These offline interactions also play a decisive role in deal progression, yet they're notoriously difficult to track and incorporate into ROI calculations.
- Data silos: Marketing and revenue data often lives in disconnected systems (from CRM and marketing automation tools to website analytics platforms). Without a centralized view of marketing's impact across these tools, teams struggle to piece together accurate ROI measurements.
- Focus on wrong metrics: Many B2B marketing teams fixate on vanity metrics and top-of-funnel activities instead of measuring true revenue impact. This can lead to flawed ROI calculations that undervalue marketing's contribution to pipeline and revenue.
- Attribution model limitations: Standard attribution models often fail to capture marketing's nuanced influence on B2B deals. Whether using first-touch or last-touch attribution, these models oversimplify complex B2B buying journeys and miss important impact points.
How to Calculate Marketing ROI for B2B Companies
While the basic formula for ROI is straightforward, calculating it for B2B marketing requires a more nuanced approach:
Define your investment
A comprehensive ROI calculation should capture your total marketing footprint – direct campaign marketing costs, team compensation, technology infrastructure, content production, agency partnerships, and operational overhead.
More importantly, you need to consider time-based factors like the ramp-up period for new B2B marketing campaigns and the ongoing maintenance costs of existing ones.
The key is to break down your investment into fixed and variable components across channels and programs. This granular view helps you understand not just how much you're spending, but how your investment scales with different activities.
For larger organizations, you can even consider cost allocation across product lines, market segments, or business units to get an accurate picture of marketing investment per revenue stream.
Track your returns
Accurately attributing revenue to marketing is where many organizations stumble.
Your first step is to connect your marketing platforms to your CRM system.
This integration creates a single source of truth for all lead and conversion data, so you can track how marketing-sourced leads progress through your pipeline.
It’s also a good idea to add marketing automation tools to map customer journeys and outline key conversion points across your channels and campaigns.
The final piece is campaign-specific revenue tracking. Build tracking mechanisms that capture both direct revenue (from immediate conversions) and influenced revenue (from marketing activities that accelerate existing opportunities).
Calculate your ROI
Once you’ve defined your investment, calculating B2B marketing ROI follows a simple formula:
B2B Marketing ROI = (Revenue attributed to marketing - Marketing investment) / Marketing investment x 100
For example, if your marketing generated $500,000 in revenue and your total marketing investment was $150,000, your ROI would be 233%. This means you earned $2.33 for every $1 spent.
What is a Good B2B Marketing ROI?
There's no universal "good" ROI and it varies based on factors like industry, business size, and campaign goals.
However, industry benchmarks can provide some guidance. A commonly cited standard is a 5:1 revenue-to-marketing spend ratio, meaning that for every dollar invested in marketing, a return of five dollars in revenue is expected.
Let’s break down common benchmarks by channel:
Content Marketing ROI
Content marketing ROI is harder to measure in general because of the long-term nature of the channel.
Some studies suggest that content marketing generates 3x more leads than traditional marketing and costs 62% less.
Social Media Marketing ROI
Social media marketing returns can fluctuate across different platforms and strategies. Studies report an average ROI of $2.80 for every $1 spent.
In general, research shows that among B2B marketing professionals, LinkedIn consistently delivers superior returns on investment when compared to platforms such as Facebook Ads or Google Ads.
Email Marketing ROI
Litmus says that email marketing drives a $36 return for every dollar spent, which is higher compared to any other digital marketing channel.
Methodologies for Measuring B2B Marketing ROI
As buying cycles grow longer and touchpoints multiply, organizations need increasingly sophisticated measurement methodologies to understand the bottom line.
Here's how different approaches stack up:
Single-Touch Attribution Models
Single attribution models remain the most widely used approach to B2B marketing measurement – not because they're the most effective, but because they're easy to implement.
These models assign complete revenue credit to one specific touchpoint in your buyer's journey, which creates a dangerously oversimplified view of marketing's impact in B2B contexts.
Common types include:
- First-touch attribution credits the initial interaction, so you can find which channels excel at driving brand awareness and new prospect discovery.
- Last-touch attribution assigns value to the final pre-conversion touchpoint, useful for understanding which initiatives effectively close deals.
Many B2B marketing teams default to these models because they're built into platforms like Google Analytics. But in complex B2B sales cycles, single attribution can actively mislead your decision-making.
If you only look at basic attribution models, you might end up cutting budgets for important middle-stage marketing.
Multi-Touch Attribution Models
Multi-touch attribution models recognize that B2B buying decisions are rarely the result of a single interaction, so they distribute credit across the entire buyer journey.
Given the complexity of B2B sales cycles—where prospects engage with content, emails, ads, webinars, and sales reps over weeks or months—multi-touch attribution provides a more nuanced understanding of what truly drives revenue.
Each multi-touch model serves a different analytical purpose:
- Linear attribution splits credit evenly across touchpoints. While basic, this approach at least recognizes that every interaction contributes to deal progression. It works well for shorter sales cycles where touchpoint impact remains relatively consistent.
- Time decay models assign more credit to recent touches, typically using a 7-30 day lookback window. This benefits teams focusing on pipeline acceleration but often undervalue early-stage marketing.
- U-shaped attribution heavily weights both discovery and conversion touchpoints (typically 40% each), with the remaining 20% distributed across middle interactions.
- W-shaped models extend the U-shaped approach by also prioritizing lead creation, typically distributing 30% each to first touch, lead creation, and conversion, with 10% spread across other touchpoints.
- Custom attribution allows organizations to develop weighted models based on their specific sales cycle data and business requirements.
While these models provide more accurate insights than single-touch attribution, they do require sophisticated tracking infrastructure and clean data to implement successfully.
The payoff comes in the form of more intelligent marketing budget planning and a clearer understanding of how your marketing actions drive conversions.
PRO TIP 💡: Tired of piecing together marketing data from multiple platforms? Our multi-touch attribution features track both online and offline interactions in one unified dashboard. By centralizing every touchpoint, you'll eliminate manual tracking errors and get the complete picture of your marketing performance.

Customer Lifetime Value and CAC Calculation
As a core B2B marketing measurement methodology, CLTV and CAC analysis provide more granular insight into marketing success than conversion metrics alone.
CLTV calculation methodology focuses on predicting total customer revenue by analyzing:
- Historical purchase patterns and contract values
- Retention and renewal rates
- Account expansion revenue
- Service utilization and product adoption metrics
CAC methodology requires all acquisition-related costs:
- Marketing campaign investments
- Sales resource allocation
- Technology and infrastructure costs
- Content and creative development
- Channel partner compensation
The CLTV:CAC ratio helps assess marketing program sustainability, with most B2B businesses targeting a 3:1 ratio or higher.
Marketing Mix Modeling
Marketing mix modeling (MMM) is one of the most sophisticated approaches to B2B marketing measurement and it uses advanced statistical analysis to find how different marketing investments contribute to revenue.
While attribution models focus on individual customer journeys, MMM examines your marketing impact at a macro level.
This methodology analyzes relationships between marketing investments and business results by using:
- Marketing activity data across all channels
- Sales and revenue performance
- External factors like seasonality and market conditions
- Competitive activity and industry trends
- Price changes and promotional events
The major benefit of MMM is its ability to measure traditionally hard-to-track marketing efforts. It can quantify the impact of brand advertising, PR campaigns, and offline activities that don't generate direct response data.
This comprehensive view helps organizations:
- Spot optimal channel mix for different business objectives
- Determine diminishing returns thresholds for each channel
- Adjust marketing investments based on market conditions
- Forecast expected returns from marketing spend changes
While this methodology requires substantial historical data and statistical expertise, it provides specific insights that complement attribution-based analytics.
How to Measure Marketing ROI for B2B: 4 Essential Steps
These four steps will help you build an ROI tracking system that delivers actionable insights.
Let's break down exactly what you need to implement at each stage:
1. Define Clear Objectives and KPIs
Measuring B2B marketing ROI starts with a well-defined goal-setting process. Start by outlining specific, measurable marketing goals that you want to achieve.
These might include:
- Accelerate qualified lead generation for new product lines
- Shorten sales cycles by increasing SQLs by 30%
- Reduce customer acquisition costs by optimizing paid acquisition and organic lead generation
From these objectives, you can develop specific marketing KPIs that demonstrate progress and impact. Ideally, your KPI framework should span the entire revenue cycle.
Track leading indicators that predict success (sales-ready opportunities, multi-stakeholder engagement, product usage signals) and lagging indicators that prove it (revenue attribution, customer lifetime value, net revenue retention).
The idea is to kill vanity metrics like raw lead volume and replace them with quality signals that actually forecast revenue.
Don’t forget to document your measurement strategy. Map every KPI to a specific business objective, define exact calculation methods, and set up clear ownership for each metric.
2. Implement Robust Tracking Mechanisms
Basic analytics tools won't cut it for serious B2B marketing measurement. You need a comprehensive tracking system that captures both digital and offline touchpoints across your entire revenue cycle.
You can use tools like Google Analytics 4 (GA4), HubSpot, or Adobe Analytics to track basic website traffic, user behavior, and conversions. Set up:
- Goal tracking for key actions like demo requests, contact form submissions, and whitepaper downloads.
- Event tracking to measure micro-conversions (e.g., time spent on high-value landing pages, button clicks).
- UTM parameters on marketing campaigns to spot high-converting traffic sources.
Also, sync your CRM with marketing automation platforms to properly track leads from first touch to closed deals and ensure marketing-sourced leads are properly mapped to opportunities in the pipeline.
Don't neglect offline tracking mechanisms. High-value B2B deals often close through personal interactions that standard analytics miss.
For offline touchpoints, you can:
- Use dynamic phone numbers for campaign-specific call tracking.
- Create unique meeting links and registration paths for events and demos.
- Build custom fields in your CRM to capture offline influence on deals.
- Implement visit tracking for trade shows and field marketing activities.
3. Choose the Right Attribution Model
Most B2B companies make the mistake of adopting whatever attribution model their marketing automation platform defaults to. Instead, how you measure marketing attribution should reflect your specific revenue characteristics.
Start by mapping your actual buyer journey patterns:
- How many marketing touches occur before opportunities are created?
- Which combinations of touchpoints consistently lead to closed revenue?
- Where do your highest-value customers first interact with your brand?
- What marketing activities tend to accelerate deal closure?
Your attribution model must align with your go-to-market motion.
Single-touch models might work for transactional B2B sales, but complex enterprise deals demand more sophisticated approaches.
For example, you can:
- Use time-decay models for fast-moving sales cycles where recent touches matter most.
- Implement position-based models (U-shaped, W-shaped) for longer cycles with clear conversion points.
- Build custom models for ABM programs where account-level influence matters more than individual leads.
Test multiple attribution approaches in parallel before committing to a primary model. Compare model outputs against actual deal patterns and adjust weights based on what your revenue data is telling you.
4. Establish a Consistent Reporting Process
Build your reporting hierarchy around decision-making:
- Executive dashboards that connect marketing activities to board-level metrics.
- Program-level reports that outline which marketing actions deserve more investment.
- Operational reports that show opportunities for campaign optimization.
- Revenue team reports that help sales leverage marketing's impact on active deals.
Raw numbers can be overwhelming, so use data visualization tools to present insights in an accessible format.
You can use graphs and trend lines for performance changes or funnel visualizations to show how leads move through the buyer journey.
Most importantly, set up a clear insights-to-action process. Each report should drive specific decisions or actions, whether that's campaign optimization, budget planning, or strategic program adjustments.
Include specific recommendations and next steps with each reporting cycle.
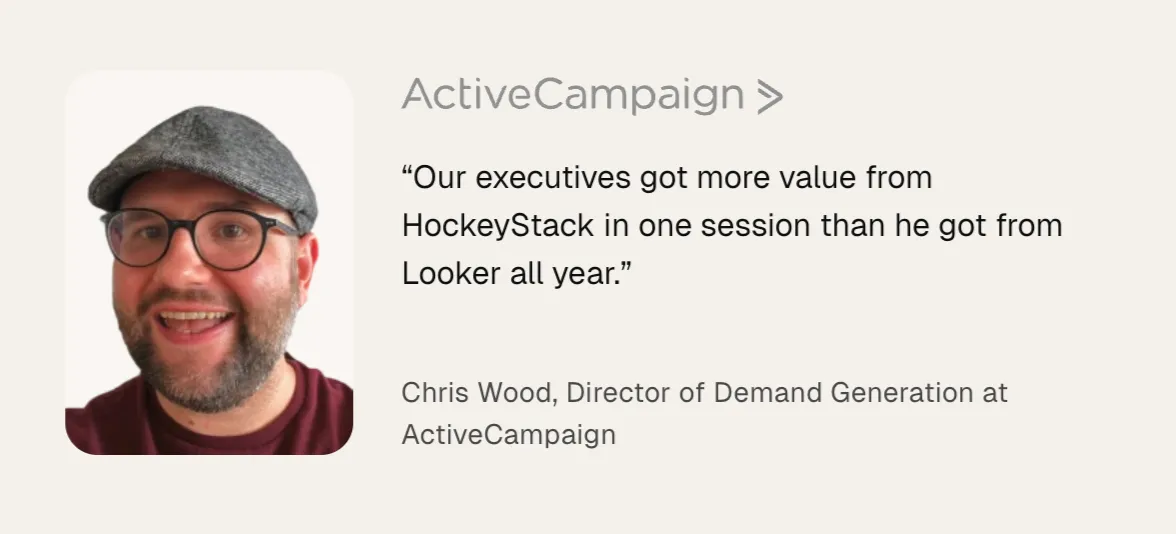
Measure and Improve B2B Marketing ROI with HockeyStack
HockeyStack is a B2B marketing analytics and attribution platform that helps businesses track every touchpoint in the buyer’s journey, directly connect marketing efforts to revenue, and optimize performance based on real data.
With insights across channels, campaigns, and content consolidated in one place, HockeyStack eliminates blind spots and gives marketing and sales teams the clarity they need to prove and improve ROI.
Here’s exactly what HockeyStack can offer:
Directly Attribute Revenue to Content
HockeyStack shows you the complete revenue story behind every piece of content.
Through multi-touch attribution, you can trace how prospects interact with your content ecosystem – including blog posts, whitepapers, videos, and case studies.
The platform maps out how potential customers engage with your content, whether they're deep-diving into technical whitepapers, sharing industry reports, or returning to key blog posts. Each interaction is tracked and weighted based on its contribution to the final conversion.
Your content team will know what’s working and where to double down. When leadership asks, “What’s the ROI of our content?” you’ll have real numbers to back it up.
Measure Incremental Revenue Lift
HockeyStack's Lift Analysis shows exactly how much revenue your content generates by measuring the difference in how engaged and non-engaged audiences convert and buy.
This analysis compares results between different audience groups - for example, it measures revenue from active newsletter subscribers compared to non-subscribers, or podcast listeners compared to non-listeners.
The platform controls for different factors to show the exact revenue increase that comes from content engagement, without having to set up complex tests or A/B testing tools.
With these insights, you can:
- See how content-engaged audiences convert compared to others
- Calculate the exact revenue difference your content programs create
- Build strong business cases for content investment using proven metrics
- Find which content channels and formats add the most value
- Make data-backed choices about where to invest in content
Understand Content Influence on Buyer Segments
Not all buyers engage with content the same way—and HockeyStack helps you spot those differences.
With cohort analysis and audience segmentation based on company size, industry, account tier, or any CRM property, you can clearly outline which content resonates most with different buyer personas.
Enterprise buyers might rely on in-depth case studies before making a decision, while mid-market companies engage more with blog content.
HockeyStack’s Deal Insights goes even further, showing how entire buying committees interact with your content throughout the decision-making process.
When you know exactly how different audience segments interact with your content, teams can move from one-size-fits-all content creation to develop targeted resources that resonate with specific decision-makers and their specific concerns.
Advanced Website Analytics for Granular Content Analysis
HockeyStack uses robust web analytics features to show you exactly how prospects interact with your content before they become customers.
Instead of getting stuck with basic metrics, you see which content actually leads to demos, deals, and revenue.
The platform connects data from your website, marketing tools, and CRM to show the full picture of how content influences buying decisions. This helps you track real buyer behavior - from their first blog visit all the way through to becoming a customer.
Marketing teams can see:
- Which specific content pieces consistently lead to demo requests
- How prospects engage with different content before larger purchases
- The typical sequence of content interactions before conversion
- How quickly prospects move through the funnel based on what they read
- Whether deeper content engagement leads to faster sales cycles
When you bring all this data together, you can see exactly what role each piece of content plays in converting prospects to customers. And teams can finally create content based on what actually works, rather than what they think might work.
Get In-Depth Content Funnel Analysis
The platform's funnel analysis shows exactly where prospects engage - and where they drop off - as they interact with your content.
You can build custom funnels to track specific user paths, whether they're reading blog posts, downloading resources, or signing up for demos. This detailed view helps you spot:
- Where prospects get stuck in their journey
- Which content combinations lead to more conversions
- Common paths that successful customers take
- Weak points in your marketing strategy that need fixing
- High-performing content that you should promote more
Cookieless Tracking with Advanced Fingerprinting Technology
HockeyStack tracks content engagement across sessions and devices without relying on cookies. Using advanced fingerprinting methods, the platform maintains accurate visitor tracking while also respecting user privacy.
The lightweight tracking system runs efficiently in the background, so you can get accurate content performance data without compromising the user experience on your website.
Custom Attribution Modeling Based on Your Specific Buyer Journey and Customer Patterns
HockeyStack lets you create custom attribution models that match your actual business context. Rather than using one-size-fits-all attribution, you can weigh different content interactions based on their real impact on your sales process.
Not all touchpoints carry the same weight. A blog visit might be an early engagement signal, but a whitepaper download could be a far stronger buying indicator.
And for enterprise buyers, the journey might look completely different from that of smaller clients. With HockeyStack, you can customize your attribution model to account for these differences.
Visualize Content Success with Custom Dashboards and Reports
HockeyStack’s dashboards make it easy to track and showcase how your content drives business results—without the headache of manual reporting.
With simple drag-and-drop controls, you can build custom reports that provide a unified view of your content’s impact.
Whether you’re tracking blog engagement, video performance, or conversion rates, HockeyStack brings all your key metrics into one place, so you can forget about juggling multiple tools.
Your team gets a complete, real-time view of how different marketing assets contribute to business growth and revenue. Clean, organized reports also make it easy to update stakeholders on marketing performance without drowning them in data.
Predictive Intelligence with AI-Based Modeling
HockeyStack uses AI modeling and machine learning to analyze your content performance data and predict what will work best for your audience.
The platform helps you make smarter decisions about content investments by looking at patterns in your historical data.

This means you can focus your content creation efforts on what's most likely to succeed, rather than waiting to see what works after the fact. The platform analyzes engagement patterns, conversion data, and audience behavior to help guide your content planning.
Content Performance Optimization Tools
HockeyStack outlines exactly which content needs improvement by showing how each piece performs throughout your marketing funnel.
The platform shows both successes and underperforming content that could drive better results with targeted updates.
The analytics help teams find:
- High-traffic content that isn't converting
- Promising pieces that lose engagement at specific points
- Messaging that attracts the wrong audience segments
- Previously successful content that's losing effectiveness
- Opportunities to improve conversion rates with small changes
For example, if a popular blog post gets high traffic but low conversion rates, you can dig into the engagement data to understand where readers drop off.
Case Study 📝: Learn how Dice uses HockeyStack to unify fragmented marketing data and clearly map the buyer journey. HockeyStack helps them prioritize the right touchpoints, make smarter budgeting decisions, and better align their sales and marketing team. [Read the Full Case Study]
Visitor and Company-Level Engagement Tracking
Most analytics tools show you what’s happening on your site, but not who’s behind the activity. HockeyStack fills that gap by connecting website interactions to actual buyers, mapping their buyer journey from first visit to conversion.
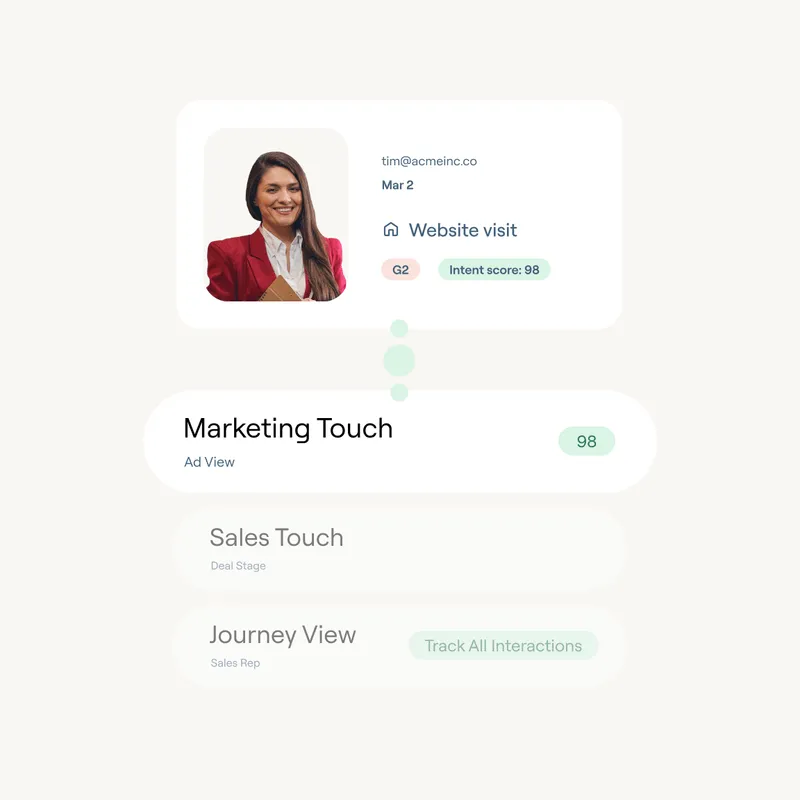
Instead of just seeing clicks and page views, you’ll know which companies are engaging with your content, who within the organization is involved, and how they’re moving through the funnel.
Real-Time Activity Monitoring and Instant Slack Updates
HockeyStack provides instant visibility into website activity, so teams can respond to important visitor actions as they happen.
Through Slack integration, the platform sends real-time alerts for key engagement moments that matter for your business.
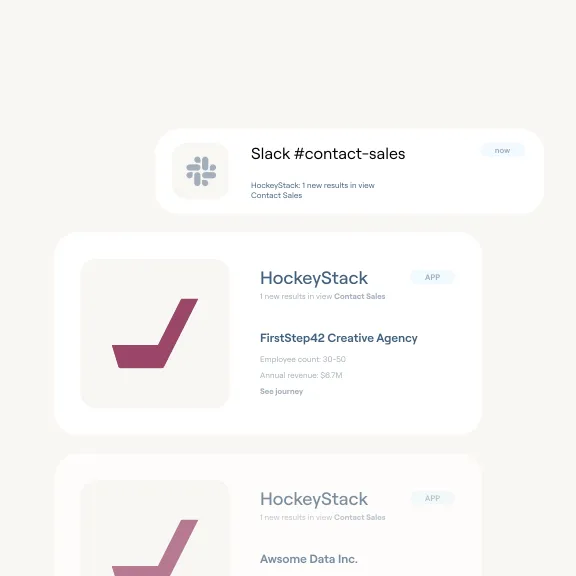
Teams get immediate notifications when:
- Target accounts visit your site
- Decision-makers view high-intent pages
- Prospects return after sales interactions
- Multiple stakeholders from one company engage
- Visitors show strong buying signals
This real-time tracking lets sales and marketing teams act quickly on engagement signals, rather than discovering opportunities days after they occur.
With multi-touch attribution, advanced website analytics, and AI-powered insights, HockeyStack provides the precise data and analytics needed to measure, optimize, and prove marketing ROI across all channels and touchpoints.
No more guessing which content drives sales. No more cobbling together data from different platforms. Just clear, revenue-based proof of your marketing impact.
Book a HockeyStack demo today and finally get the full picture of your marketing ROI.