LinkedIn Ads Reporting: How to Do It Right (+3 Report Templates)


LinkedIn Ads Reporting: How to Do It Right (+3 Report Templates)
Summary:
- Native LinkedIn reporting is superficial and fragmented. LinkedIn’s Campaign Manager provides basic metrics but lacks deep analysis, cross-campaign comparison, robust visualizations, and seamless CRM integration, forcing manual exports for serious reporting.
- Key limitations undermine ROI insight. LinkedIn’s native reporting suffers from isolated data silos, limited customization, weak visuals, unclear attribution from last-click bias, as well as export formatting issues and significant time costs—all of which hinders accurate performance evaluation and strategic decision-making.
- GTM AI platforms like HockeyStack integrate data from LinkedIn Ads with other critical data sources—including CRM, MAP, website analytics, and other ad platforms—to eliminate manual data stitching and enable a more accurate and thorough view of the complete buyer’s journey.
- Real-time dashboards combined with tailored metrics and visualizations provide stakeholders with clear performance visibility, freeing teams from manual CSV handling and enabling consistent, executive-ready reporting.
- By integrating multi-channel data, supporting advanced attribution models, and providing granular campaign performance metrics (e.g., impression influence, cost metrics, pipeline impact), advanced reporting reveals true ad value and informs strategic budget allocation.
LinkedIn's reporting tools leave a lot to be desired – clunky CRM integrations, manually stitching together metrics from different sources, and lack of cross-campaign visualizations are just some of the challenges that frustrate users.
Plus, LinkedIn's recent platform updates have changed where key metrics are located, so even experienced advertisers are now hunting for data they used to access easily.
Below, we'll show you how to set up straightforward reporting strategies and three ready-to-use templates to help you track what matters and demonstrate the value of your LinkedIn campaigns.
How Campaign Manager Works
LinkedIn’s Campaign Manager is the platform’s built-in hub that gives you the basics for tracking your ad performance.
Here’s a quick overview of how it works:
- Metrics dashboard: View stats like impressions, clicks, and conversions, filterable by campaign, date, or objective, with options to switch between account, campaign group, or ad-level data.
- Exportable CSV reports: Download performance data—covering engagement, leads, or video views—in CSV format for offline analysis.
- Professional demographic insights: Access breakdowns of who’s engaging with your ads by job title, industry, or company size.
- Performance charts: Visualizes trends like ad spend or click-through rates over time with basic line graphs that you can adjust by time range.
Where Campaign Manager shows its cracks is in deeper analysis and workflow efficiency:
- You'll quickly hit walls when comparing performance across multiple campaigns or time periods.
- The platform forces you to download and manually combine data from separate reports.
- There's no native way to visualize trends over time or connect your LinkedIn activity to downstream ads metrics like qualified leads or revenue.
- Recent platform updates have shuffled metric locations.
- Integration with CRMs like Salesforce is still unnecessarily complex.
For marketers who manage complex campaigns or need to prove ROI to stakeholders, these limitations make Campaign Manager fall short as the only reporting tool.
That’s why so many of them are turning to third-party reporting tools to fill in these gaps with sharper insights and greater flexibility.
Analyzing Campaign Performance with Campaign Manager
When you want to drill into your LinkedIn campaigns, Campaign Manager offers a few basic ways to filter and analyze your data:
- Column customization: You can select which metrics appear in your reporting tables, though you're limited to LinkedIn's predefined options.
- Date range comparison: Compare current performance against a previous time period to spot trends (but only for one campaign objective at a time).
- LinkedIn audience network segment analysis: See how different audience segments respond to your text ads and video ads based on demographic data like job function or seniority.
- Creative performance: Compare which ad versions generate better engagement within a single campaign.
However, the analysis limitations become painfully obvious when you're trying to answer important questions.
Want to spot trends across your entire account history? You'll need to manually export and compile months of data.
Trying to understand which combination of audience, creative, and offer gets the best lead generation results? Good luck connecting those dots in Campaign Manager.
Again, this is why third-party reporting tools are essential. Solutions that integrate with both LinkedIn and your CRM can instantly pull in all your campaign data in real-time, track performance through your entire funnel, and visualize the insights that actually matter.
Challenges and Limitations of Native LinkedIn Ads Performance Reporting
LinkedIn's native reporting tools give you basic insights, but they fall short when you need advanced campaign analysis.
Limited Cross-Channel Data Integration
LinkedIn Campaign Manager keeps your ad data trapped in its own ecosystem. While it tracks clicks, impressions, and conversions from LinkedIn Ads, integrating data with other channels like Google Ads, Facebook Ads, or even your CRM (e.g., Salesforce or HubSpot) is a manual, disjointed process.
You’re left exporting CSVs and stitching them together in spreadsheets, which risks errors and eats up time that could be spent optimizing campaigns.
When you can’t natively connect LinkedIn with your other marketing platforms, it creates blind spots in your decision-making. You might be spending heavily on LinkedIn campaigns that seem to perform well in isolation, but when viewed alongside your other channels, you'd realize your Google Ads are driving similar results at half the cost.
Restricted Customization and Granularity
Campaign Manager provides a set of predefined metrics—CTR, cost-per-lead, CPM, impressions—and dimensions like campaign or ad type, but customization stops short of what many businesses need.
If you need to track custom metrics specific to your business goals, you're limited to LinkedIn's predefined options. Or, if you want to create a custom report that shows only the exact data points your CMO cares about, you'll end up exporting raw data and rebuilding it elsewhere.
This becomes particularly frustrating when you're trying to get deeper insights. You might want to analyze how specific job titles within targeted companies respond to different creative approaches, but the Campaign Manager's structure makes this kind of granular analysis practically impossible.
Visualization Limitations
The visualization options in Campaign Manager are basic at best – e.g., simple line graphs for spend or CTR over time, with minimal interactivity.
Compared to dedicated analytics platforms, these tools feel dated and underpowered. You can’t layer multiple metrics, adjust chart types, or zoom into outliers without exporting data and building visuals elsewhere.
This lack of visual reporting tools forces you to spend hours manipulating exported data in spreadsheets to create the charts and graphs that you need for stakeholder presentations. More importantly, it makes it harder to spot performance patterns that would be immediately obvious in proper visualizations.
Attribution Challenges
LinkedIn's attribution system is basically a black box with limited transparency. The platform offers last-click attribution by default, which means you'll miss the impact of LinkedIn touchpoints that influence conversions but aren't the final click.
This creates a fragmented view of which LinkedIn Ads campaigns are driving results, especially for complex B2B sales cycles where multiple touchpoints influence decisions.
Conversion tracking compounds the issue, as the Insight Tag can miss actions if not perfectly implemented or if third-party cookies (blocked by browsers like Safari) disrupt tracking. This leaves gaps in understanding how LinkedIn drives down-funnel results, like pipeline growth or closed deals.
Data Export Limitations
When you finally resort to exporting data for deeper analysis, LinkedIn throws more obstacles in your path. The exported files often come with awkward formatting that requires cleanup before analysis. Headers might be inconsistent between different report types, and you'll need to manually join multiple exports to get a complete picture of performance.
These export limitations create a time sink for marketing teams. What should be a seamless data flow becomes a weekly chore of downloading, cleaning, reformatting, and consolidating data just to run basic analyses.
Reporting Complexity and Time Constraints
The time tax of LinkedIn's native reporting is perhaps its biggest hidden cost.
Marketing teams often spend hours each week cobbling together basic reports that should take minutes to generate. This is especially frustrating for agencies that manage multiple client accounts.
Every hour spent wrestling with data exports and spreadsheet formulas is an hour not spent on strategic analysis or creative optimization.
Why These Limitations Matter
These reporting frustrations directly impact your marketing ROI and LinkedIn campaign success:
- When you can't quickly spot top-performing targeting combinations, you continue wasting your budget on underperforming segments.
- Without clear attribution data, you risk cutting campaigns and landing pages that are actually influencing pipeline but don't get credit for conversions.
- Your inability to create clear reports undermines your credibility with leadership during budget discussions.
- Time spent wrestling with manual reporting is time not spent on strategic optimization that could improve results.
- Disconnected reporting makes it impossible to understand how LinkedIn fits into your broader marketing mix and customer journey.
- The competitive disadvantage grows as savvier competitors leverage better reporting tools to optimize while you're still building spreadsheets.
The opportunity cost is also massive. According to industry benchmarks, LinkedIn Ads typically cost 3-5x more per click than other platforms, with CPCs ranging from $8-10 for competitive B2B segments. At these prices, even small optimization improvements can save thousands in monthly spend.
Yet, these optimization opportunities stay hidden when you're trapped in LinkedIn's limited reporting ecosystem, so you have to make gut decisions instead of data-driven ones.
How to Automate LinkedIn Ads Reporting with HockeyStack in 4 Simple Steps
Tired of the manual reporting headaches we just covered? Here's how to streamline your LinkedIn Ads reporting with HockeyStack in four straightforward steps:
1. Connect your LinkedIn Ads account to HockeyStack
Getting set up is quick and painless:
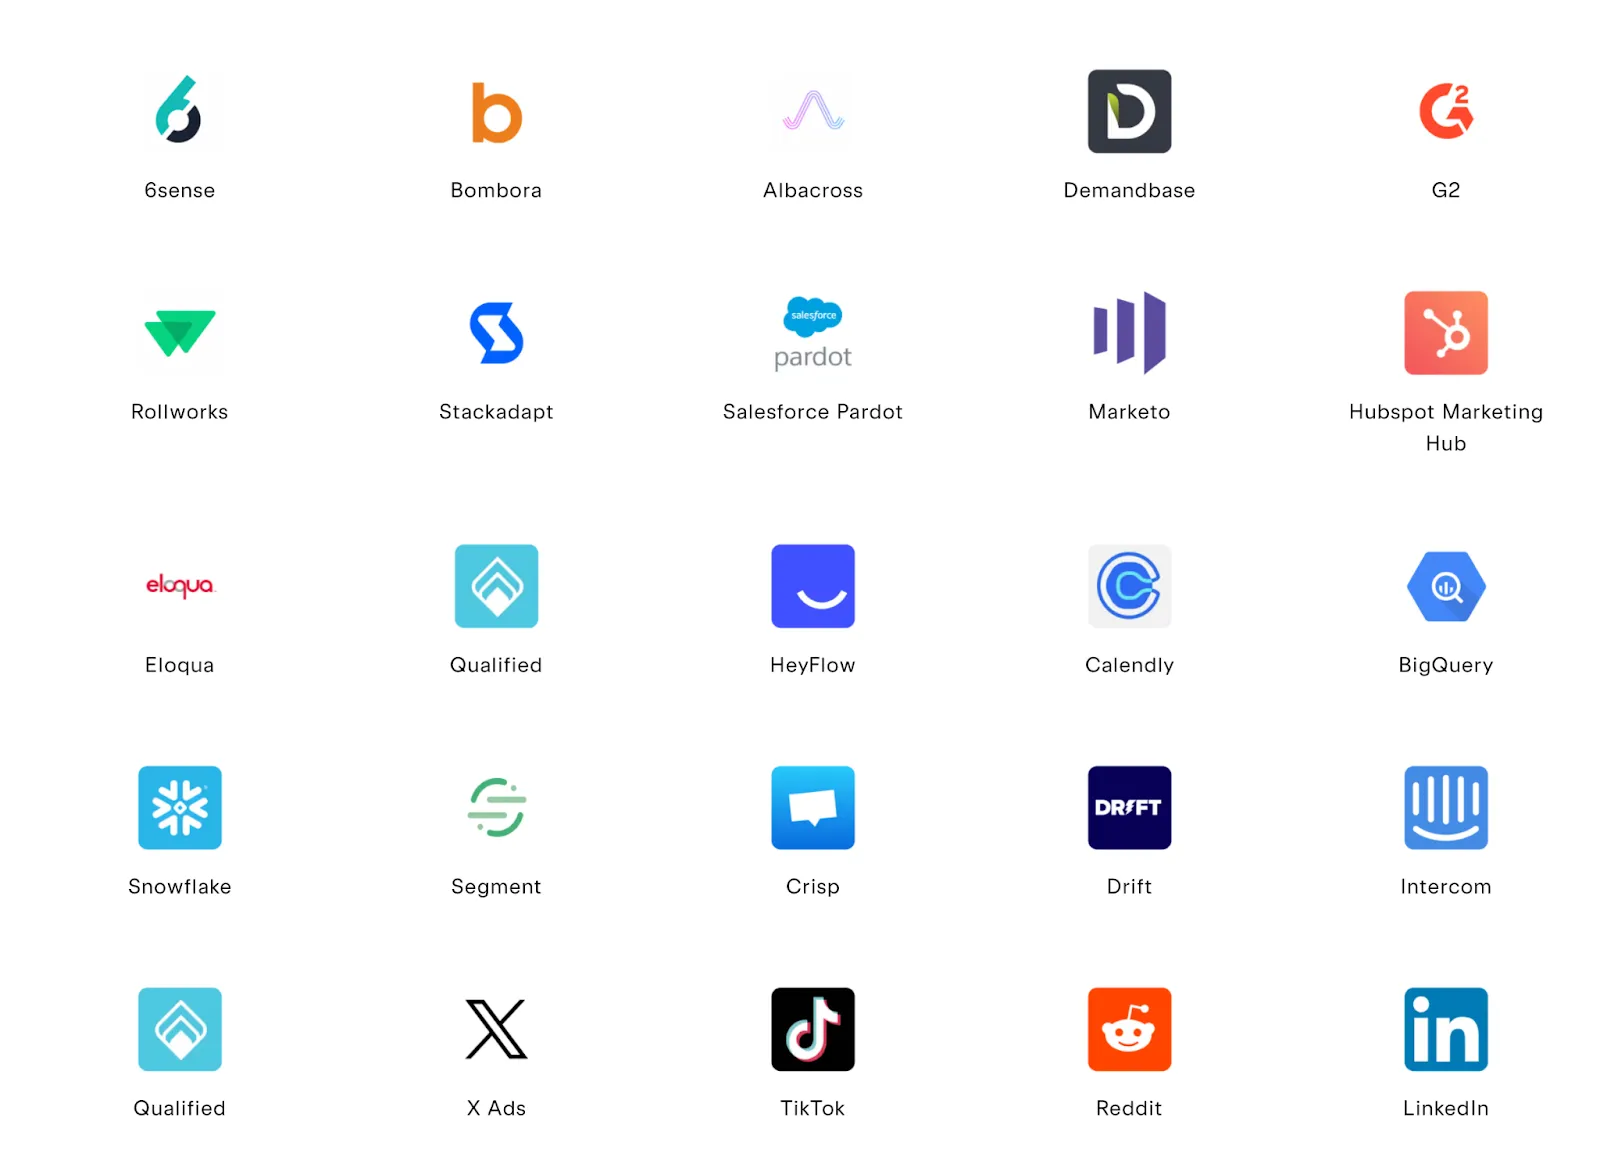
- Log into your HockeyStack dashboard and head to the "Integrations" tab
- Click on "LinkedIn Ads" from the available platforms
- Follow the simple authorization flow - you'll need to log into your LinkedIn account and grant permission
Once connected, HockeyStack will automatically start pulling your historical campaign data (usually takes 5-10 minutes)
Why it beats native ✔️Campaign Manager doesn’t sync with other tools natively, so HockeyStack bridges that gap instantly.
2. Configure your reporting dashboards and campaign metrics
Once connected, you can choose what you want HockeyStack to track. HockeyStack has pre-built templates and widgets to simplify setup, but you can also create dashboards from scratch.
It’s easy to integrate LinkedIn Ads data with metrics and KPIs from other marketing channels, so you can instantly get a comprehensive view of your campaign performance.
Why it beats native ✔️Campaign Manager limits you to LinkedIn's predefined metrics and basic tables. HockeyStack lets you create custom metrics that actually match your business goals and visualize them in ways that make patterns instantly clear.
3. Set up automated report generation and delivery
Next, you can set up automation to keep your team in the loop without lifting a finger.
In the dashboard settings, click “Schedule Report,” choose a cadence (daily, weekly, or monthly), and pick your format (PDF, CSV, or direct email).
Add recipients—your boss, clients, or sales team—and hit save. HockeyStack pulls fresh data and sends it on autopilot. You can even add custom notes and annotations to provide context for stakeholders.
Why it beats native ✔️LinkedIn forces you to manually create and share reports each time they're needed. HockeyStack eliminates this repetitive task and automatically generates and distributes reports to stakeholders on your schedule.
4. Use HockeyStack's advanced reporting features
HockeyStack also brings several advanced reporting features to the table:
- Cross-channel data integration: You can combine LinkedIn Ads data with insights from platforms like Google Ads or Facebook Ads to understand how each channel contributes to conversions.
- Customizable dashboards: You can easily build executive-friendly dashboards that make sense for your specific business goals and cover the most relevant metrics.
- Advanced attribution modeling: Use various multi-touch attribution models to accurately assess the impact of different touchpoints in the customer journey – you don’t have to rely only on single-touch models anymore.
- Granular campaign insights: Analyze performance at different levels, including campaigns, ad groups, and individual ads, to spot top-performing creatives and areas for improvement.
- API access for custom integrations: For power users, HockeyStack provides API access, so you can rely on seamless data automation and custom workflows.
Why it beats native ✔️Campaign Manager exists in isolation from your other marketing data and offers limited analysis capabilities. HockeyStack connects your entire marketing ecosystem and brings insights that would remain hidden when looking at LinkedIn data alone.
3 PPC Reports to Inspire Your Own
Rather than starting from scratch, let's look at some proven HockeyStack PPC report templates that you can adapt for your own campaigns:
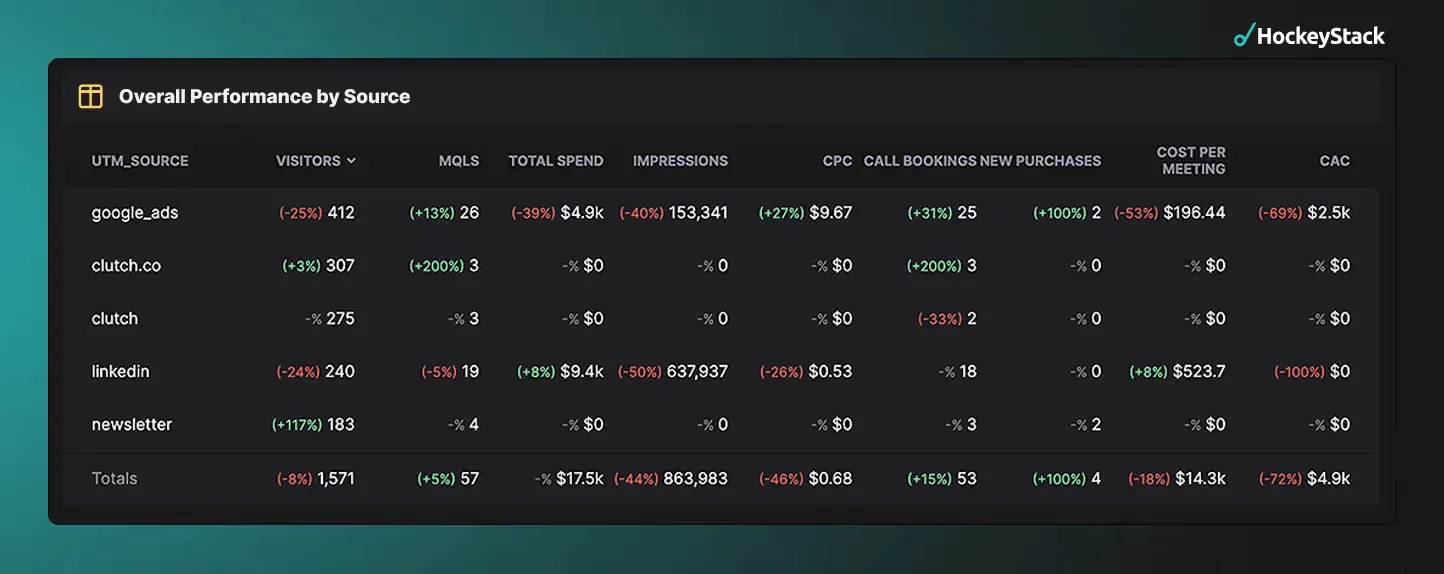
LinkedIn Ads Performance Dashboard
Justin Rowe's LinkedIn Ads dashboard provides comprehensive performance tracking specifically built for LinkedIn advertisers who are tired of Campaign Manager's basic reporting.
This dashboard provides much more than just simple click metrics to reveal LinkedIn's true impact on your sales pipeline.
This template tracks:
- Overall paid performance by source – brings comparison between LinkedIn and other channels with metrics including visitors, MQLs, total spend, impressions, CPC, call bookings, new purchases, cost per meeting, and CAC
- Cost per call booking trends – monitors both total spend across channels and bookings to establish cost-effectiveness benchmarks

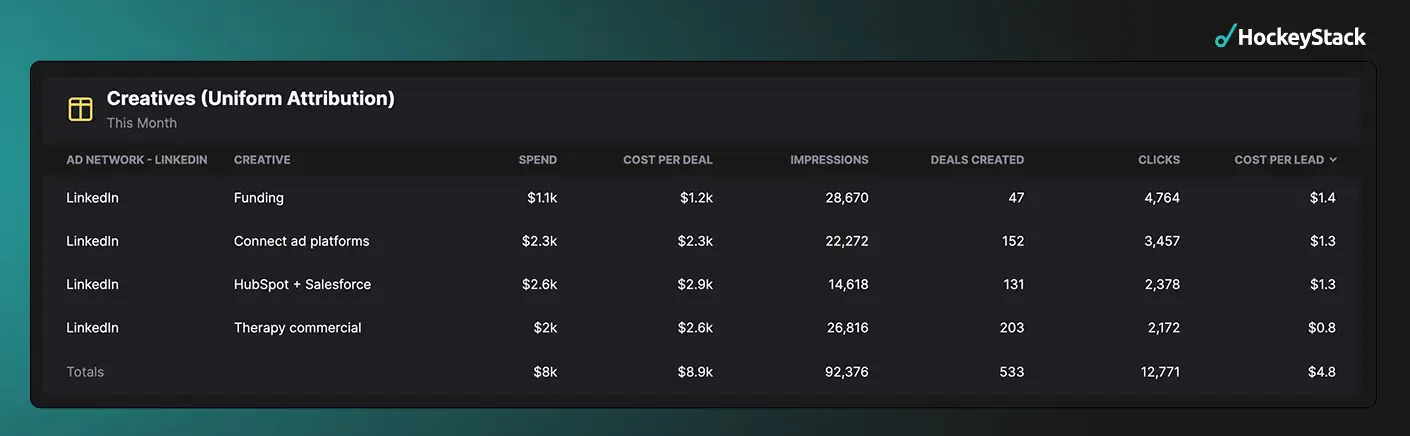
- LinkedIn ad creative performance – breaks down individual creative performance with metrics like spend, deal cost, impressions, clicks, and CPC
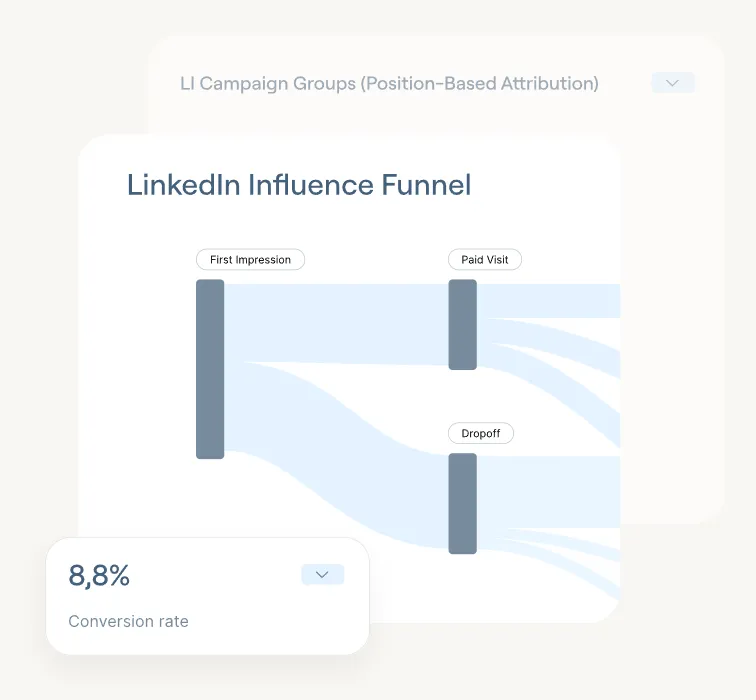
- LinkedIn ad impression and engagement influence – tracks who likes, shares, or comments on ads to identify users who convert later without clicking

- Incremental lift of LinkedIn campaigns - uses control and treatment groups to measure the true incremental impact of specific ad campaigns.

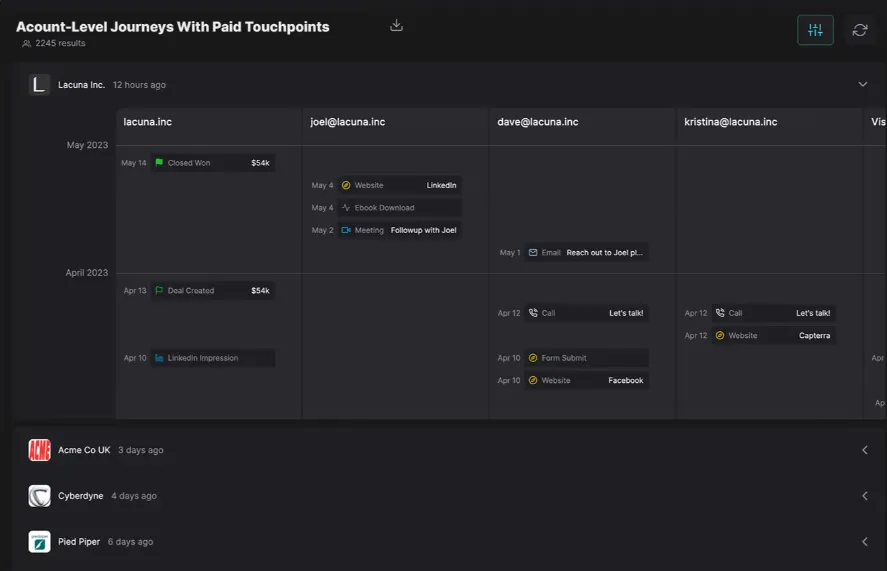
- Account-level journeys, including LinkedIn ad impressions – creates a multi-touch attribution view that shows each buying committee member's interactions before conversion

Most importantly, the dashboard solves one of the biggest LinkedIn reporting challenges – revenue attribution. Instead of crediting only direct clicks, it reveals how LinkedIn impressions influence deals even without clicks.
For B2B marketers that deal with longer sales cycles, this provides the missing link between LinkedIn campaigns and actual revenue impact, and it tackles one of the biggest limitations of LinkedIn's native reporting.
Paid Social Manager Dashboard
You can use the Paid Social Manager dashboard to monitor and optimize all your paid social campaigns, including LinkedIn Ads.
The dashboard is built around answering five major questions that every social media marketer faces:
- Are we hitting our targets for pipeline generation and campaign influence?
- Are leading indicators at TOFU and MOFU trending the right way?
- Are lagging indicators trending properly?
- Should we increase, decrease, or maintain the budget?
- How do we diagnose problem areas or identify successful tactics for expansion?
What makes this dashboard particularly valuable is its actionable framework for decision-making. The dashboard is organized with clear "green flag" and "red flag" signals that tell you exactly what to do next:
Green flags signal to:
- Consider increasing spending
- Dig deeper into what's working
- Replicate successful tactics across struggling campaigns
Red flags signal to:
- Monitor campaigns with low CPL-to-MOFU conversion rates
- Look for breakdowns anywhere in the funnel
- Cut spending when TOFU and MOFU performance metrics are significantly down compared to previous periods
The detailed tables break down TOFU and MOFU metrics across different LinkedIn campaign types, so marketers can get granular performance analysis.

You can clearly see which LinkedIn campaigns are delivering the best results at each funnel stage, with metrics like impressions, clicks, bounce rates, and pipeline generation all visible in one place.
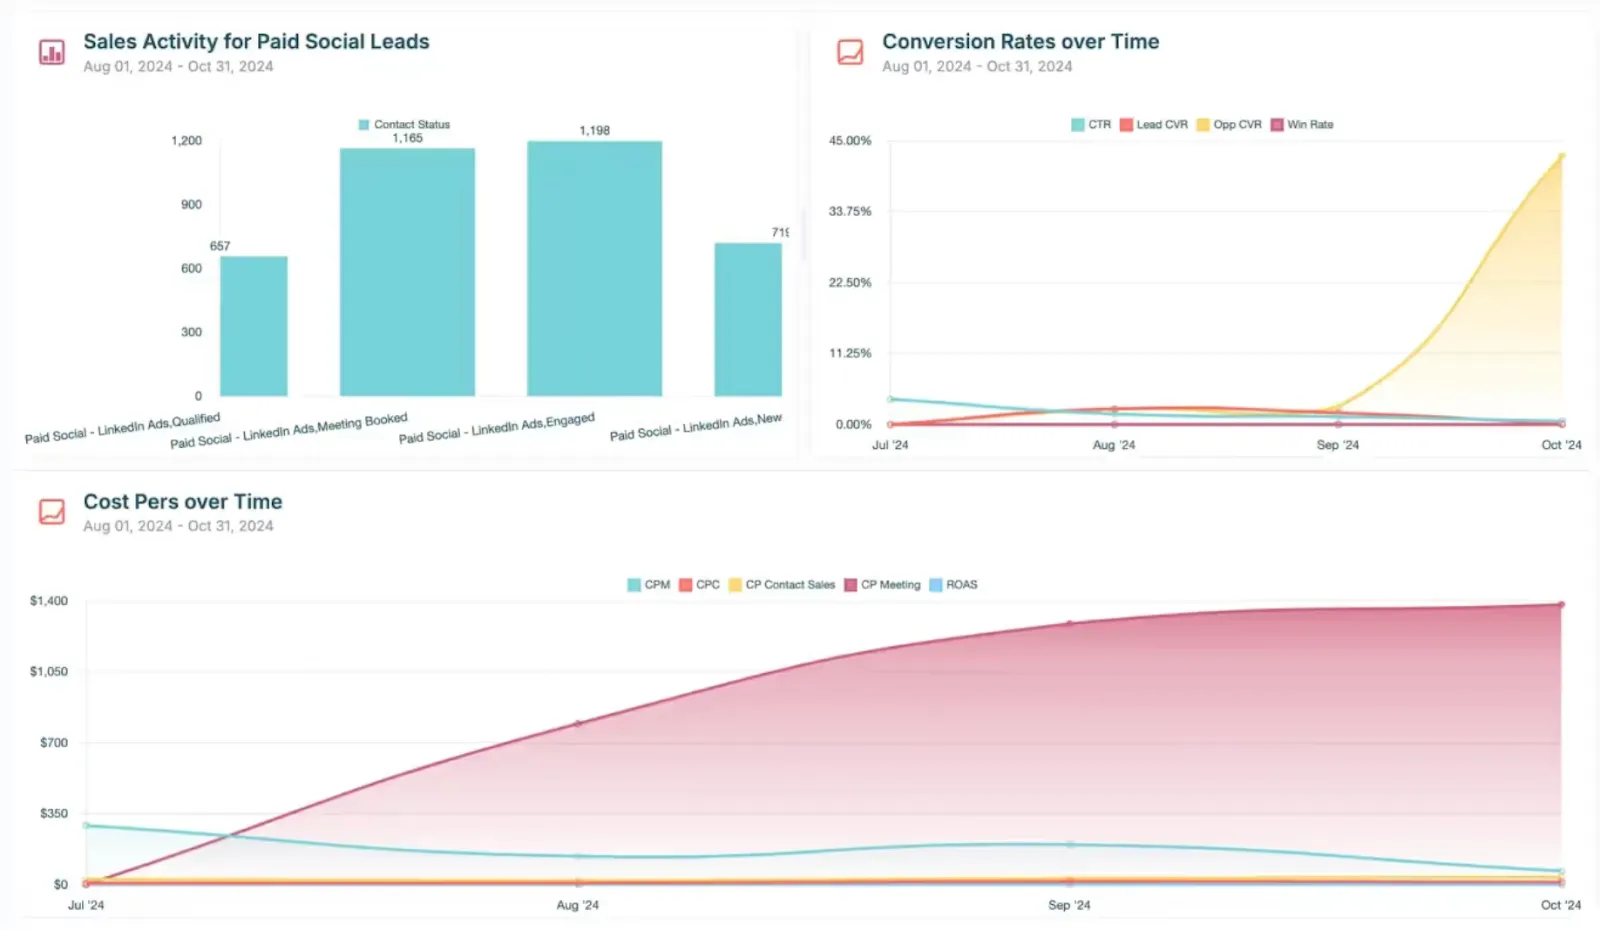
Simply put, while LinkedIn's Campaign Manager only shows you what's happening inside LinkedIn, this dashboard connects your social ad performance directly to pipeline and revenue outcomes.
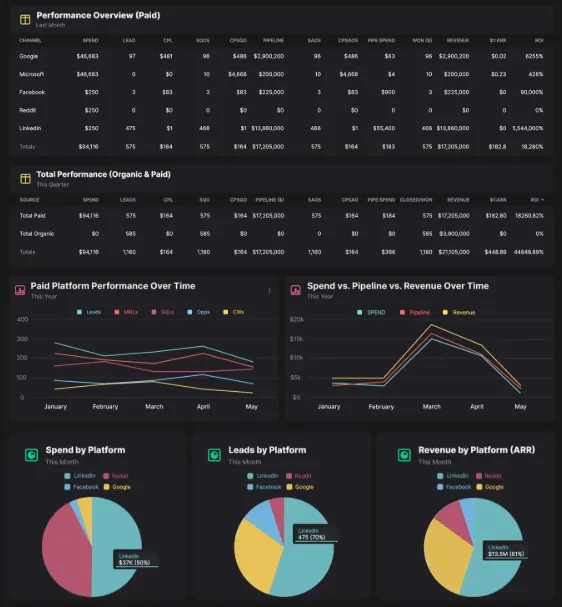
Paid Ads Dashboard
Silvio Perez's Paid Ads Dashboard offers a cross-platform approach to paid advertising analytics, so it’s perfect for marketers who run LinkedIn Ads alongside other paid channels.
This template answers the question that every marketing leader asks – which channels actually drive pipeline and revenue?
The dashboard measures five key aspects of paid media performance:
- Paid ads performance across all platforms (including LinkedIn)
- Paid vs. organic performance comparison
- Complete funnel metrics from leads through closed deals
- Spend vs. pipeline vs. revenue relationships
- Account-level journeys with paid touchpoints
Also, it focuses on bottom-line business outcomes rather than just vanity metrics. Instead of getting lost in impressions and clicks, it directly tracks metrics that executives care about:
- Pipeline/Spend ratio – how much pipeline you create for every dollar spent
- $1:ARR ratio - for every dollar you spend, how much annual recurring revenue do you get back
- The actual ROI that each channel delivers

Plus, the visualizations make channel comparison intuitive and immediate. The line charts and pie charts create an at-a-glance view of which platforms deliver the best results.
Multi-touch attribution is particularly valuable for LinkedIn Ads, which often influence deals without being the last-touch conversion point.
When you can create custom segments of visitors who have engaged with paid ads, you can filter any report to show metrics specifically for accounts with LinkedIn ad impressions.
Streamline LinkedIn Ads Reporting with HockeyStack
HockeyStack cuts through LinkedIn's reporting limitations by connecting your ad data directly to pipeline and revenue.
Here's precisely how HockeyStack transforms your LinkedIn Ads reporting:
- Automate data collection and reporting: Stop wasting hours downloading CSVs and fighting with Excel because HockeyStack automatically gathers all your LinkedIn data in one place and eliminates manual exports.
- Create custom dashboards and reports: You can build visualizations that actually make sense for your business, with tailored views that show the metrics that matter to you, not just what LinkedIn wants to show.
- Integrate LinkedIn Ads data with other marketing channels: See how LinkedIn performs alongside Google, Facebook, and other platforms to spot where your marketing dollars work hardest.
- Understand the customer journey with attribution modeling: Track how LinkedIn influences deals even without clicks by seeing every touchpoint in the buying process.
- Improve collaboration and communication: Share polished, executive-ready reports with stakeholders who need to understand LinkedIn's impact without getting lost in marketing jargon.
- Spot winners and losers at a glance: Visual dashboards instantly reveal which campaigns, creatives, and target audiences are worth your budget and which are burning cash.
LinkedIn Ads are too expensive to run on gut instinct. HockeyStack gives you the insights you need to maximize ROI and defend your budget when it matters most.
Book a demo today to see how our platform can transform your reporting workflow and help you maximize the ROI of your LinkedIn advertising.
Best AI-Powered GTM Solutions in 2026 and Beyond
We spent weeks researching GTM AI platforms so you don't have to. Here are the 10 worth your time (and budget) in 2026.
More Blog Posts


Ready to see HockeyStack in action?
HockeyStack turns all of your online and offline GTM data into visual buyer journeys and dashboards, AI-powered recommendations, and the industry’s best-performing account and lead scoring.
Ready to See HockeyStack in Action?
HockeyStack turns all of your online and offline GTM data into visual buyer journeys and dashboards, AI-powered recommendations, and the industry’s best-performing account and lead scoring.
