Complete Guide to B2B Web Analytics: Metrics, Tools, and Best Practices


Complete Guide to B2B Web Analytics: Metrics, Tools, and Best Practices
You’ve been in B2B marketing for years and you know that bounce rates and page views are practically meaningless when your average deal takes 8 months and involves 12 different stakeholders.
The problem isn't that you don't understand analytics. The problem is that most web analytics advice is built for B2C businesses selling $50 products, not $50,000 solutions with procurement reviews and multi-stakeholder buying committees.
When your average deal size is worth tens of thousands of dollars and requires sign-off from Procurement, Legal, and IT, knowing that someone spent 2 minutes on your pricing page just isn't enough.
You need a different kind of web analytics – one built for the complex reality of B2B deals.
We prepared this guide to show you how to move beyond B2C metrics and build an analytics framework that actually makes sense for B2B sales cycles.
Why B2B Website Analytics Matter
B2B marketing operates differently than B2C and it’s characterized by complex sales cycles that can span months or even years. These cycles typically involve 6-10 decision-makers, each with specific priorities, from technical details to budget concerns.
B2C sites can draw a straight line from ad click to purchase, but your prospects don’t take a linear path – a CTO reads your whitepaper, three months later their team evaluates competitor case studies, and then procurement spends weeks comparing pricing sheets.
Without B2B-specific web analytics, you won’t be able to understand the most critical parts of your sales cycle. But with it, you can:
- Track how multiple decision-makers within the same company interact with your resources.
- Monitor engagement with technical content and pricing pages.
- Set up attribution modeling to see exactly which content and channels drive enterprise prospects toward conversion.
- Understand your successful deals' digital footprints, and use the data to optimize future conversion paths and shorten sales cycles.
- Get behavioral data to segment visitors based on decision-making authority.
Key B2B Web Analytics Metrics and KPIs to Track
Most resources on this topic will tell you to look at vanity metrics like bounce rate, time on site, and pages per session.
While these can provide some insight, they don't tell the whole story. To truly understand your website's success, you need to focus on its impact on revenue and business growth.
Here are the key metrics and key performance indicators (KPIs) that you should be monitoring for B2B web analytics:
Traffic Metrics
Website traffic data reveals how well your B2B marketing performs and shows where your marketing strategy succeeds (or needs adjustment).
Essential baseline metrics include:
- Unique visitors: The number of individual website visitors to your site.
- Pageviews: The total number of viewed pages, where repeat views often mean that technical content resonates with decision-makers.
- Sessions: Number of individual site visits, with B2B users typically spending more time per session as they conduct thorough research.
- Return visitor rate: The percentage of visitors who come back to your site repeatedly, which is particularly important for B2B where multiple site visits often precede purchase decisions.
It’s important to analyze both general traffic and traffic from specific sources. This will help you measure your marketing efforts across different marketing channels.
- Direct traffic: Users who type your URL directly or use bookmarks. This can be useful when assessing brand awareness.
- Organic traffic: Traffic that comes through organic search (SERPs), so you can better measure your search engine optimization (SEO) effectiveness.
- Referral traffic: Users who click through from other sites, and it’s especially valuable from industry publications and partners.
- Paid search traffic: Visitors from PPC campaigns, which helps measure ROI on specific keyword targets.
- Paid social traffic: Users from social ads, with LinkedIn often delivering the strongest B2B results.
- Social media traffic: Organic visitors from social platforms, which shows how well your content performs in professional networks.
- Email traffic: Users who click through from email campaigns.
- Company-level traffic: Aggregate visits from specific IP ranges or domains, so you can see which target accounts engage most with your web content.
As a general rule of thumb, you should pay close attention to direct and organic traffic, as these are often the most valuable sources for long-term growth.
Engagement Metrics
Engagement metrics show how visitors interact with your website, so you can differentiate between casual browsers and serious prospects evaluating your solution.
For B2B marketers, these metrics can help you outline high-intent accounts and optimize conversion paths.
Core engagement metrics include:
- Time on site: Average duration of a session. In B2B, longer times (5+ minutes) often signal serious intent, especially on product pages or case studies. However, context matters—a visitor stuck on a pricing page for 10 minutes may be confused, not engaged.
- Pages per session: The average number of pages viewed in a single session. Look for patterns because serious B2B buyers typically view pricing, technical specs, and case studies in sequence.
- Scroll depth: Percentage of a page scrolled (e.g., 25%, 50%, 75%). It’s particularly useful for evaluating long-form content like blogs or landing pages.
- Content downloads: Track gated assets (eBooks, whitepapers, and templates) by type and topic. High download rates for technical guides vs. generic brochures can show audience maturity or pain points.
There are also some more advanced engagement metrics you can monitor:
- Event interactions: Measures actions like video plays, webinar registrations, or demo requests. For example, a visitor watching 90% of a product demo video is likely sales-ready.
- Form interaction rates: Not just form completions, but also how many start filling forms and where they abandon them.
- Cross-page journeys: Track common navigation paths through your site. Look for patterns that correlate with successful conversions, such as case study > technical specs > pricing.
- Tool interaction rate: Track usage of pricing calculators, product configurators, or return on investment (ROI) tools.
Lead Generation and Conversion Metrics
These metrics track how well your website converts visitors into actionable business opportunities. They form the link between marketing activity and the sales pipeline.
Primary metrics include:
- Form submissions: Track form completions for contact requests, demo sign-ups, and gated content. For B2B, multi-step forms usually filter low-quality leads.
- Conversion rates: Calculate by traffic source, landing page, and visitor segment to identify your most effective conversion paths.
- Lead quality: Score leads using criteria like company size, budget, or engagement. You can integrate CRM data to prioritize accounts with high intent (e.g., repeat visits from a target enterprise).
More advanced conversion metrics include:
- SQL vs. MQL ratio: Tracks how many marketing-qualified leads (MQLs) become sales-qualified (SQLs).
- Account penetration: Tracks how many contacts from the same company engage with your site before the conversion happens.
- Pipeline velocity: Measures how quickly website leads move through your sales stages compared to other sources.
- Sales acceptance rate: Monitors what percentage of website leads get accepted by sales as qualified opportunities.
- Cross-channel conversion paths: See how offline and online touchpoints work together to generate conversions.
Sales and Revenue Metrics
Sales and revenue metrics directly link pipeline activity to financial outcomes, so you can monitor return on investment and find opportunities to accelerate pipeline velocity.
- Lead value: Assigns a dollar value to leads using predictive analytics (e.g., historical close rates, deal size averages). For example, a lead from a Fortune 500 company with 10+ pageviews might be valued at $15,000 based on past conversions.
- Opportunity tracking: Monitors pipeline stages (prospect > qualified > proposal > closed) and stage conversion rates.
- Deal size and close rates: Break down by lead source and initial engagement type to understand which website paths generate the most valuable opportunities.
- Customer acquisition cost (CAC): The total cost of acquiring a new customer, including digital marketing expenses, sales team salaries, and other overheads.
- Customer lifetime value (CLTV): Measures the total revenue a customer generates over their entire relationship with your business.
- Sales velocity: Shows how quickly deals move through the pipeline, combining metrics like average deal size, win rates, and the number of opportunities.
For more advanced revenue metrics, you can pay attention to:
- Website influence on deals: Tracks how website engagement impacts deal velocity and close rates throughout the sales process.
- Contract terms correlation: Analyzes how early website behavior patterns predict contract length and deal structure.
- Expansion revenue indicators: Find which engagement patterns show potential for upsell or cross-sell.
- Competitive win rates: Tracks how website-sourced deals perform against competitors compared to other channels.
You can also keep an eye on pipeline quality metrics:
- Average sales cycle: Tracks how website-originated deals compare to other sources in time-to-close.
- Deal stall points: See where opportunities typically slow down and what website resources help nudge them forward.
- Multi-thread engagement: Measures how many stakeholders from target accounts engage with your site during the sales process.
- ROI validation: Tracks which website resources most effectively demonstrate value and accelerate purchase decisions.
How to Implement B2B Web Analytics: 6 Essential Steps
Now that you understand why B2B analytics matters, let's tackle the practical side - implementation.
This is where many companies stumble—installing random tracking codes, copying B2C metrics, or drowning in data without extracting actionable insights.
But with a structured approach, you can build an analytics system that actually drives revenue growth and helps marketing and sales teams make data-driven decisions.
Here are the six essential steps to get it right.
Define Your B2B Measurement Strategy
B2C analytics usually focus on quick conversions, but B2B measurement needs to account for multiple decision-makers, extended research phases, and various touchpoints across channels.
For best results, your strategy should define specific metrics for each funnel stage.
Top-funnel metrics might track content engagement and resource downloads, while mid-funnel metrics could focus on sales-ready behaviors like repeated pricing page visits or multi-stakeholder engagement from the same account.
Pay special attention to bottom-funnel metrics that predict closed revenue.
For instance, technical documentation engagement by engineering stakeholders is often a signal of serious buying intent in enterprise software sales.
And make sure to involve both marketing and sales teams when defining these metrics.
Marketing might care about MQL velocity and content attribution, while sales need to know which website interactions equal genuine purchase intent.
The key is to build a measurement framework that reflects your specific sales motion. A company selling enterprise software through field sales will need very different metrics than one using product-led growth for SMB customers.
Choose the Right B2B Analytics Tools
The analytics tools you choose will determine how well you can collect, analyze, and act on data to improve your digital marketing and sales outcomes.
Most B2B companies start their analytics journey with Google Analytics 4, but while GA offers robust data collection tools and useful baseline metrics, its last-click attribution model often falls short for complex B2B sales cycles that span multiple touchpoints and extended timeframes.
To build a more complete picture, companies integrate their CRM systems like Salesforce or HubSpot with their analytics stack.
This connection bridges the gap between marketing activities and actual sales outcomes, so teams can trace closed revenue back to specific marketing initiatives.
The CRM integration is especially valuable for understanding which website interactions truly influence deal progression and closure.
Marketing automation platforms such as Marketo or Pardot add another layer, tracking prospect interactions across channels and helping attribute conversions to specific marketing campaigns.
These tools excel at nurturing leads through long sales cycles, but they often struggle to provide a unified view of the entire customer journey.
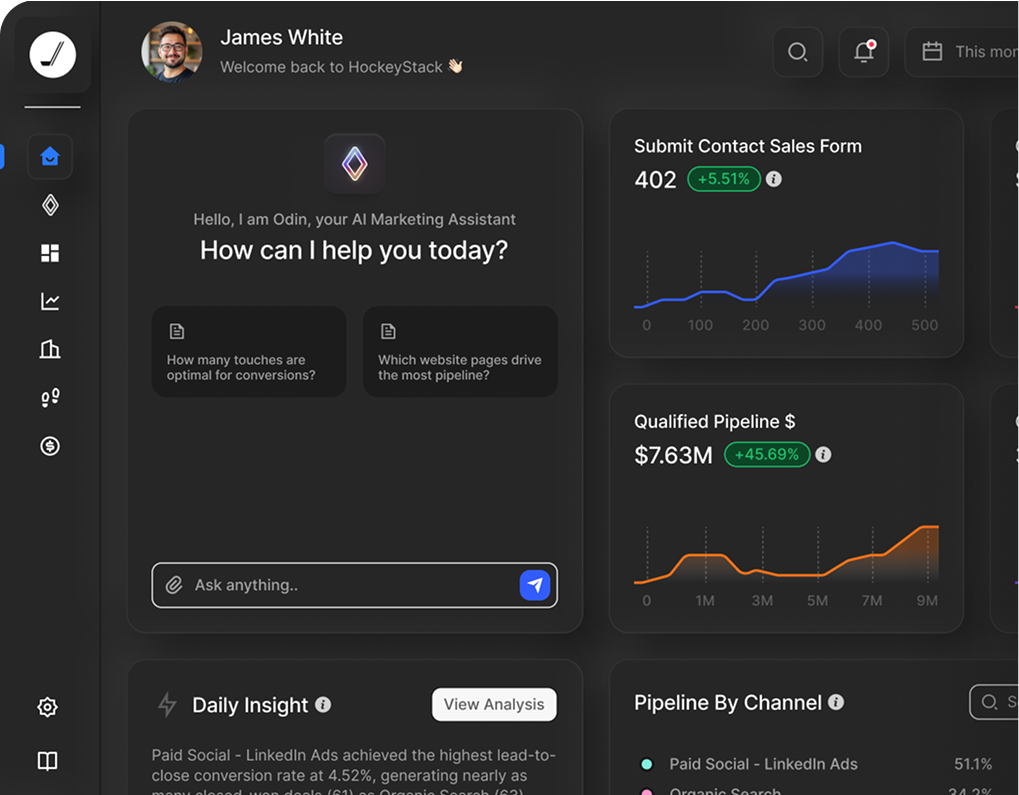
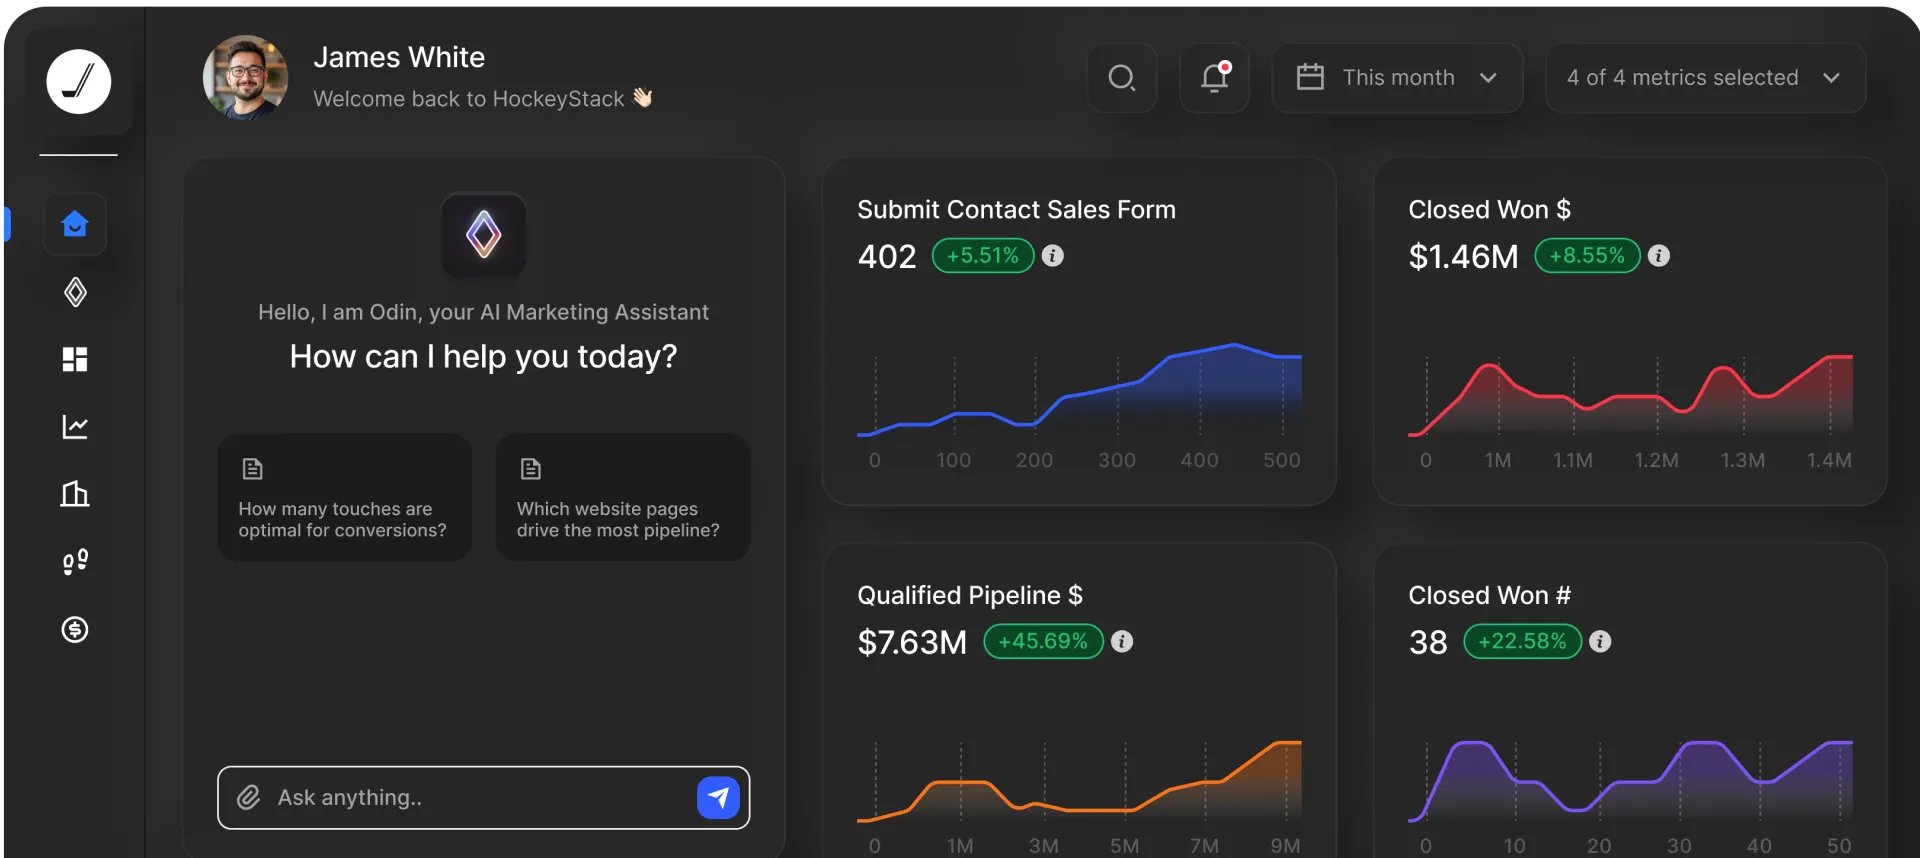
For B2B companies looking to bring all these elements together seamlessly, HockeyStack may be the perfect option.
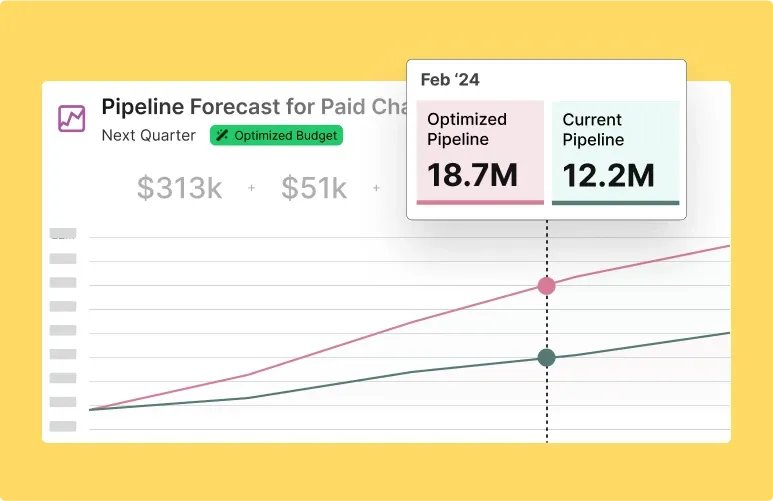
HockeyStack integrates data from GA, CRMs, marketing automation platforms, and similar sources into a single interface, with multi-touch attribution tailored to complex buyer journeys.
Its B2B-specific features include account-level tracking, custom attribution models that reflect complex sales cycles, and advanced revenue analytics that help teams optimize their entire pipeline.

Set Up Goals and Events
Defining clear objectives is the first step. Specify which actions you want visitors to take on your website.
These might include:
- Filling out a form
- Downloading a white paper
- Signing up for a newsletter
- Requesting a demo
- Completing a purchase
Each of these actions represents a milestone in your customer journey, so you need to prioritize the ones that align most closely with your business goals.
For example, a B2B SaaS company might focus on tracking demo requests as a high-value conversion metric, while a consulting firm may set resource downloads as a sign of early-stage interest.
Once you’ve established your objectives, you should configure goals in your analytics tools.
Tools like Google Analytics allow you to set up custom goals that track the completion of these key actions.
In GA4, you can set up “destination” goals for thank-you pages (e.g., post-demo submission), “duration” goals to spot engaged visitors (e.g., sessions exceeding 10 minutes), or “event-based” goals for actions like video completions.
A good idea is to structure your goals hierarchically between micro-conversions (downloading technical specifications, viewing pricing pages) and macro-conversions (demo requests, sales inquiries).
Event tracking takes your analysis even deeper and captures specific user interactions that might not directly lead to conversions but still provide valuable insights.
You can track how prospects engage with product comparison tools, configure pricing options, or interact with technical documentation.
Pay special attention to events that are actually buying intent signals, such as repeated visits to pricing pages or multiple stakeholders from the same company accessing technical resources.
Advanced event tracking should also monitor interaction patterns - like the sequence of page visits or time spent on specific features - that often predict successful deals.
Configure Account-Based Tracking
B2B success depends on how well your team understands how entire accounts engage with your web resources.
That’s why you need to set up proper account-based tracking that can spot buying signals across multiple stakeholders and lengthy sales cycles.
Start by implementing company identification through reverse IP lookup or domain matching to complement visitor data with firmographic details.
Then, configure your tracking to aggregate individual user behaviors into account-level views.
This means monitoring patterns like the number of individual stakeholders, depth of feature exploration across different roles, and content engagement by department.
HockeyStack's Deal Insights feature excels here and shows you exactly how buying committees operate - from technical teams reviewing documentation to finance departments analyzing pricing.
Advanced account tracking should also focus on engagement patterns that predict deal progression. For example, enterprise deals often close faster when three or more stakeholders engage with technical content within a two-week period.
Remember to set up proper data segmentation based on attributes like deal stage, company size, or target account status. You’ll want to know how different types of accounts move through your funnel.
For this, HockeyStack brings ABM/ABX capabilities, which can turn these insights into action by creating targeted campaigns for specific account segments.
Lastly, pay special attention to cross-device and cross-session tracking since B2B buyers often research solutions across multiple platforms.
Data Visualization and Reporting
Raw data alone is meaningless without context and custom dashboards can be your starting point.
There are different approaches to building a custom dashboard, depending on your most important KPIs and specific funnel stage.
For example, a top-funnel dashboard might show organic traffic growth and content download rates, while a sales-focused dashboard could track lead-to-opportunity conversion rates and average deal size.
Or, you can structure these dashboards hierarchically - executive views for high-level revenue metrics, marketing dashboards for channel performance, and detailed views for campaign-specific analysis.
Then, set up a regular reporting cadence so your team is always up-to-date.
You can schedule automated reports to be delivered weekly or monthly, to keep key stakeholders up to date without manually pulling data.
Advanced teams use anomaly detection alerts—for example, triggering Slack notifications if demo request conversions fall 20% below the 30-day average.
However, generic platforms like GA4 usually lack these B2B-specific filters and that’s why HockeyStack is the better option for reporting.
With customizable reports and pre-built templates, HockeyStack allows you to tailor insights to your specific needs.
From mapping every touchpoint in the customer lifecycle to analyzing the website performance of individual campaigns, HockeyStack offers granular data visualization that helps teams pinpoint what’s working—and what’s not.
The platform's advanced filtering brings quick segmentation by company size, industry, or deal stage.
One example from our library is the ABM Reporting Dashboard (created by B2B expert Andrei Zinkevich).
This dashboard offers a comprehensive view of your account-based marketing performance, where teams can track and optimize their ABM tactics.

You can track new account acquisition, expansions, and retention rates while monitoring how different ABM programs contribute to overall success.
Also, you get instant visibility into pipeline velocity, account engagement levels, and potential roadblocks that need attention.
Advanced B2B Web Analytics Techniques
Advanced B2B analytics usually includes sophisticated methods that go beyond basic traffic and conversion metrics.
For starters, strategic segmentation reveals how different types of buyers interact with your site.
You can break down your traffic by buying stage, company attributes, and engagement levels to understand what drives high-value prospects.
There’s also cohort analysis, which shows how potential customer behavior changes over time. Companies can track groups of similar accounts from their first visit through the final purchase to see what separates successful deals from lost opportunities.
Next up, you can set up A/B testing to validate which site changes actually drive results. Test different approaches to critical conversion points like pricing pages, demo requests, and technical documentation.
Focus on changes that could impact pipeline quality - not just surface-level metrics. And give your tests enough time to measure the impact on qualified opportunities, since B2B sales cycles often span months.
Finally, consider visual analytics tools to see exactly how prospects engage with your site.
Heatmaps and scrollmaps reveal which parts of key pages capture attention and drive action. You can compare interaction patterns between prospects who convert and those who don't.
Look for differences in how various buyer roles engage with your content. These insights help you structure pages and prioritize content to match how B2B buyers actually research solutions.
HockeyStack – Web Analytics Built for B2B SaaS
HockeyStack is a unified analytics platform that’s built specifically for B2B SaaS companies.
HockeyStack’s web analytics can help companies understand not just traffic and behaviors, but the entire B2B buying journey across multiple stakeholders and touchpoints.
While conventional analytics platforms focus on consumer behavior, HockeyStack is built to handle the complexity of B2B sales cycles, account-based experience, and multi-stakeholder decision-making processes.
Here’s how HockeyStack can help with your B2B web analytics:
Tie Website Activity to Users and Companies
Understanding who is visiting your website is just as important as knowing what they're doing.
While GA4 and other traditional analytics platforms provide analytics data about website traffic and user behavior, they fall short in delivering the company-level insights that B2B businesses need to make informed decisions.
HockeyStack bridges this gap and connects website activities to both individual users and their respective companies.
This means you can track the entire buyer journey of a potential customer – from their first visit to your pricing page, through reading your case studies, to signing up for a demo – all while understanding which company they represent and their role within that organization.
This company-centric approach offers several key advantages:
- Track how multiple stakeholders from the same company interact with your website over time, so you have a comprehensive view of account engagement before they even reach out to sales.
- Find high-intent accounts showing interest in your product before they convert, so your sales team can be proactive rather than reactive.
- Understand how different roles and companies interact with your content marketing, so you can create more personalized user experiences.
With website activities tied directly to user identities and company profiles, HockeyStack transforms anonymous traffic data into actionable B2B intelligence.
Understand the Revenue Contribution of Every Page
Your web content plays a major role in moving prospects through the sales funnel, but measuring its true impact on revenue has traditionally been challenging.
HockeyStack solves this through advanced multi-touch attribution and incremental reporting that reveals the actual revenue contribution of each piece of content across your website.
You’ll see which pages serve as critical touchpoints in successful customer journeys and which might be causing friction.
The platform's multi-touch attribution capabilities come with more than just traditional last-click models - they provide a comprehensive view of how different pieces of content work together throughout the buyer's journey.
This is particularly valuable in B2B contexts, where purchase decisions often involve multiple stakeholders and numerous touchpoints over extended periods.
By tracking how prospects interact with various content pieces before conversion, HockeyStack reveals the true value of early-stage content that might otherwise be undervalued in simpler attribution models.
HockeyStack's incremental reporting also helps teams understand content performance across different segments and scenarios.
Marketing leaders can see how specific content pieces perform for various industry segments and company sizes, so they can work on more targeted content creation and optimization.
Set Up Custom Attribution Models
With HockeyStack, you can build custom attribution models that accurately track and value each webpage interaction in your buyers' journey.
You can assign different weights to key pages like product documentation, pricing, case studies, or technical specs based on their role in moving deals forward.
For example, you might attribute more value to in-depth feature page visits from technical decision-makers or multiple pricing page views from finance stakeholders.
Monitor Everything in Real-Time
HockeyStack's real-time monitoring features ensure you never miss an opportunity to engage with potential customers at the perfect moment.
Through seamless Slack integration, HockeyStack delivers instant notifications when important website activities occur.
Your team can receive immediate alerts when target accounts visit your website, when key decision-makers view pricing pages, or when prospects engage with high-intent content like case studies or product documentation.
For B2B companies, this instant visibility is particularly valuable during complex sales cycles. When a potential customer from a target account returns to your website after a sales call, your team can be notified instantly.
You’ll also be able to capitalize on opportunities while they're hot, rather than discovering them days or weeks later in a retrospective report.
Sync Everything with Your CRM
HockeyStack seamlessly syncs website engagement data with your CRM, so you get a more complete picture of prospect interactions across all touchpoints.
This means your sales team doesn't need to switch between multiple platforms to understand a prospect's journey.
When a sales representative opens a contact record, they get a comprehensive history of how that prospect has engaged with your website.
From which product pages they've explored to which case studies resonated with them, every interaction is captured and contextualized within your existing CRM workflow.
Marketing teams benefit as well – they can create more targeted campaigns based on how different segments interact with website content.
Measure True Website Impact with Lift Analysis
HockeyStack's Lift Analysis helps you measure the true influence of specific web pages and content elements without needing to set up complex A/B tests or experiments.

By comparing exposed and control groups using historical website data, HockeyStack shows you exactly how different pages and content types impact your conversion metrics.
For instance, you can measure whether prospects who engaged with your product documentation pages have a higher conversion rate than those who didn't, or determine if viewing case studies actually increases the chances of requesting a demo.
Leverage AI for Predictive Web Analytics
HockeyStack's AI modeling and machine learning capabilities transform basic website data into predictive insights that can drive B2B decision-making.
The platform analyzes patterns in your web traffic, engagement metrics, and conversion data to forecast outcomes and spot opportunities that might otherwise go unnoticed.
This AI-powered data analysis helps you understand not just what's happening on your website, but what's likely to happen next.
The platform analyzes patterns in visitor behavior, such as which sequences of page visits typically lead to conversions. You can then simulate different scenarios to predict how changes to your website strategy might impact pipeline and revenue.
HockeyStack – #1 Modern B2B Web Analytics Tool
HockeyStack is a leading unified analytics platform built specifically for B2B SaaS companies. You can finally understand not just traffic and behavior, but your entire revenue engine – from first touch to closed deal, across every stakeholder and buying stage.
B2B companies can:
- Track and identify both individual users and their companies, so you get complete visibility into who's actually visiting your website.
- Use advanced multi-touch attribution to measure the true revenue impact of every webpage and piece of content.
- Create custom attribution models tailored to your specific B2B sales cycle and customer journey.
- Get instant Slack notifications when high-value accounts engage with your website in real-time.
- Sync all website engagement data directly to your CRM for seamless sales and marketing alignment.
- Measure content effectiveness through lift analysis without complex A/B testing.
- Leverage AI-powered predictions to spot high-intent accounts before they convert.
- Track account-level engagement across multiple stakeholders to identify sales-ready opportunities.
Don't let valuable B2B insights slip through the cracks of traditional web analytics platforms.
HockeyStack provides the dedicated B2B analytics solution your SaaS company needs to understand and optimize your entire customer journey.
Book a demo with HockeyStack today to see the platform in action.
Mastering ABM Attribution: A Complete Guide for B2B Marketers
Implement ABM attribution the right way. This guide helps B2B marketers navigate common challenges and achieve accurate measurement.
More Blog Posts


Ready to see HockeyStack in action?
HockeyStack turns all of your online and offline GTM data into visual buyer journeys and dashboards, AI-powered recommendations, and the industry’s best-performing account and lead scoring.
Ready to See HockeyStack in Action?
HockeyStack turns all of your online and offline GTM data into visual buyer journeys and dashboards, AI-powered recommendations, and the industry’s best-performing account and lead scoring.
