How to Build a Content Marketing Dashboard: Key Metrics and Real-World Examples


How to Build a Content Marketing Dashboard: Key Metrics and Real-World Examples

Most content marketing dashboards are cluttered, confusing, and, worst of all, useless.
You spend hours collecting data from Google Analytics 4, social media, and SEO tools only to end up with a bloated report that doesn’t tell you what’s actually working.
The problem is that most dashboards track too many vanity metrics and fail to tie content performance back to revenue.
You don’t need a spreadsheet with 50 data points – you need an attribution dashboard that shows which content drives traffic, generates leads, and contributes to sales.
Below, we’ll show you how to build a content marketing dashboard that actually matters to your bottom line.
Whether you're a marketing manager drowning in data or a content strategist fighting for budget, you'll get step-by-step instructions and real dashboard examples you can implement today.
Why Use a Content Marketing Dashboard?
A content marketing dashboard is a centralized reporting tool that tracks and displays key performance indicators and metrics from your content marketing activities in real-time.
It pulls data from multiple sources – like your website analytics, social media platforms, SEO tools, email marketing tools, and CRM – to provide a comprehensive overview of your content's performance and impact.
Here’s why you should use a content marketing dashboard:
- Data efficiency: Manual data collection from multiple platforms wastes hours per week for most content teams. A dashboard consolidates metrics automatically, so teams can focus on content creation and optimization.
- Creates a single source of truth: Eliminates the chaos of multiple spreadsheets and conflicting reports, and provides one place for all content performance data. Everyone on your team will be working with the same numbers.
- Better decision-making: You can find winning content patterns and underperforming assets quickly. When you can see which topics, formats, and distribution channels drive the best results, you can make informed decisions about where to invest your resources.
- ROI demonstration: Makes it easier to prove the value of your content marketing efforts to stakeholders and secure budget by directly connecting content performance to business outcomes.
- Performance optimization: A content dashboard quickly surfaces which content types get leads and conversions, so your teams can double down on what works.
- Cross-channel performance insights: You’ll understand how your content performs across different platforms and formats. See which pieces work best on social media versus email, or which topics drive the most engagement on your blog versus your YouTube channel.
Who Should Use a Content Marketing Dashboard?
While content marketing dashboards offer company-wide benefits, they're particularly valuable for teams directly involved in the content lifecycle – from creation to measurement.
This usually includes:
- Content marketers: Content marketing specialists use the dashboard to track campaign performance, content engagement metrics, and conversion rates. They rely on these insights to polish their content strategy, spot successful content types, and prove the value of their activities.
- Marketing managers: They need a high-level view of how content marketing fits into the broader marketing strategy and contributes to business goals. The dashboard helps them plan resources, manage team performance, and report results to leadership.
- Content writers and editors: Writers and editors use the dashboard to understand which topics, formats, and styles resonate most with their target audience. This data informs their content creation decisions and helps them optimize existing content for better performance.
- Social media managers: They leverage content dashboards to monitor content performance across social platforms, track engagement metrics, and understand which content types drive the most social sharing and community interaction.
- Executives and stakeholders: C-level executives and business stakeholders use content dashboards to understand the ROI of content marketing investments and their impact on overall objectives. They need clear, high-level metrics that show how content marketing drives revenue and supports business growth.
Content Marketing Dashboard Types
Different dashboards serve different purposes, depending on what aspect of content marketing you need to track.
Here are some of the most common content dashboard types that companies need:
Website Traffic Dashboard
A website traffic dashboard focuses on how users interact with your content at a basic traffic level. It tracks key metrics like pageviews, unique visitors, time on page, bounce rates, and traffic sources, so you can understand how people find and consume your content.
Content Performance Dashboard
Content performance dashboards show how specific content pieces and types perform across your site.
It measures engagement content metrics like scroll depth, comments, shares, and conversion rates per piece, so it’s easier to outline high-performing topics and formats.
SEO Dashboard
An SEO dashboard monitors your content's search engine performance and organic performance. It tracks keyword rankings, organic traffic growth, backlinks to certain pieces of content, and other SEO metrics.
A strong SEO dashboard also shows ranking performance in relation to metrics like bounce rate, CTR, and conversions, so you can optimize based on results, not just positions.
Social Media Dashboard
The social media dashboard shows how your content performs across different social platforms. It measures social engagement metrics, referral traffic from social channels, and audience growth, so companies know which content resonates best on each platform.
Content ROI Dashboard
This dashboard connects content directly to business results by tracking metrics like number of leads, conversion rates, and revenue attributed to content. It helps prove the financial impact of your content marketing and justify continued investment.
More advanced ROI dashboards also incorporate multi-touch attribution to show how content influences the buyer's journey at different stages. They may also track content production costs against performance to determine true ROI per piece or campaign.
Integrated Content Marketing Dashboard
An integrated dashboard combines the most important metrics from all other content dashboards into one comprehensive view.
You get a holistic picture of your performance, connecting traffic, engagement, SEO, social, and ROI metrics to show the complete content marketing impact.
Some marketers use AI to get additional insights, such as finding correlations between different metrics and automatically surfacing actionable recommendations.
Metrics to Include in Your Content Marketing Dashboard
The right metrics determine whether your content marketing strategy is actually working or just generating vanity numbers.
Here’s what you should be tracking—and why each one matters.
Basic Metrics
- Website traffic (sessions): The number of unique visitor interactions with your website within a specific time period.
- Impressions: The number of times your content appears in front of potential readers, whether in search results, social feeds, or other channels.
- Pageviews: Total number of pages viewed, including repeated views of single pages.
- Traffic sources: A detailed breakdown that shows how users find your content (organic search, paid ads, social media, referrals, direct).
- Click-through rate (CTR): The percentage of people who click on your content after seeing it, whether in search results, emails, or ads.
- Average session duration: The typical length of time visitors spend engaging with your content.
- Bounce rate: The percentage of single-page visits where users leave without any further interaction.
- Social shares: The number of times your content is shared on platforms like LinkedIn, Twitter, and Facebook.
- Form submissions: The number of visitors who complete forms on your site, whether for newsletters, content downloads, or contact requests.
- Content downloads: How often visitors download your gated content like whitepapers, ebooks, or case studies.
Here’s why these metrics are important:
- Traffic metrics reveal how many people discover your content and where they’re coming from. Tracking traffic sources helps you outline which marketing channels actually drive high-quality visitors. If one channel outperforms the rest, you double down. If another lags, you fix it.
- Engagement metrics show whether your content is doing its job. If people stay longer, scroll deeper, and share your content, it’s working. This data tells you what resonates and what falls flat.
- Conversion metrics separate vanity traffic from real business impact. Form submissions, content downloads, and lead captures show which content pieces move people down the funnel. If traffic is high but conversions are low, it’s a sign your content isn’t persuasive enough or that you’re attracting the wrong audience.
Advanced Metrics
Basic metrics only scratch the surface of content performance. To understand the real impact of your content, you also need to keep an eye on the following metrics:
SEO metrics:
- Keyword rankings: Tracks how your content performs for specific search terms over time.
- Organic traffic: The amount of traffic coming from organic search results.
- Backlinks: The number of external websites linking to your content.
- Domain authority: A score that predicts how well your website will rank.
Lead generation metrics:
- Conversion rate: The percentage of visitors who complete desired actions after consuming your content.
- Lead quality: Track the source and engagement level of leads.
Sales and revenue metrics:
- Content ROI: Calculates return on investment for individual pieces and content campaigns, including production costs and generated revenue.
- Content-influenced revenue: Track revenue from deals where content played a role in the buying process, even if it wasn't the primary lead source.
- Customer acquisition cost (CAC) by channel: Breaks down acquisition costs across different content distribution channels to optimize spending.
- Opportunities created: Measures how many new sales opportunities originate from content marketing activities.
How to Build a Content Marketing Analytics Dashboard: 8 Steps
Creating a powerful content marketing dashboard is simpler than you think.
We’ll break down the process into eight actionable steps:
1. Define Your Goals and Objectives
Start by defining your primary content objectives – whether that's getting more website traffic, generating qualified leads for your sales team, or driving product adoption through educational content.
Set real, measurable goals so your dashboard delivers insights you can act on. For example, “increase organic traffic by 20% in Q2.”
Then, map these objectives to specific content goals. For instance, if lead generation is your focus, determine exactly how many marketing qualified leads (MQLs) you need from content each month, which content formats should drive them, and what criteria define a qualified lead for your business.
This will help you understand which metrics you need to track.
2. Choose a Dashboard Tool
Your dashboard platform choice needs to balance your team's technical skills, budget constraints, and data complexity.
While spreadsheets offer flexibility and familiarity, they demand constant manual updates and often break down as your content operation scales. Most marketing teams outgrow them fast.
Data visualization platforms like Google Data Studio (now Looker Studio) strike a strong middle ground. They automatically pull data from multiple sources – your Google Analytics, Google Search Console, social platforms, and CRM – and provide customizable visualizations at no cost.
But for teams with more sophisticated needs, dedicated marketing analytics platforms like HockeyStack provide deeper insights with pre-built dashboards with automated tracking of content performance, attribution, and revenue impact.
They’re ideal for scaling teams that need in-depth reporting and seamless integration with existing marketing tools.
3. Select Your Metrics
Don't fall into the trap of tracking a mountain of metrics just because you can. Find the few critical ones that directly connect to your content goals.
If your primary objective is driving product demos through thought leadership content, you'll want to focus on metrics like conversion rates from blog posts to demo requests, rather than social media likes.
You can also start with fundamentals like:
- Top-of-funnel metrics like content reach and engagement through page views, average time on landing page, bounce rates, and organic traffic growth per content piece
- Mid-funnel metrics might include email signup rates, resource downloads, webinar registrations, and return visitor frequency
- Bottom-funnel metrics so you can monitor content's impact on revenue through demo requests generated, MQLs influenced by specific content pieces, and content-attributed pipeline value
As your content program matures, you can add more sophisticated metrics that show content ROI.
This might include content attribution modeling to understand which pieces drive the most valuable conversions, or customer journey analysis to spot which content sequences lead to the fastest sales cycles.
4. Connect Your Data Sources
Most teams have content performance data scattered across multiple tools.
Your dashboard needs to unite these disparate data sources to provide a complete view of your content's impact.
Map out which platforms contain the most important content data. Once integrated, double-check that metrics are being pulled correctly. Pay attention to discrepancies in tracking, duplicate data, or missing values that could skew insights.
5. Visualize Your Data
A dashboard is only effective if the data is easy to interpret at a glance. The key is matching each metric with its most intuitive visual format.
Maintain a clean design by limiting each section to 3-4 visualizations and using consistent colors and labeling. This structured approach helps your viewers quickly find the insights they need without getting overwhelmed by data.
Just remember that different stakeholders may need different views.
What works for content creators (like detailed engagement metrics) might not serve executives (who need high-level ROI and growth trends). So, consider creating targeted dashboard views for different team members.
6. Customize Your Dashboard
Your content dashboard should reflect your specific content strategy, business model, and team structure.
That’s why you should create dedicated views that match different use cases. This could include:
- High-level executive view for content ROI and revenue impact
- Tactical view for content creators that focus on engagement and performance metrics
- Specialized view for your SEO team that prioritizes keyword rankings and organic growth.
It’s also a good idea to structure your dashboard with flexible drill-down capabilities that let users explore the data that matters to them. Include filters for content type, topic clusters, customer segments, and time periods.
7. Monitor and Analyze Your Data
You need a regular cadence for data review and action planning. Schedule weekly team check-ins to analyze content analytics and performance trends, outline successful content patterns, and catch potential issues before they impact results.
Then, create an action-oriented review process where metrics trigger specific responses.
When certain content pieces consistently outperform others, analyze their common elements to inform your content creation guidelines.
And set up automated alerts for major metrics changes - like sudden traffic drops or conversion rate spikes - so your team can respond quickly to both opportunities and issues.
8. Always Strive to Improve
Your content dashboard should grow with your content strategy and team's analytical maturity. Early-stage metrics may not serve you well as you scale to enterprise-level content operations.
So, make sure to regularly evaluate which metrics actually drive decisions and which have lost relevance. Remove or replace metrics that no longer drive action to keep your dashboard focused and valuable.
Gather feedback from your daily dashboard users—content marketers, SEO specialists, social media managers, and leadership all rely on different insights.
Ask what’s missing, which marketing reports they find most valuable, and what could make the dashboard more useful.
6 Content Marketing Dashboard Examples to Inspire Your Own
We've gathered six content marketing dashboard examples that showcase different approaches to organizing and visualizing your metrics:
Blog Vitals Dashboard
The Blog Vitals Dashboard (built by Gaetano Nino DiNardi) provides insights into your blog’s direct impact on revenue and pipeline.
This content dashboard tracks three key areas – revenue contribution, conversion pathways, and engagement by company.
Some of the key metrics you get at a glance:
- Meetings booked with blog touchpoints
- Newsletter subscribers gained through blog content
- Sales win rate comparison (prospects with blog views vs. without)
- Direct revenue contribution from blog-influenced deals
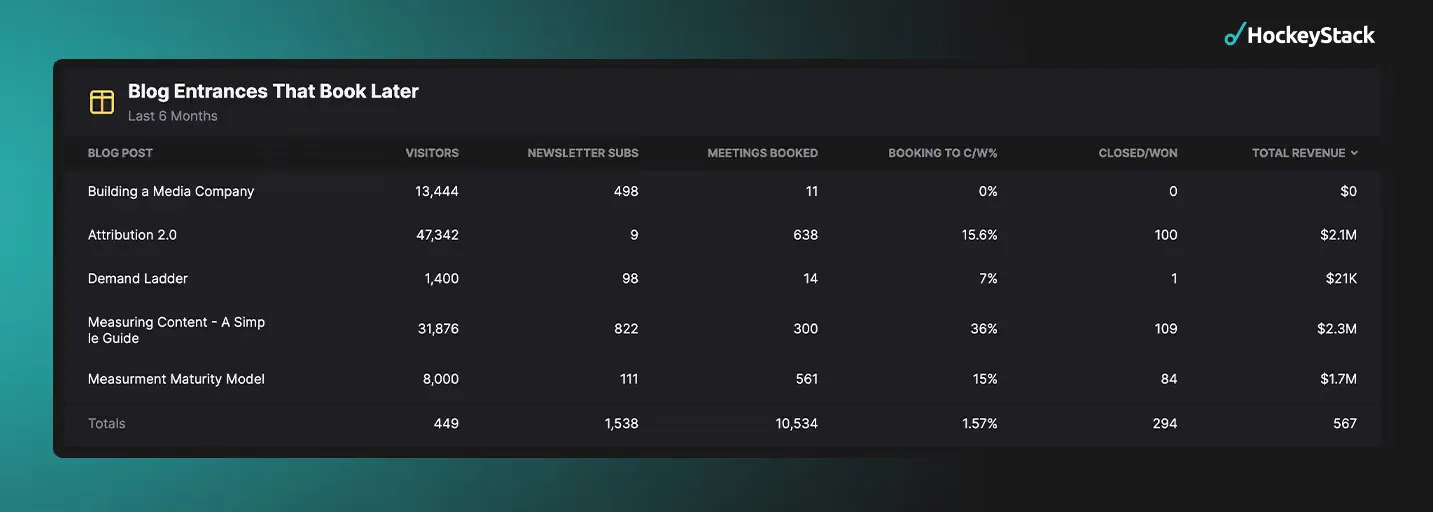
The dashboard uses HockeyStack’s multi-touch attribution to track which blog posts appear in successful buyer journeys. It measures deal value, leads generated, and total deals created at the individual post level, so it’s easier to find your highest-performing content.
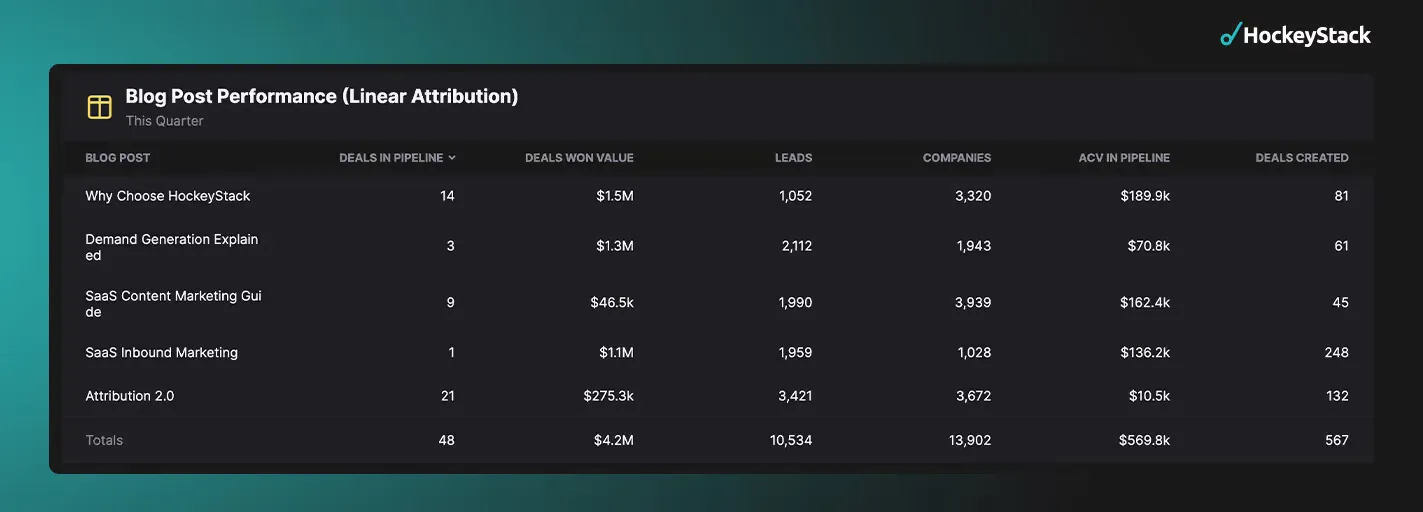
It even tracks "delayed conversions" – when someone discovers you through a blog post and converts months later. This helps prove content's role in starting valuable customer relationships that might otherwise go unattributed.
This dashboard is particularly valuable for content teams struggling to prove ROI, as it provides clear evidence of how blog content influences pipeline and revenue generation.
TOFU to Revenue Dashboard
The TOFU to Revenue Dashboard connects top-of-funnel activities to revenue outcomes, so it’s ideal for content strategists and founders who need to prove the value of their brand-building efforts.
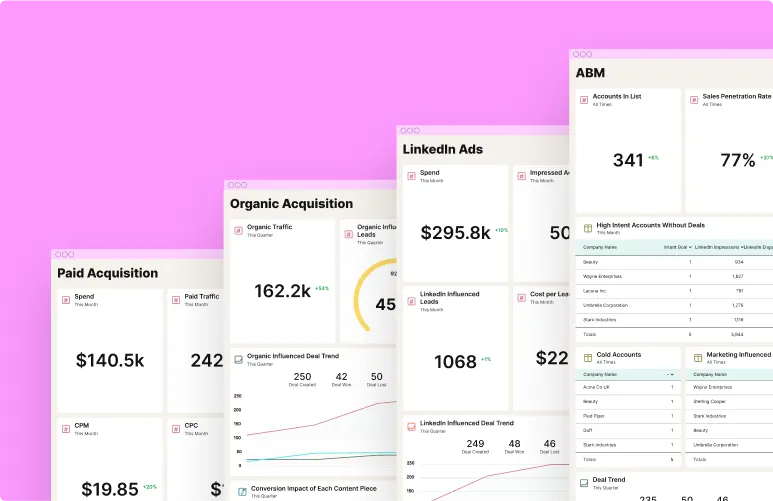
The dashboard tracks brand health metrics like LinkedIn impressions and follower growth, podcast download trends, branded search volume, newsletter growth, and website traffic by source.
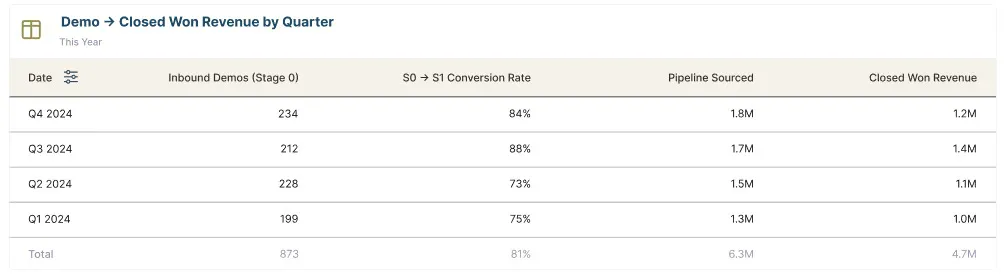
For pipeline performance, you can monitor inbound demo requests, conversion rates from initial contact to subsequent stages, pipeline sourced from content, and quarterly revenue goal tracking.
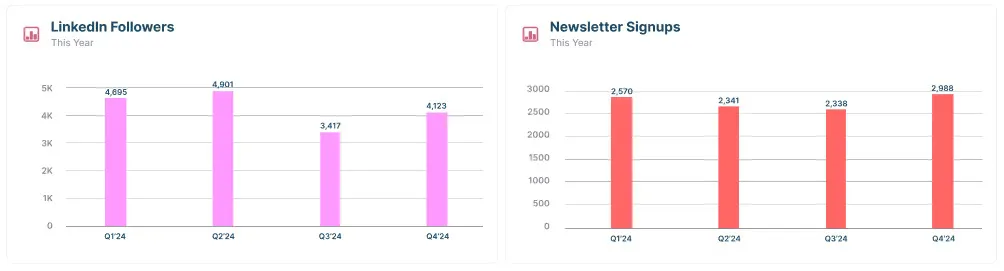
You also get a detailed quarter-by-quarter analysis of how top-of-funnel activities convert to closed revenue. This way, you’ll see which channels drive the most valuable leads and which periods show the highest conversion rates.
Content Influence Dashboard
Bridget Poetker's Content Influence Dashboard gives marketers a clear view of how content drives website engagement and business results.
It delivers insights across three key areas:
- Website trends & engagement: Track visitor counts, bounce rates by page, pages per session, and average session duration to measure content effectiveness.
- Traffic sources & trends: See how your traffic mix changes month-over-month, monitor organic growth, and outline top-performing pages from the last quarter to refine your strategy.
- Content’s impact on leads & revenue: Measure the percentage of leads and pipeline influenced by content, see which pieces drive conversions at each funnel stage, and analyze how organic traffic contributes to deals and wins.

This dashboard helps marketers outline what content resonates, fine-tune their approach for better engagement, and directly connect content efforts to lead generation and revenue.
Dark Social Dashboard
The Dark Social Dashboard can measure and report on the connection between various organic activities and the sales pipeline, with a particular focus on "dark social" channels—those hard-to-track interactions that occur in private or non-public spaces.
The dashboard captures both trackable activities, such as UTM links or referrals from platforms like YouTube, Reddit, and influencer collaborations, as well as self-reported attributions from "dark social" interactions that happen in communities or through word-of-mouth.
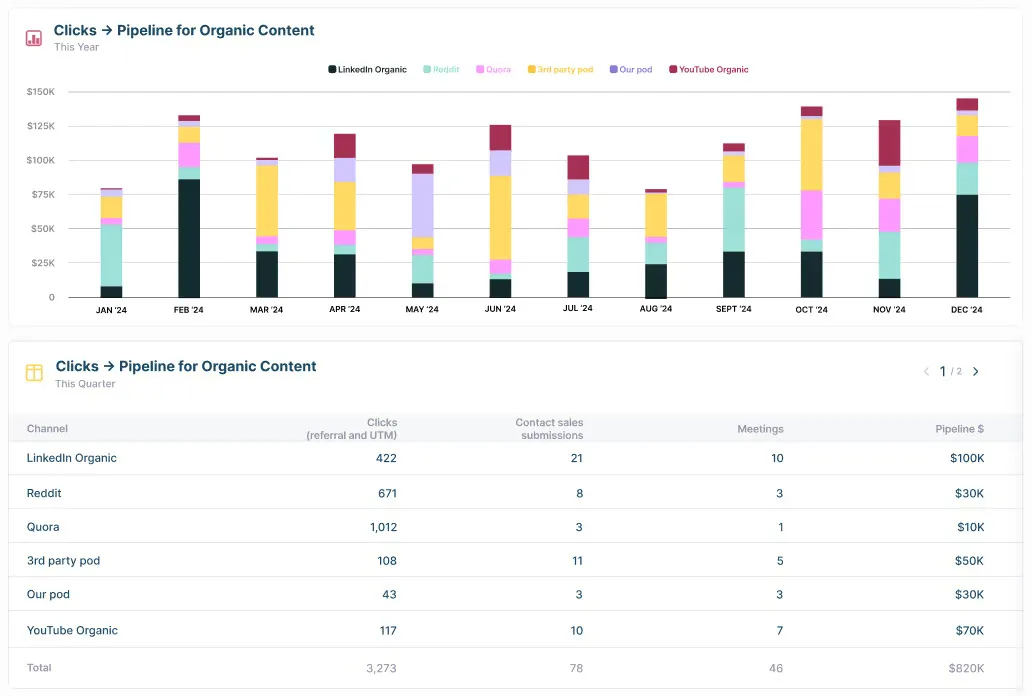
It also analyzes a variety of campaign types, including customer advocacy initiatives, in-person events, and webinars, to provide a holistic view of their impact on the pipeline.
This dashboard is especially useful for digital marketing teams who understand that some of their most valuable interactions happen outside of easily trackable channels and want to learn more about them.
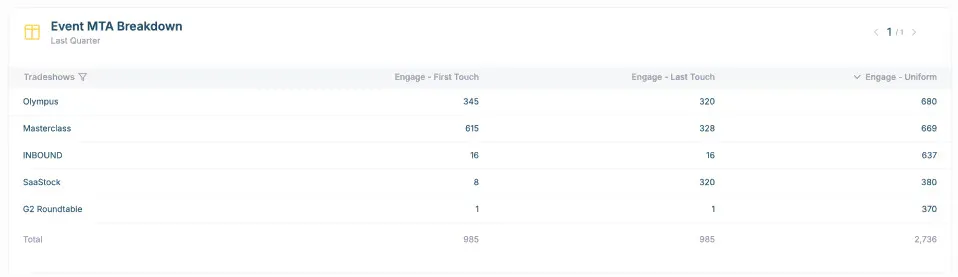
Brand Growth Dashboard
Brand Growth Dashboard is an enterprise-level dashboard that connects all aspects of brand building to measurable business outcomes and it prioritizes marketing campaign performance, channel effectiveness, and revenue impact.
For campaigns, it measures direct contributions to pipeline and revenue. The dashboard breaks down performance by channel, tracking not just traditional content marketing metrics but also the harder-to-measure brand lift and dark social impact.
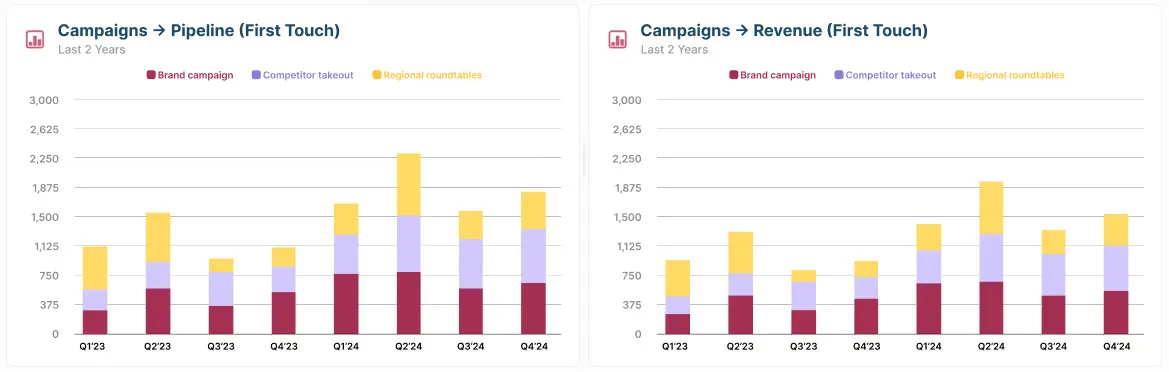
Brand impact tracking is particularly sophisticated and it measures direct traffic trends, branded search volume, and self-reported attribution across channels. This setup helps quantify the value of brand-building activities that traditionally lack clear ROI metrics.
This dashboard is particularly useful for executives because it tracks pipeline and revenue trends by source over time while also revealing lead quality and account pipeline value.
Email Marketing ROI Dashboard
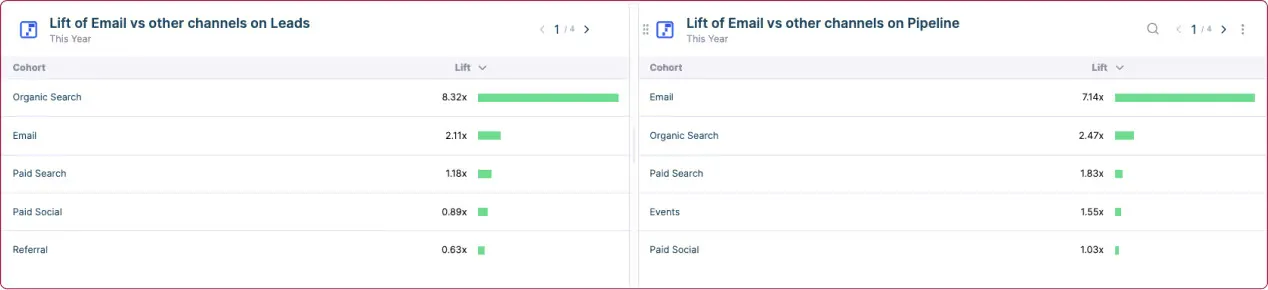
The Email Marketing ROI Dashboard provides a granular look into email marketing success and connects campaign performance to actual revenue impact.
It combines traditional email KPIs with advanced ROI tracking to give marketing teams a complete picture of their email strategy's impact.
The dashboard measures performance across multiple dimensions. At the campaign level, it tracks standard metrics like open rates and CTR, but extends deeper into business impact by measuring direct leads generated and deals influenced.
Geographic and demographic breakdowns provide insights into audience engagement. Teams can see how different regions, industries, and job titles respond to campaigns.
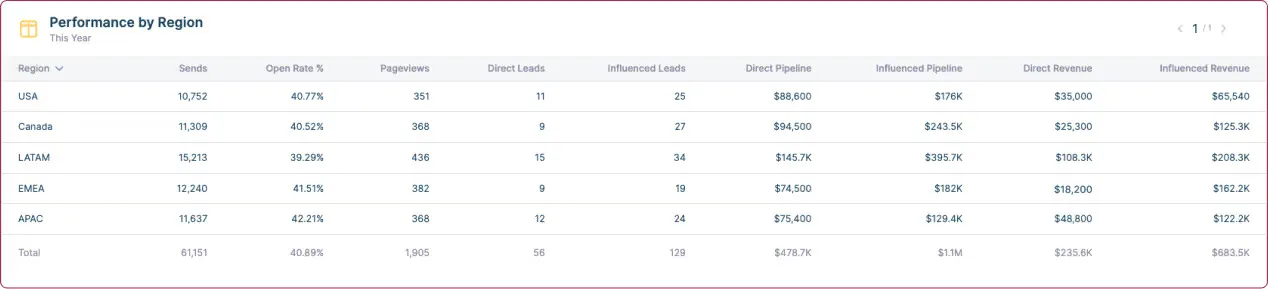
Combined with lift analysis comparing email performance against other channels, teams can understand exactly how email campaigns contribute to pipeline and revenue generation.
How HockeyStack Can Help You Stay On Top of Content Marketing Performance
HockeyStack is a unified B2B analytics platform that brings all your content marketing data together in one place, so you don’t have to switch between different tools and spreadsheets anymore.

Here are some of HockeyStack’s main features that can help you stay on top of your content marketing game:
Unify Your Most Important Marketing Data in One Place
Centralize Your Marketing Data for Clearer Insights
HockeyStack brings all your marketing data together and provides you with a single source of truth.
From website visits and CRM records to email engagement, social media interactions, and ad performance—HockeyStack has all the integrations you need.

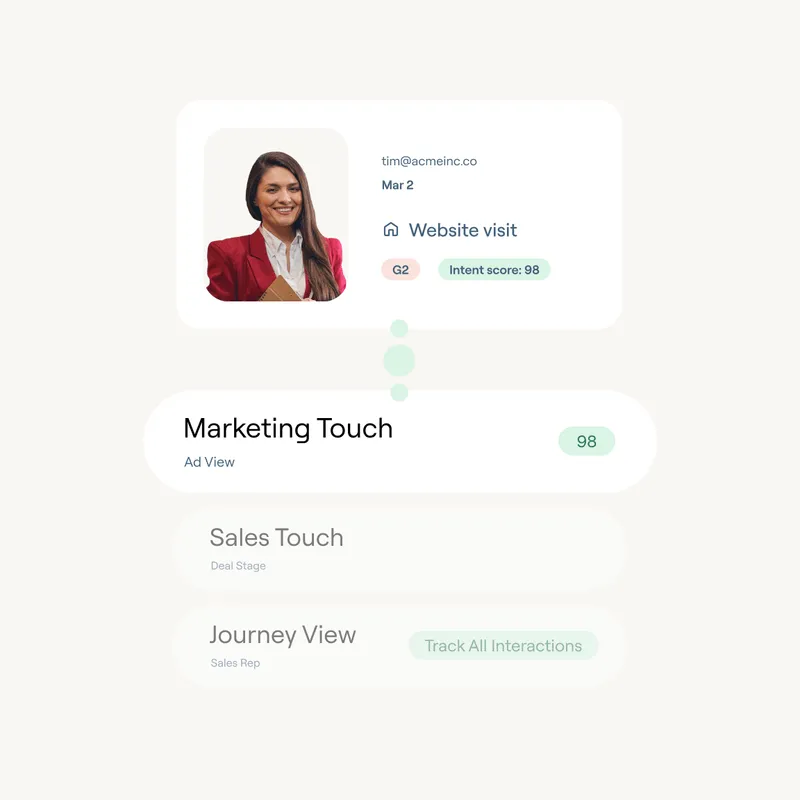
Track Every Step of Your Customer's Journey
HockeyStack delivers comprehensive web analytics to show the complete path from prospect to customer.
You can track meaningful interactions across all channels - from initial blog visits to product demos, email engagement, social media touchpoints, and content downloads.

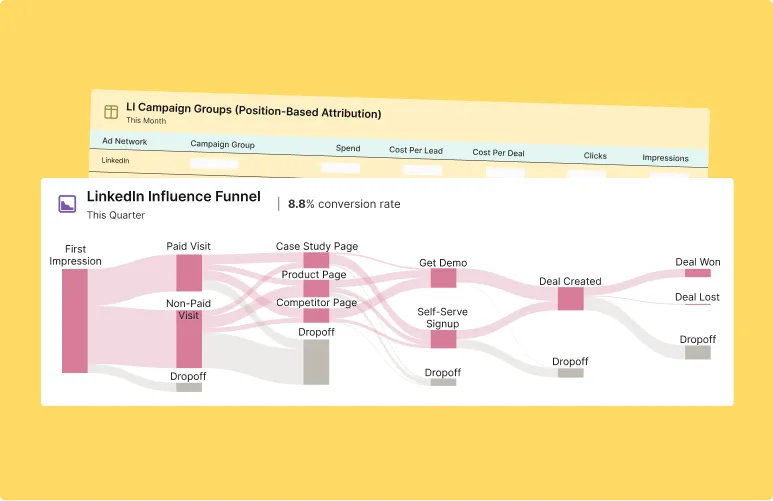
Analyze Your Full Content Funnel
HockeyStack's advanced funnel analytics reveal how users progress from first touch to final conversion across your entire content ecosystem.
You can build custom funnels to visualize exactly how visitors interact with your content and see which assets drive real results.
Track specific engagement points - from blog reads and podcast plays to whitepaper downloads and demo signups - and understand their impact on conversion goals.

Advanced Attribution Modeling Features
Get the Full Picture with Flexible Attribution Models
HockeyStack gives you multi-touch attribution models to pinpoint exactly how each marketing touchpoint contributes to revenue.
Whether it’s first-touch, last-touch, or multi-touch attribution, you have the flexibility to analyze every interaction’s impact on the customer journey.
Build Custom Attribution Models That Fit Your Business
HockeyStack doesn’t lock you into one-size-fits-all models—you can create customized attribution models that precisely match your specific marketing goals and customer journey.
Whether you need to assign more weight to key touchpoints or apply time-decay logic, you have full control over how conversions are tracked.
This level of customization means you can accurately measure impact across varying sales cycles, complex multi-touch paths, and channel-specific conversions.
AI-Powered Content Predictions
Want to know what content will work before you create it? HockeyStack's AI modeling feature analyzes your marketing data to predict which content investments will drive the best results.
Machine learning models look at your historical performance and current trends to make smart recommendations.
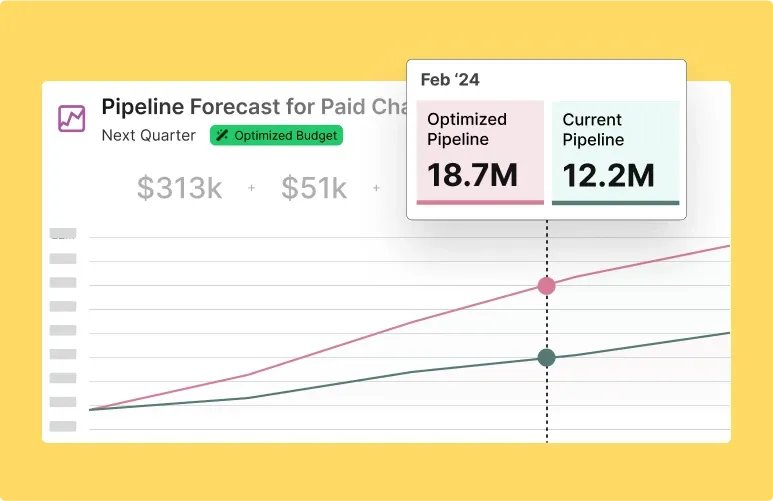
Before you invest in new content, you'll know whether case studies might outperform blog posts, or if white papers are likely to generate more leads than webinars.
Instead of waiting weeks to measure success, you'll launch campaigns knowing they're positioned to perform.
Measure Campaign Impact Without Complex Tests
HockeyStack’s Lift Analysis shows you how your content influences results by comparing audiences who engaged with it to those who didn’t—no complicated experiments required.

Instead of guessing whether a campaign actually moved the needle, you get clear, data-backed insights that separate correlation from causation.
Get Deep Insights into the Customer Journey
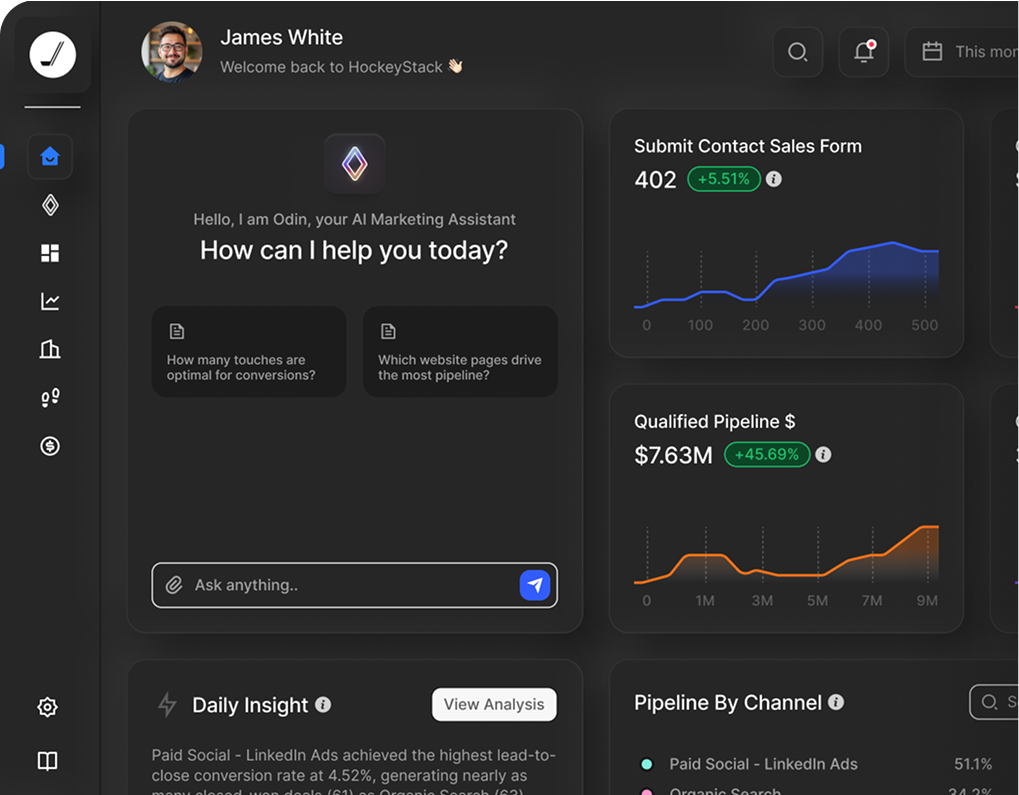
Visualize Content Performance with Automated Reports and No-Code Dashboards
HockeyStack’s dashboards make it easy to visualize your customer journey and measure content performance—no complicated setup, no endless spreadsheet digging.
With simple drag-and-drop controls, your team can build reports that clearly show how content impacts business results. There’s also a library of pre-built dashboard templates if you want to skip building one from scratch.
Here’s what your content team gets:
- A unified view of all content assets—blogs, videos, case studies—so you can track engagement, conversions, and ROI in one place.
- Effortless stakeholder updates with clean, organized reports that make content impact easy to understand.
- Fully customizable dashboards that focus on the KPIs that matter most—whether it’s ROI, content performance, or user behavior.
Cookieless Tracking Technology
HockeyStack lets you see exactly how your audience interacts with your content—without relying on cookies.
Our advanced fingerprinting technology tracks users across sessions and devices while respecting privacy regulations, so you can get a complete and accurate view of engagement.
Unlike traditional tracking methods, this runs seamlessly in the background without slowing down your site or disrupting user experience.
See Exactly Who’s Engaging with Your Website
Traditional analytics tools like GA4 tell you what’s happening on your site, but they don’t tell you who’s behind the activity. That’s where HockeyStack steps in.
HockeyStack ties website activity to both individual users and their companies, and gives B2B teams the insights they need to track real buyer journeys.
You’ll see exactly how potential customers engage—from their first visit to your pricing page to reading case studies and booking a demo—while also knowing which company they represent and their role within it.
Save Time and Resources
Real-Time Website Insights & Alerts
HockeyStack’s real-time monitoring helps you engage with potential customers at the right moment. Instead of waiting for reports, you get instant visibility into key website activities.
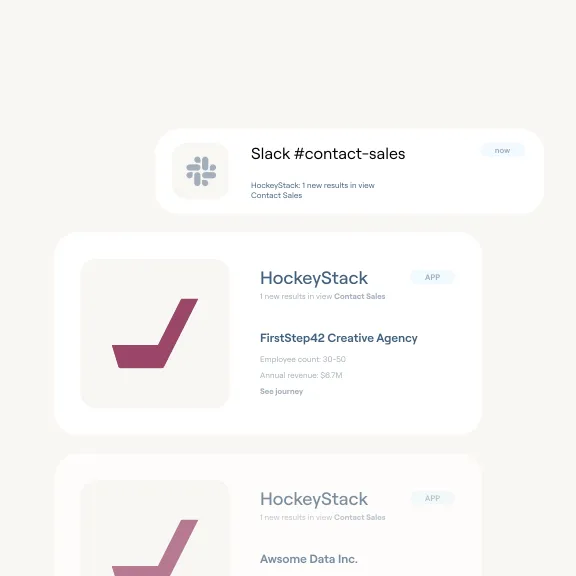
With Slack integration, your team receives real-time alerts when target accounts visit, decision-makers check your pricing page, or prospects engage with high-intent content like case studies.
For B2B sales teams, this means you can act on opportunities as they happen—like following up when a prospect revisits your site after a sales call—so you can stay proactive rather than reacting days later.
Get Clarity on How Buying Committees Engage with Your Content
HockeyStack’s Deal Insights gives you a window into how different stakeholders—whether CMOs, VPs, or marketing leads—interact with your content throughout the buying process.
This means your content team can create more targeted assets that speak directly to technical leads, finance executives, or marketing managers, and make sure every touchpoint moves the deal forward.
Helps You Make Data-Driven Decisions
Pinpoint Weak Spots and Optimize in Real Time
HockeyStack’s attribution data gives you instant clarity on what’s working—and what’s not—so you can quickly outline underperforming channels, campaigns, or content.
If a campaign is driving traffic but failing to convert, you can refine the messaging, tweak the targeting, or move the budget to higher-performing efforts.
Make Decisions Based on Actionable Insights
HockeyStack converts complex analytics into clear insights that teams can use to make confident, data-driven decisions.
With your data organized in an accessible format, the platform ensures both marketing and sales teams can easily interpret and act on key metrics.
This leads to better collaboration between teams and ensures everyone works from the same reliable data source.
Measure the Performance of Your B2B Content Marketing Efforts with HockeyStack
HockeyStack is the all-in-one analytics platform that content marketers can use to bring all relevant marketing data together in one unified platform.
While traditional analytics tools leave you piecing together data from multiple sources, HockeyStack centralizes your data in one location, so you can get crystal-clear insights into how your content drives real business results.

It's specifically built for B2B companies who need to understand complex buyer journeys and prove the true impact of their content marketing efforts.
Whether you're struggling to prove content ROI, trying to understand which assets drive conversions, or looking to optimize your content strategy, HockeyStack provides the comprehensive analytics solution you need.
Book your demo today and see how HockeyStack can transform your content marketing analytics.
Enterprise B2B Attribution Excellence: Measuring and Proving Real Impact
Learn how to measure and prove true impact with b2b enterprise attribution models. Explore data governance, identity resolution, real time insights, and how HockeyStack turns attribution into action for GTM teams.


Ready to see HockeyStack in action?
HockeyStack turns all of your online and offline GTM data into visual buyer journeys and dashboards, AI-powered recommendations, and the industry’s best-performing account and lead scoring.
Ready to See HockeyStack in Action?
HockeyStack turns all of your online and offline GTM data into visual buyer journeys and dashboards, AI-powered recommendations, and the industry’s best-performing account and lead scoring.
