What is Event Tracking? Definition and Tools to Track Events
Customers have countless interactions with your brand daily. What would happen if you could track all of these interactions and understand the reason behind them? An increase in customer satisfaction, retention and MRR, because understanding customers’ experiences is the first step in providing a better experience.
To learn more about all the ways tracking interactions can benefit your brand, keep reading.
What are the benefits of event tracking?
Event tracking brings to your product numerous benefits and advantages. Not only can you track basic metrics that help you view data, such as page views and traffic channels, but event tracking also allows you to understand the motivation behind every customer touchpoint.
Below are some of the benefits of event tracking:
- Gives you insight into your customer demographics.
Your customer base comprises people from different regions, industries, ages and genders. Event tracking shows you the actions taken by customers from different demographics, and this information shows you the varying interests of your customer segments. You can shape your marketing campaigns and ads according to the actions taken by these segments.
- Measures the success of your marketing efforts.
Say that you want to see whether your marketing efforts helped increase your sign-up rate. You analyze customer events and see that most users dropped off before signing up. You also see that the conversion rate and click-through rate are low for sign-ups. All of this tracking shows you how successful your current marketing strategy has been. Pairing customer event data with marketing metrics in this way helps you track marketing performance.
Event tracking can also show you the platforms you should be working on. For example, while analyzing events, if you see that Twitter users’ clicked on your post and Facebook users scrolled past, you can understand that optimizing Facebook ads and working harder on your posts is your must”.
Also with event tracking, you can see the platforms capable of bringing you the most MRR. For instance, if you see that the first event in users’ journeys is often clicking on a Linkedin ad, you understand that one of the most popular platforms with a suitable customer profile is Linkedin.
- Helps You Create Better Inbound Content
Event tracking shows you the keywords, topics and posts that get the most interaction. You can use this knowledge while creating content for your inbound marketing strategy: writing more posts featuring popular keywords and subjects is good for both SEO and increasing content engagement.
How can event tracking help you improve the customer journey?
First things first, tracking customer events is a must if you want to improve your products. Paying attention to the habits of your users will eventually bring you success. By tracking events within your product, you can improve the customer journey, get a comprehensive understanding of the touchpoints and take action accordingly.

Tracking the events in users’ journeys is also important to increase your user retention rate. Event-tracking can improve user journeys by highlighting key points that draw people to your product and keep them engaged. Identifying these points can also save you a lot of time and money because it provides valuable information on user behavior. Using this information, you can prolong interaction times and eventually increase the chance of conversion by identifying flaws.
What tools can you use for event tracking?
Several event tracking tool options might confuse you with their use cases and features. I will mention some of the most valuable and well-known event-tracking tools on the market, explain their pricing plans, and describe their features to help you make an educated decision.
Google Analytics
Introduced in 2005, Google Analytics, after acquiring Urchin, has become the most well-known analytics tool. Mostly used as a traffic attribution software, GA can also work as an event-tracking platform. As a traffic attribution tool, Google Analytics can track and report website traffic, allowing you to detect the success of your marketing efforts while reporting your users’ route to your product.
Pricing
Google Analytics is a free software without any payment plans. The features it offers are adequate unless you have a company that needs more advanced analytics features. In this case, rather than the standard version, you may want to check Google Analytics 360, with which you’ll receive more complex features. This version costs $150,000 per year.
Features
Reporting: This feature provides comprehensive reporting on customers and how they interact with your product. These reports include real-time reporting, customer acquisition, engagement, and monetization reports.
Data collection and management: You can collect, organize, and manage data with collection APIs, tag management support, custom definitions, admin API, and data import.
Advertising workplace: The Advertising Workplace gives you a better understanding of the ROI of your media spend across channels, provides you with a space to make informed decisions, and lets you evaluate attribution models. With the advertising workplace, you can view advertising snapshots, conversion path reports, and model comparison reports.
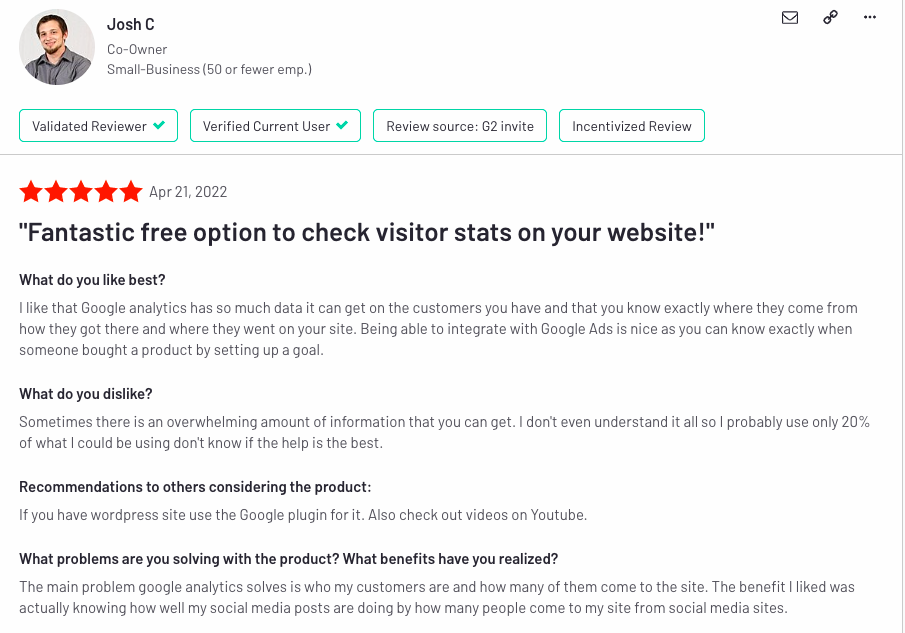
Reviews
“I like that Google analytics has so much data it can get on the customers you have and that you know exactly where they come from, how they got there and where they went on your site. Being able to integrate with Google Ads is nice as you can know exactly when someone bought a product by setting up a goal.”
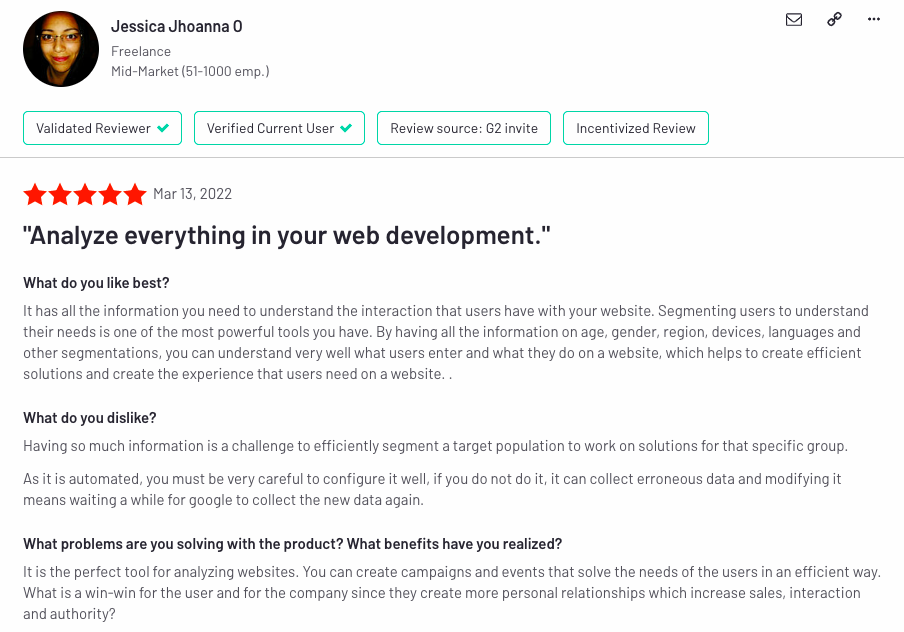
“It has all the information you need to understand the interaction that users have with your website. Segmenting users to understand their needs is one of the most powerful tools you have. By having all the information on age, gender, region, devices, languages and other segmentations, you can understand very well what users enter and what they do on a website, which helps to create efficient solutions and create the experience that users need on a website.”
HockeyStack
HockeyStack is a web analytics tool that allows you to retroactively track any event and map out customer journeys to dive deeper into customer behavior. With the ability to build custom dashboards with any number of metrics, HockeyStack allow you to connect the dots to better understand what drives revenue for your SaaS.
For example, you can build a churn by the blog post user signed up report:

A report to measure the exact revenue you get from blog posts:

A trial to expansion funnel:

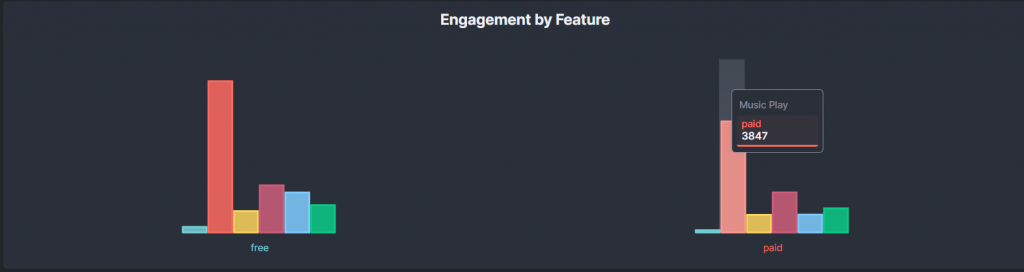
An engagement by feature report:
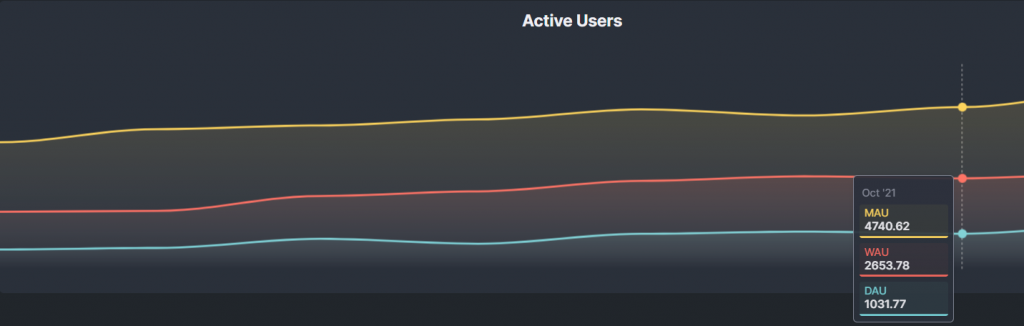
Or an active users report:
On top of custom dashboards, HockeyStack has other features too, such as
- Surveys
- Step-by-step user journey
- Funnels & goals
- Revenue Attribution
and more.
HockeyStack Pricing
You can check out the pricing page here.
HockeyStack Integrations
- Paddle
- Stripe
- Hubspot
- Crisp Chat
- Mailchimp
- Intercom
- Pipedrive
- Chameleon
- Salesforce
- Zapier (coming soon)
HockeyStack Summary
The unique benefit of HockeyStack is its ability to unify your marketing, revenue, sales, and product data using no code. This allows you to uncover unique insights that you wouldn’t be able to by using multiple tools as they cause you to have fragmented data.
- You can integrate with Stripe, Paddle, Hubspot and other SaaS platforms to build every single dashboard that you can think of, using all sales, marketing, revenue, and product metrics.
- You can create funnels, goals, and surveys, which are rare to get with other tools on this list.
- You don’t need any developers, tracking is cookieless, and the script is small, so it doesn’t increase your site loading time.
Reviews
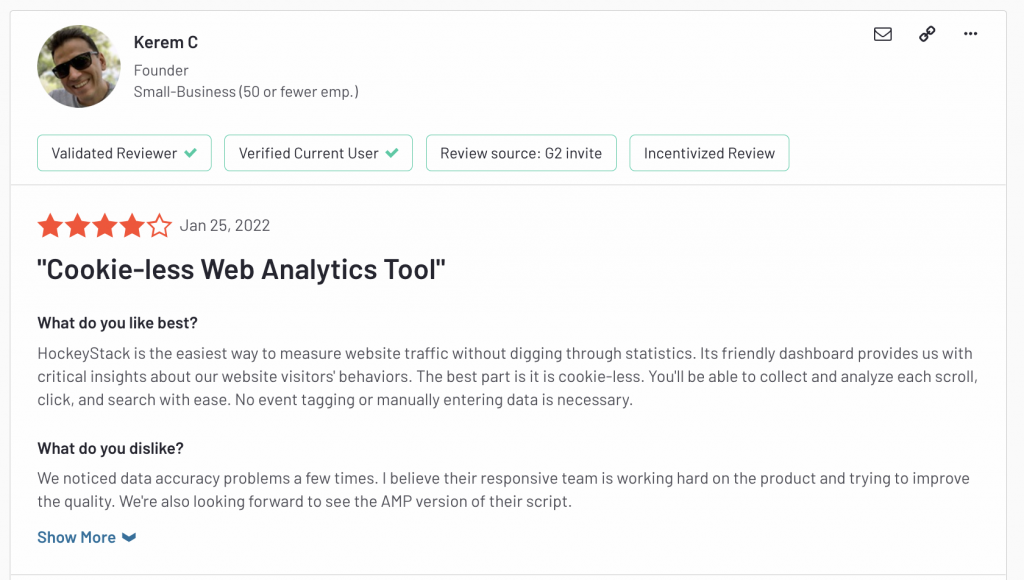
“HockeyStack is the easiest way to measure website traffic without digging through statistics. Its friendly dashboard provides us with critical insights about our website visitors’ behaviors. The best part is it is cookie-less. You’ll be able to collect and analyze each scroll, click, and search with ease. No event tagging or manually entering data is necessary.”
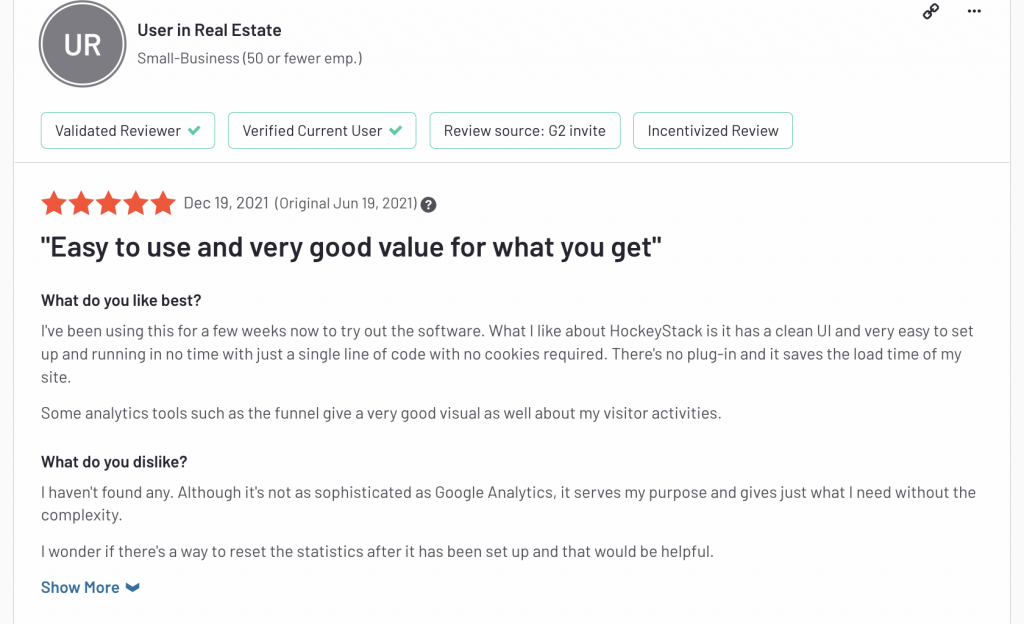
“What I like about HockeyStack is it has a clean UI and very easy to set up and running in no time with just a single line of code with no cookies required. There’s no plug-in and it saves the load time of my site.”
Matomo
Matomo was founded in 2007 with the name Piwik. Later in 2018, the company decided to replace Piwik with a name related to the words Free, Open Source and Private, which are the defining aspects of the company’s tool. The name Matomo was then given to the brand, which means decent in Japanese.
Matomo provides you with a 360 view of visitors. As an open-source analytics platform, it enables you to get insights into your users’ behaviours and gives its users control over their data.
Matomo values and focuses on privacy and privacy regulations. The tool offers 100% data ownership, reliability & security, open-source analytics, 100+ integrations, visitor profiles, and conversion optimization features.
Pricing
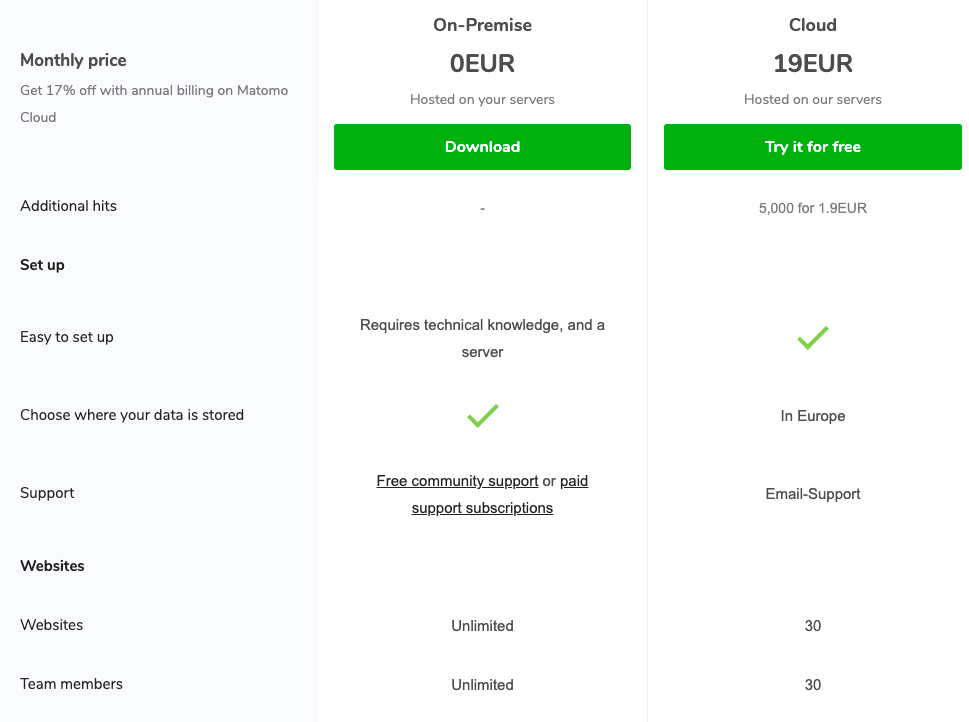
Matomo offers two pricing plans for you: On-premise and Cloud. The on-premise plan is free and offers limited features. You are required to pay to use the rest of them. On the other hand, a cloud plan costs €19 for 50,000 hits and more if your monthly traffic hits increase. You can also try the Cloud plan for 21 days without paying.
Use cases
Complete analytics: Matomo’s complete analytics offers you a full range of features to help you evaluate the user journey. Features include media analytics, content interactions, transitions, row evolution, and all the standard metrics.
Intranet analytics: This feature allows you to gain insights into your internal websites. With Matomo, you have 100% data ownership to measure internal KPIs without sending information to third parties.
Log analytics: This use case is for you if you don’t want to insert JavaScript tracking code for privacy reasons. You can get insights to make data-driven decisions more securely without compromising your business’s integrity.
Reviews
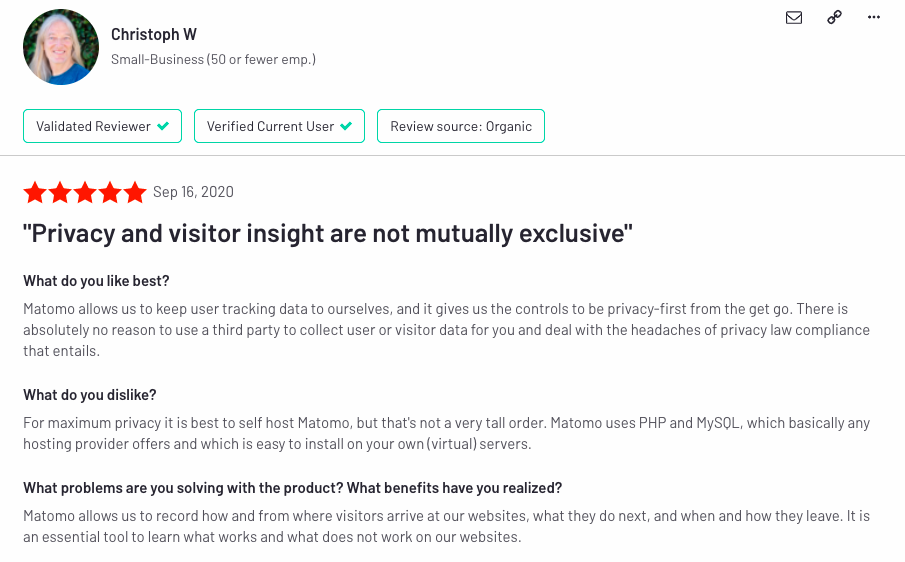
“Matomo allows us to keep user tracking data to ourselves, and it gives us the controls to be privacy-first from the get go. There is absolutely no reason to use a third party to collect user or visitor data for you and deal with the headaches of privacy law compliance that entails. Review collected by and hosted on G2.com.”
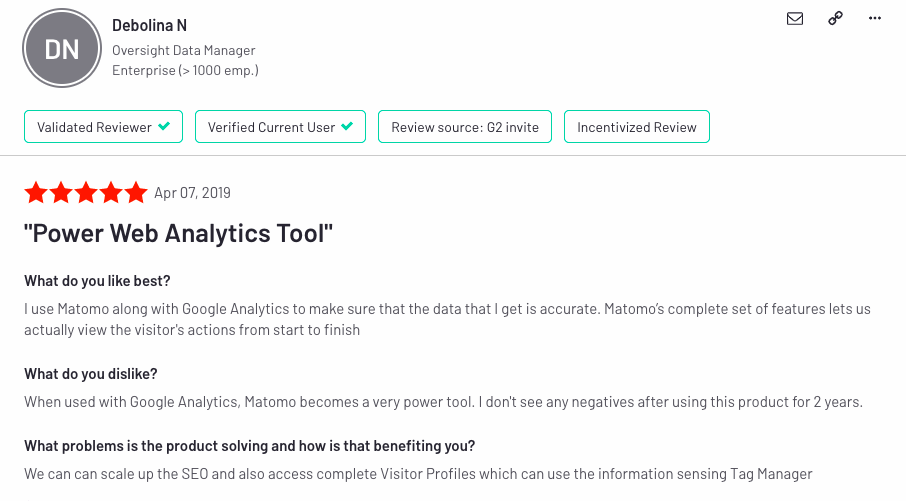
“I use Matomo along with Google Analytics to make sure that the data that I get is accurate. Matomo’s complete set of features lets us actually view the visitor’s actions from start to finish”
CleverTap
Founded in 2013, CleverTap is a retention cloud that helps you measure customer retention rate and lifetime value. It provides a unified data layer and AI/ML-powered insights to increase customer loyalty by building strong relationships between users and your product.
Pricing
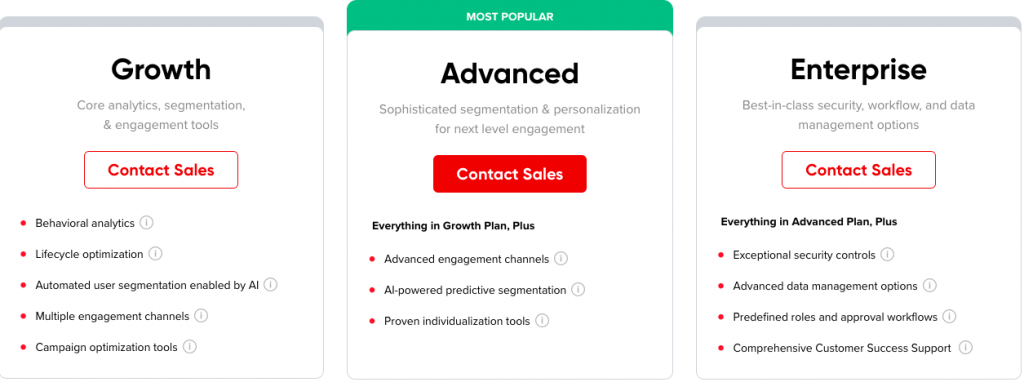
CleverTap offers three different pricing plans: Growth, Advanced, and Enterprise. To get information on their prices, you need to contact sales. Growth offers limited features which allow you to track behavioral analytics and lifecycle optimization while Advanced and Enterprise plans offer extensive features. You can compare them on their pricing and plans website.
Features
Journey orchestration: You can build and deliver omnichannel campaigns of your users’ behaviors and lifecycle using journey orchestration. This feature also lets you automate these campaigns across any channel. Lastly, getting detailed insights into your campaigns’ performances is possible.
Behavioral analytics: This feature enables you to track behaviors and uncover user trends. You can profile data, create conversion funnels, and spot patterns of your users. This way, you can get a complete view of every user, what they do on your product, how many uninstall it, and measure performance through other metrics.
Lifecycle optimization: With lifecycle optimization, Clevertap helps you convert casual users into loyal customers. It provides two different frameworks: AIC and AARRR. You can experiment with different campaigns and scale the winning campaign to better your LTV and retention.
Reviews
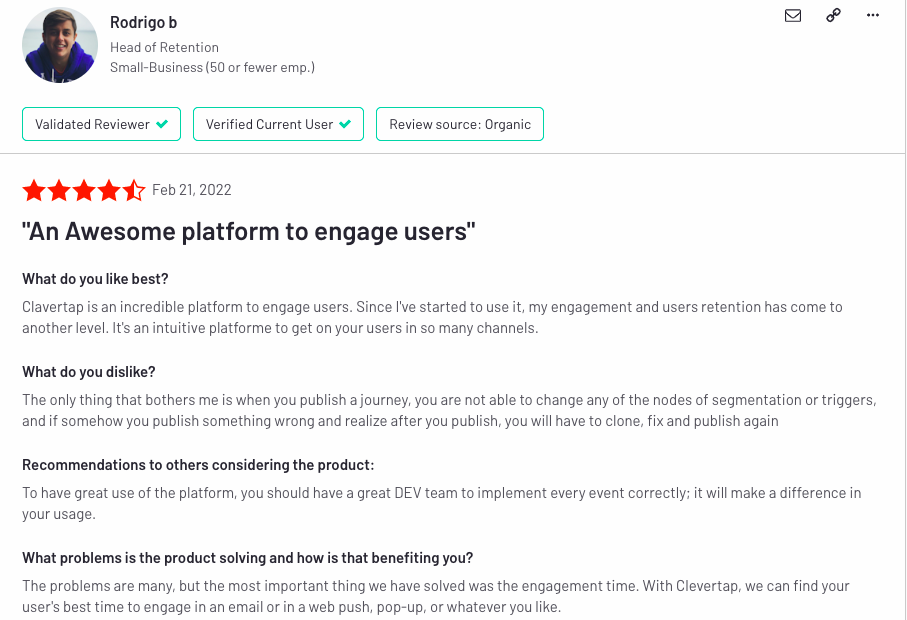
“Clavertap is an incredible platform to engage users. Since I’ve started to use it, my engagement and users retention has come to another level. It’s an intuitive platform to get on your users in so many channels.”
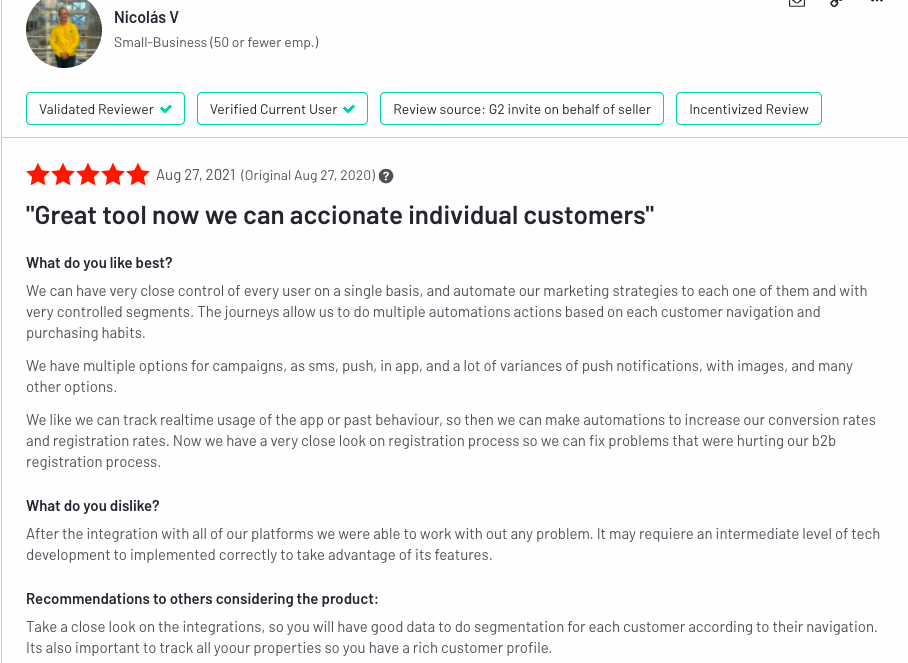
“We can have very close control of every user on a single basis, and automate our marketing strategies to each one of them and with very controlled segments. The journeys allow us to do multiple automation actions based on each customer’s navigation and purchasing habits.
We have multiple options for campaigns, such as SMS push, in-app, and a lot of variances of push notifications, with images, and many other options. We like we can track real-time usage of the app or past behaviour, so then we can make automations to increase our conversion rates and registration rates. Now we have a very close look on the registration process so we can fix problems that were hurting our b2b registration process.”
Fullstory
Launched in 2014, Fullstory offers digital experience intelligence that helps you optimize the user experience by a video-like replay of real user sessions while integrating with SaaS products. Fullstory aims for a more user-friendly product than other software.
Pricing
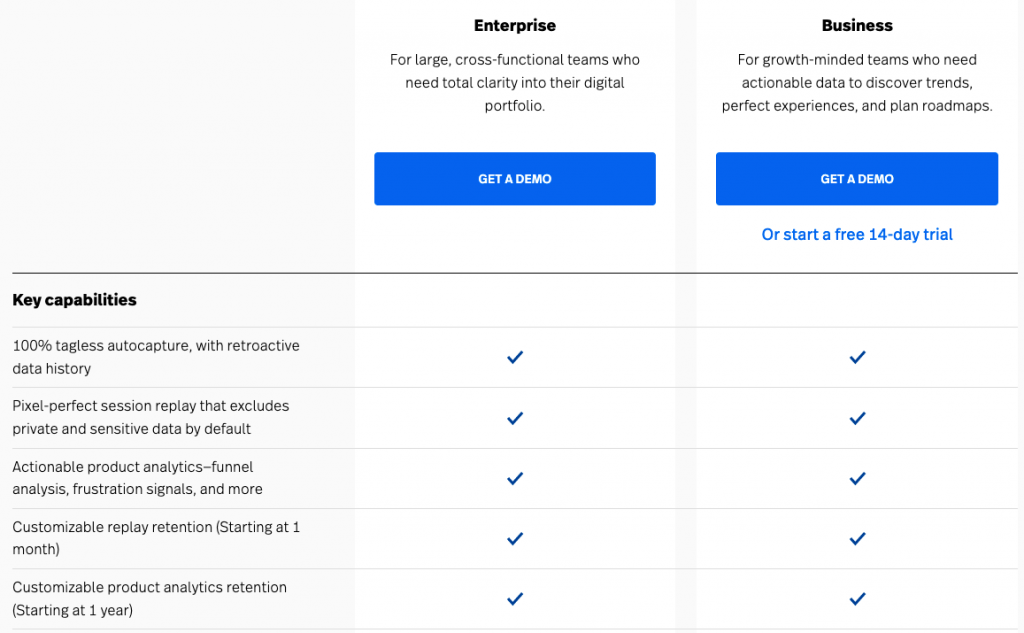
There are two plans Fullstory offers: Enterprise and Business. You can get a demo for each of them and get a price by contacting sales. The business plan also comes with a free 14-day trial. Both plans propose similar features, while the Enterprise plan offers some extra features such as multi-organization management, data export, and journey mapping.
Features
Complete data capture: Fullstory, unlike other platforms, brings you a patented DX data engine that automatically logs every aspect of user interactions without the need of manual tracking. One single code logs all fundamental event-tracking metrics such as page views, scrolls, clicks, and swipes. You can manage and edit them retroactively.
Product analytics: This feature provides you with information you might not know about your product’s performance. You can detect factors that impact your conversion rates, such as script errors, device-specific bugs, and slow pages. You can also visualize these factors with dashboards and maps.
Session insights: You can replay sessions and watch customers’ interactions with your product.This way, you can visualize the “why” and “how” of the user experience and optimize conversion rates by resolving issues.
Reviews
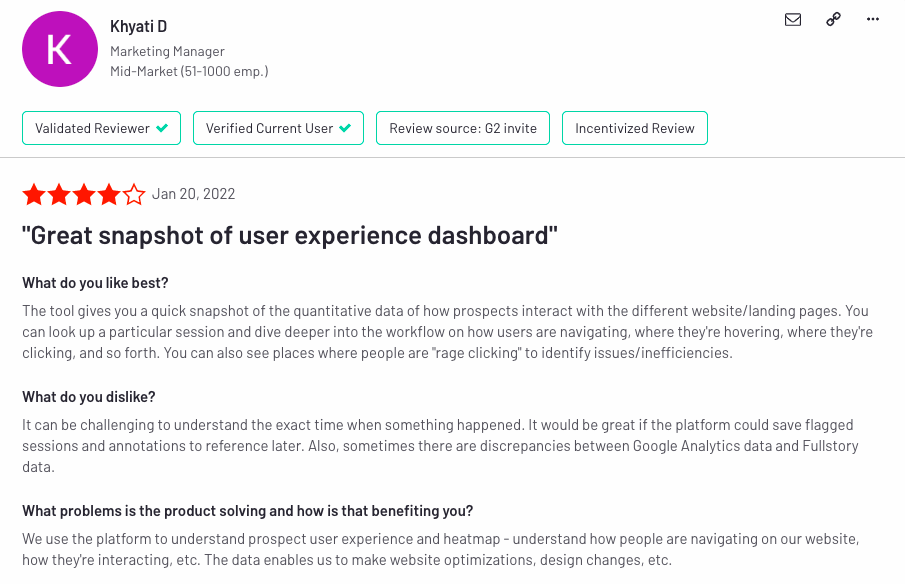
The tool gives you a quick snapshot of the quantitative data of how prospects interact with different landing pages. You can look up a particular session and dive deeper into the customer journey, by seeing where users are hovering, where they’re clicking, and so on. You can also see places where people are “rage clicking” to identify issues/inefficiencies.”
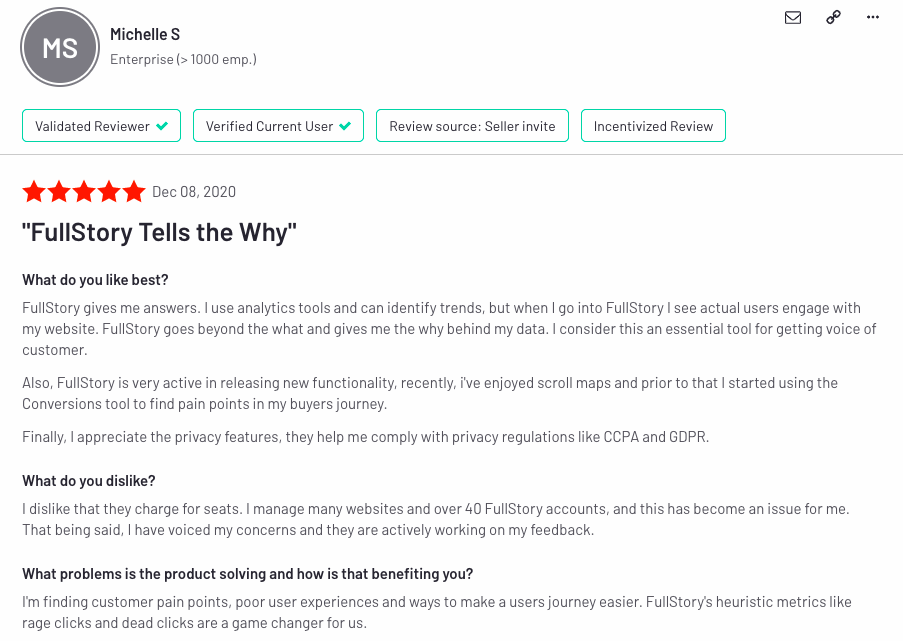
“FullStory gives me answers. I use analytics tools and can identify trends, but when I go into FullStory, I see actual users engaging with my website. FullStory goes beyond the what and gives me the why behind my data. I consider this an essential tool for getting the voice of customers. Also, FullStory is very active in releasing new functionality; recently, I’ve enjoyed scroll maps and prior to that I started using the Conversions tool to find pain points in my buyers’ journey. Finally, I appreciate the privacy features; they help me comply with privacy regulations like CCPA and GDPR.”
Conclusion
Event tracking might seem impossible when there are so many platforms, landing pages, and ads that are part of your marketing strategy. However, using the right analytics tool lifts the burden of tracking data from your shoulders. Once you automate the process of event tracking, you can gather greater insights into your customers’ purchasing behavior. The only thing left for your company to do then is to use the data to increase customer satisfaction and loyalty.
FAQs
Event analytics is a method to track any interactions, events, or digital touchpoints between your product and users.
Tracking events helps you improve your product by understanding the behaviors of your users, such as why they complete certain steps within your product. In this way, you can revisit marketing KPIs by knowing what your users expect.


