7 Subscription Analytics Tools for SaaS Businesses
Running a SaaS business on a subscription model has become incredibly popular over the past few years. However, retaining users in the long term can take a lot of work.
In that case, businesses must delve into consumer data to find how to reduce the churn rate. However, not all subscription analytics tools can provide you with the bigger picture.
Looking to make better business decisions? We’ve researched and compared 7 tools listed below:
- ProfitWell
- Baremetrics
- HockeyStack
- ChartMogul
- Zuora Analytics
- Qonversion
- Vindica
You won’t have to do any of the hard work here. We’ve analyzed each of these tools based on its features, pricing, and more so that you can use this list to make the best choice for your SaaS.
What Are Subscription Analytics Tools?
Analytics matter when it comes to customer retention. Subscription analytics provide a high-level snapshot of key metrics related to your SaaS business. They include subscriber data, average revenue per account, annual/monthly recurring revenue, etc.
Subscription analytics software is used by sales teams to keep track of those KPIs as well as for the growth of the business. These tools capture data at every touchpoint to forecast a potential report for future organizational development.
Additionally, they can identify prospective consumer bases and the impact current advertising has on them so that it’s easy to scope new expansion opportunities.
How Can You Select The Right Analytics Tool for Subscription Analytics?
From a business perspective, it’s important to perform due diligence and thoroughly examine what tools would provide you with the right kind of data. Obviously, those aren’t the only factors one should consider.
Here’s what else you need to take a look at when choosing a subscription analytics platform:
- Integration capabilities: When looking to introduce new software in an organization, it’s easy to get distracted by flashy features. What you should consider is whether it fits in with your old systems. Moreover, think about whether you can transfer your data seamlessly.
- Pricing: Budget is a defining factor when picking a subscription analytics software. Figure out how much you can and are willing to invest. Then have a look at what’s possible within that scope.
- Easy data visualization: Having a single dashboard for all data overviews is a dream come true for SaaS businesses. There’s no need to switch between various programs. You get a one-page summary with all the meaningful metrics. If the data points are spread out, it leads to more confusion and back-and-forth among teams.
- Opportunities for collaboration: To make better and more informed decisions, you must allow stakeholders and teams to engage with these analytics. Sharing information at a cross-functional level enables them to solve problems much faster and innovatively.
- Good customer reviews: If other leaders in the industry say that something is working, you can expect that you’ll have a similar experience. Positive reviews give you confidence and trust in a tool’s success rate. They are an invaluable feedback source that ultimately affects your final purchasing decision.
Subscription Analytics Tools for SaaS Businesses
Generating data from a subscription analytics tool isn’t the main concern. You should be looking at whether the tool you’ve chosen is the right one for your organization.
Ask yourself if their features are providing you with the insights you want. Is this helping grow your business or creating issues internally? We’ve provided information related to all these questions and more by placing some of the best subscription analytics software head-to-head..
ProfitWell
If dealing with subscriber activities and growth feels challenging, ProfitWell can counter that easily. Plus, it can deep dive into each data segment to gain more insight into growth opportunities. About 22,000+ companies in over 100+ countries are using ProfitWell to analyze their SaaS business growth.
Features
- Provides detailed insights on customer journey: It breaks down individual customers’ activities and helps you understand their subscription journey. You can filter according to customer subscription plans, changes, and more.

- Creates comprehensive annual reports: The platform allows businesses to track data such as customer retention, MRR churn, and expansion revenue over time. The visual segmentation of trends is quite useful for predicting future risks and rewards.
Pricing
ProfitWell’s basic plan with limited features is free.

However, there are a few paid products in their arsenal. Here’s what the pricing looks like for them:
- Retain ® (uses subscription analysis to win back customers): Varies per month
- Recognized ® (auditing revenue recognition tool): $1000 per month
- Price Intelligently ( corrects subscription software pricing strategy): $15,000 per month
You can also customize your plan by contacting Profitwell’s team.
Pros and Cons
Pros of ProfitWell:
- Access to business reports and metrics.
- Easily integrated with various subscription and billing platforms like Braintree, Recurly, etc.
- Can be set up within minutes, so it saves a lot of time.
- Offers 24/7 customer support along with a hub of resources.
- Users can customize mobile notifications for specific metrics on the app.
Cons of ProfitWell:
- Some of ProfitWell’s paid products cost a large amount of money which can be difficult for small businesses to afford.
- A variety of features can be difficult for beginners to navigate.
- Some insights might be too complicated to analyze and understand.
Reviews
ProfitWell has an overall 4.3 rating on Capterra with reviews such as :
“ This is the ultimate SaaS dashboard for any growing SaaS company that wants to understand key metrics for their business.”
“Answered all of our high-level questions about customers and revenue.”
Other review platforms, such as G2 state that it is a High Performer for Fall 2022 with a rating of 4.9 out of 5 stars.
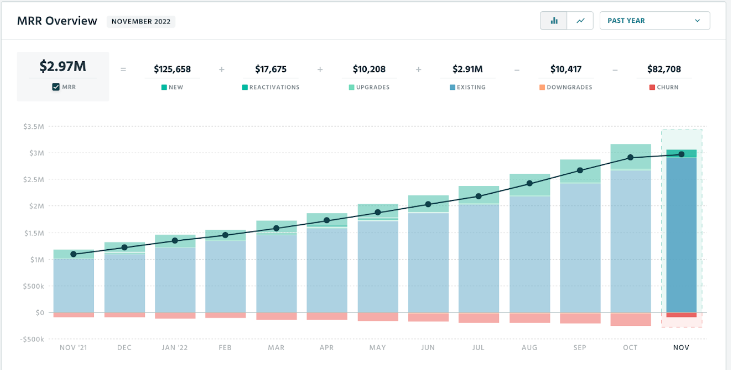
Baremetrics
Baremetrics is an analysis and engagement tracking tool for SaaS subscription models. The platform allows users to track past and present insights that can be used to create strategies for the future. It can even help perform routine health checks on the customer base to monitor retention and churn rates.
Features
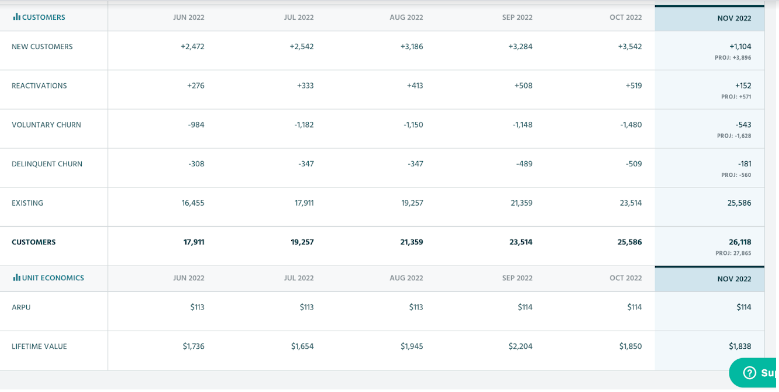
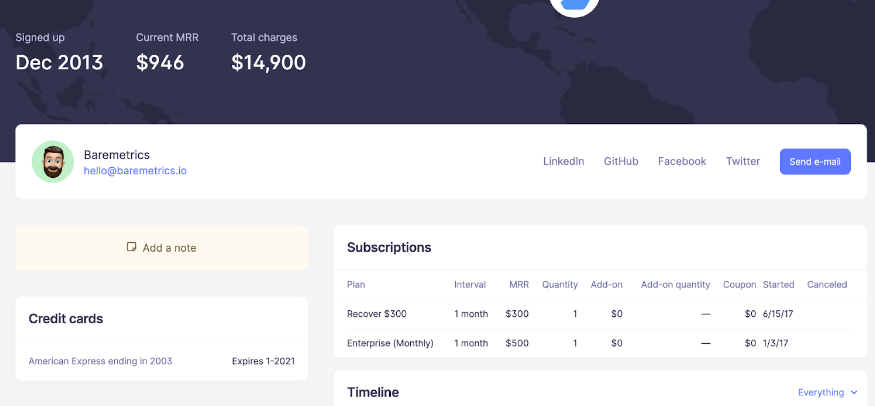
- Detailed customer profiling: The software allows users to create customer profiles. This helps collect required information such as name, address, transaction history, etc and can further drive informed decision-making processes.
- Generates business intelligence reports: Baremetrics helps predict the next steps for your business. Forecast data points like revenue, users, etc., in a set format based on your current business growth. You can make daily, monthly and yearly reports based on your needs.
- Enterprise: $500 per month for MRR up to $500,000
Pricing
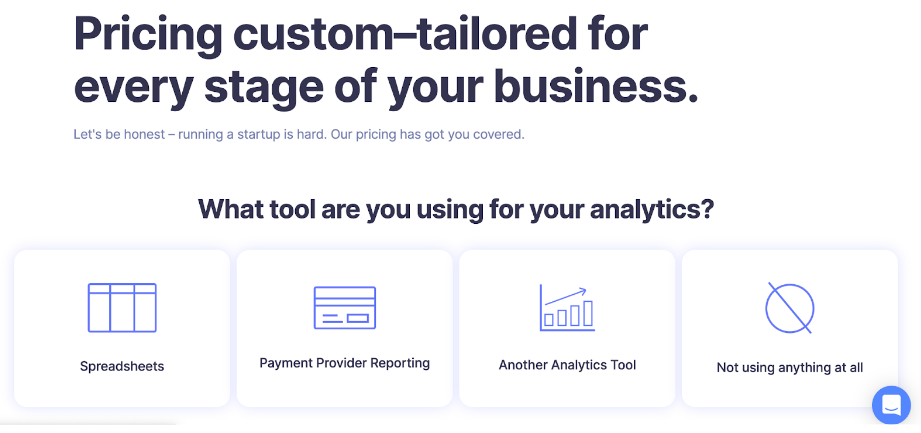
The pricing plan for Baremetrics is customized based on your MRR. Here’s what that looks like:
- Startup: $50 per month for MRR up to $10,000
- Professional: $100 per month for MRR up to $50,000
- Business: $250 per month for MRR up to $200,000
- Enterprise: $500 per month for MRR up to $500,000
Pros and Cons
Pros of Baremetrics:
- Pulls revenue data into a single easy-to-view dashboard.
- Easily integrated with eCommerce tools and subscription billing platforms
- Allows users to learn why customers are canceling and improve using those insights
- Can be used to automate sending emails to consumers to keep them engaged
Cons of Baremetrics:
- Users have issues with data accuracy from time to time
- Difficult to make changes to data insights and the dashboard
- Customer service is not too good
Reviews
On Capterra, Baremetrics has a 3.3 rating with mixed reviews like: “Great idea, horrible execution.”
G2 gives the platform a decent 4.3 stars out of 5. It does have some positive reviews, such as: “Great dashboard and value for money!” “Really easy to use and saves time.”
However, Baremetrics has the highest rating of 9.3 out of 10 on Trust Radius.
HockeyStack
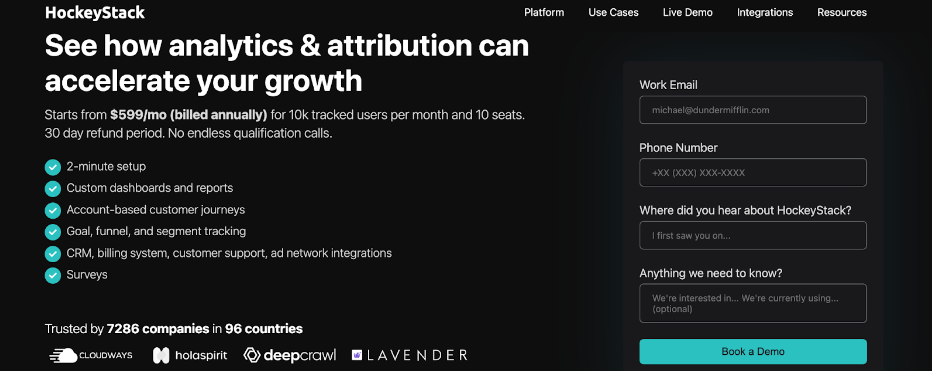
An inexpensive and easy-to-use software solution, HockeyStack, unifies marketing, product, and revenue data to understand what drives user engagement and revenue simultaneously.
Features
- User-Friendly Unified Dashboard: HockeyStack provides an all-in-one solution that maps a consumer’s journey in a unified dashboard. All the data can be analyzed all at once.

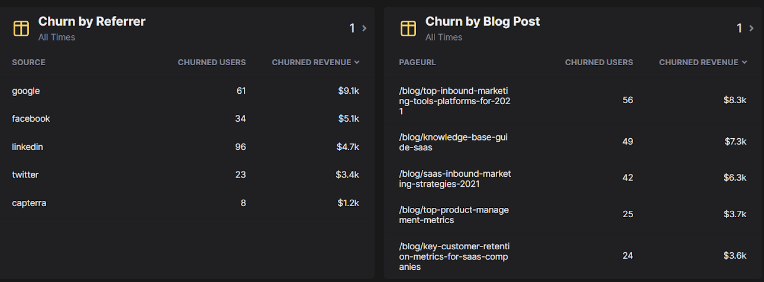
- Detailed consumer data insights: HockeyStack can be used to map out user journeys and identify which pages are responsible for an increase in churn rate or fall in retention rate. It allows users to identify the root cause of the problem and solve it accordingly.
- Unified and customizable revenue reporting: With most subscription tools, it’s challenging to find out which features bring expansion revenue, and more. Since it’s optimized for SaaS analysis, it can generate any report you want to with revenue insights.

Pricing
With an annual billing plan of $599 per month, Hockey Stack stands out from the crowd. You can contact the team to find out information on the number of users and other customizations. You can book a demo too.
Pros and Cons
Pros of HockeyStack:
- No difficult code is needed for setup, and it takes about 5 minutes.
- Provides 100% accurate data from customer retention to all other data points.
- No cookies are used to track user usage and data.
- Everything is customizable due to its user-friendly interface.
Cons of HockeyStack:
- May not be integrated with all platforms, such as Zapier, Intergomat, etc.
Reviews
HockeyStack has a near-perfect rating of 4.9 out of 5 stars on Capterra. With glowing recommendations from industry leaders, for example: “Amazing product, backed by a more amazing support” and “Google Analytics Simplified.” It has a rating of 4.8 out of 5 on G2.
ChartMogul
Want to take full advantage of your subscription data? ChartMogul uses data from various sources to create an easy-to-interpret visual for anyone. This can help gain deeper insights from customer and revenue metrics.
Features
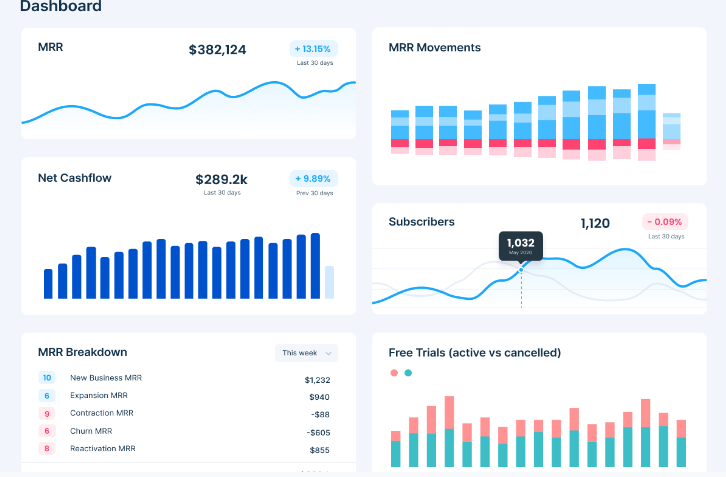
- Straightforward metric tracking and reporting system: This tool makes it easy to keep track of all necessary business metrics on its user-friendly dashboard and interface. You can effortlessly create charts and add filters depending on your needs. It maintains accurate accounting practices when auditing as well.
- Maintains accuracy with data cleaning tools: ChartMogul has features such as merge customers, MRR editing, and more, allowing you to make changes to data that you deem inaccurate or incorrect.
Pricing
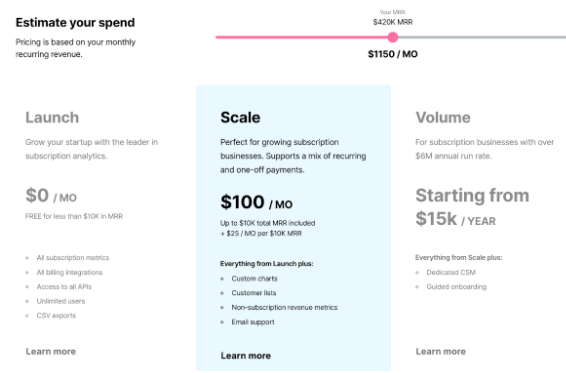
Similar to Baremetrics, the pricing for ChartMogul depends on MRR. The plans are segmented as follows:
- Launch: $0 per month for less than $10,000 MRR
- Scale: $100 per month for up to $10,000 MRR
- Scale: $15,000 per year for over $6,000,000 MRR
Pros and Cons
Pros of ChartMogul:
- Built-in reports that can be customized according to business needs.
- Flexible enough to edit and merge customer data
- Provides all the important insights and data needed without any unnecessary inputs
Cons of ChartMogul:
- There is no live demo available for ChartMogul. They only provide a demo after booking.
- Unable to export dashboard data for reporting without admin access.
- Could be better integrations with platforms such as Zapier, Stripe, etc.
Reviews
ChartMogul has a solid 9.0 out of 10 on TrustRadius and with reviews like “Great revenue insights for SaaS companies” “Easy, clear way to track revenue!”
It even has positive reviews: “Amazing to track sales and performances quickly” “Track what matters in a quick and flexible way” on G2 with 4.6 stars out of 5.
Zuora Analytics
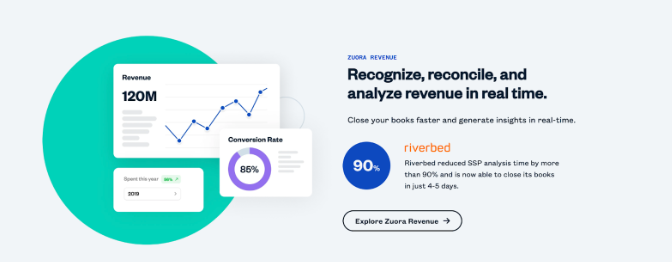
One of the most popular enterprise-level subscription billing solutions is Zuora. It offers extensive metrics, automated tax processing, along with support for numerous currencies. Additionally, it provides out-of-the-box interaction with Salesforce and NetSuite.
Features
- Interactive and Insightful Dashboard: Through powerful trend analysis, Zuora Analytics helps to examine revenue by product, time period, and area. Its dashboard has a drag-and-drop feature, which makes it simpler to move and manipulate data.

- Cuts out manual work: By sorting out data in manageable spreadsheets, Zuora Analytics makes manual processes redundant. It uses a built-in subscription metric library to track the important KPIs in an organization.
Pricing
Zuora Analytics has a variety of other related products that can be used simultaneously. You can get in touch with their sales team for detailed pricing information.
Pros and Cons
Pros of Zuora Analytics:
- Built-in metrics that can be edited to provide important customer and trend insights.
- Automates billing and revenue processes to scale business growth
- Supports multiple languages other than English
Cons of Zuora Analytics:
- Metrics are monthly, not annual, which can be challenging
- Could have better user training and materials available
Reviews
TrustRadius scores Zuora as a whole – a 7.7 out of 10. Whereas G2 focuses on Zuora billing, rated 4 stars out of 5 with reviews ranging from “ Awesome and User-friendly software” to “It didn’t work for us.”
Qonversion
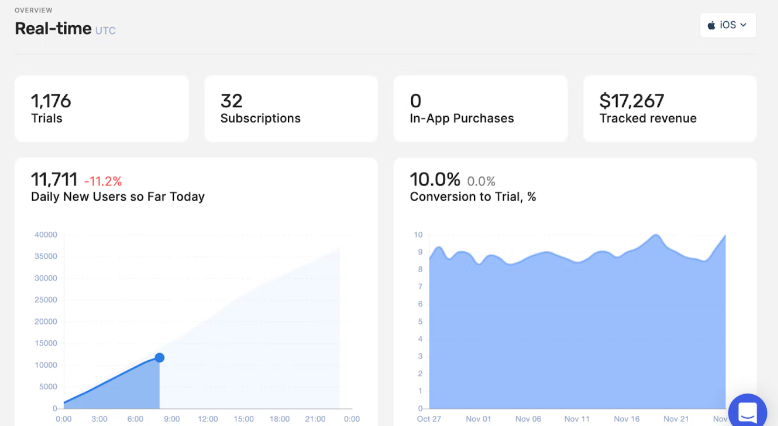
For mobile-first subscription companies, Qonversion provides subscription analytics with leading marketing, attribution, and product analytics capabilities. It can be used for in-app subscriptions as well.
Features
- Built-in subscription infrastructure: By integrating with SDK, you can quickly deploy your subscription infrastructure and save time writing server code. You can send data (especially the first part of the data) to any location.
- Analyze metrics for customer conversion and retention: Tracking user behavior and data improves customer acquisition. It can quickly monitor the real-time performance of apps and help companies improve their revenue.
Pricing
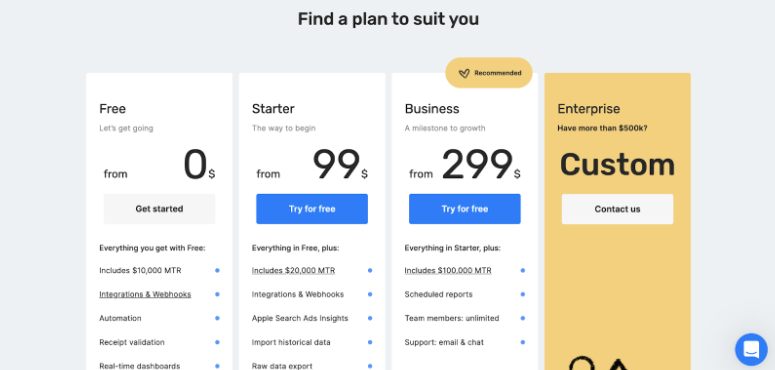
Qonversion also takes MRR into account when determining prices. Here’s an overview:
- Free: $0, including $10,000 MRR
- Starter: $99+ including $20,000 MRR
- Business: $299+ including $100,000 MRR
For those above $500,000 MRR, you’ll have to contact the Qonversion team for custom pricing.
Pros and Cons
Pros of Qonversion:
- Works well with mobile-based applications.
- Easy to interpret visuals providing important insights and data
- Customer service is quite efficient and has a fast response time.
Cons of Qonversion:
- A/B testing needs improvement as it’s still in the beta stage.
- Only useful for app subscription-based businesses, not web-based.
- Minor bugs turn up here and there as the tool is still being tested and updated.
Reviews
G2 rates Qonversion 5 out of 5 stars, which is a glowing review. It’s even won a few titles, as stated below.
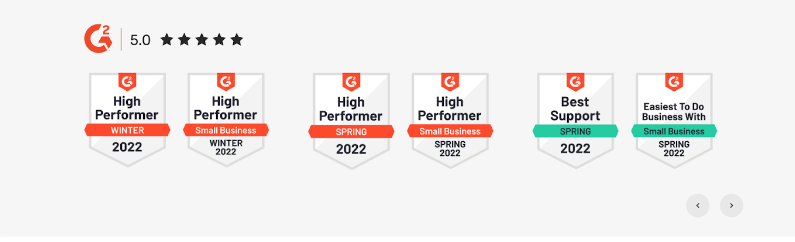
Although the rating on Capterra is 4 out of 5 stars, the platform is recommended by most users.
Vindicia
The platform Vindicia is more focused on SaaS accounting and recurring billing. However, it does provide users with data analysis, strategic consulting, and proprietary retention technology options.
Features
- Resolves churn rate issues: By providing clients with more recurring revenue and better customer insights throughout the subscriber lifecycle, Vindicia pinpoints what causes customers to churn.
- Innovative retention strategy: To win new customers, the platform makes it convenient for customers seeking to streamline their subscriptions by quickly onboarding them. They also partner with complementary businesses to sell more subscriptions across.
Pricing
The pricing for Vindicia depends on one of the three existing packages/ solutions:
- Vindicia Subscribe
- Vindicia Connect
- Vindicia Bundle
After making your pick, contact the Vindicia team for more details.
Pros and Cons
Pros of Vindicia:
- Has a 522% ROI with its customer retention solution
- Seamless integration with other subscription billing and payment platforms
Cons of Vindicia:
- Only applicable to large enterprises and not small or mid-sized businesses.
- Customer support and user knowledge support materials are not enough.
- The lack of reporting tools and a website still cause minor issues/ inconveniences.
Reviews
G2 rates Vindicia 3.6 out of 5. However, other sites, such as Capterra, are yet to rate this platform. Some reviews praise the new software, such as: “Effective in driving revenue” however, it does have some negative remarks as well.
Key Takeaways
Determining your objectives and goals is essential before choosing new software for subscription analytics. With so many options to explore, there’s bound to be some confusion.
Use the list above complete with reviews, features, and pricing information to choose the right subscription analytics software. Remember though, before making your decision, be sure to perform due diligence and check the capabilities and integration options of the tool so that you can analyze your data with ease.
FAQs
What is a subscription analytics software?
Subscription analytics software allows businesses to evaluate revenue and data from new and old subscribers. It also helps track current user activities to identify future growth opportunities.
What is ChartMogul all about?
ChartMogul is a subscription analytics tool that measures and understands recurring revenue in a SaaS business. It provides real-time reporting on key metrics related to a subscription model.


