Top 5 Klipfolio Alternatives: Which One Is The Best?
SaaS businesses have data from different departments stored on various platforms. This causes gaps in analysis, leaving these companies unsure about what really drives their growth.
To mitigate the risk of poor analysis caused by inconsistencies, SaaS companies have to rely on tools such as Klipfolio that allow them to build simple dashboards with automated data extraction and unification. Now, while Klipfolio is great for basic reporting, some users have found problems in the tool, leaving them scrambling for Klipfolio alternatives that will help them achieve their reporting and analysis goals.
In this article, I’ll share with you some of the top Klipfolio alternatives along with their features and pricing to help you make an informed decision when choosing a tool for your SaaS.
HockeyStack
HockeyStack is an end-to-end analytics and attribution tool used by over 7000 companies.
Like Klipfolio, HockeyStack can be used to unify marketing, revenue, sales, and product data into one dashboard with no code so that you can understand what really drives revenue at your SaaS. It’s completely no code and setup takes 5 minutes, so you won’t have to wait long hours or weeks before you can start using your data for decision-making.
What makes HockeyStack a great alternative to Klipfolio is that dashboards are completely customizable. While Klipfolio users have problems changing the elements in their reports, HockeyStack allows you to either choose an existing template or build one from scratch, ensuring that you can track metrics that really matter for your business.
With HockeyStack, you can also answer inter-departmental questions that you cannot answer with any other tool on the market, such as:
- What is the LTV of a blog post?
- Which marketing channel leads to the highest churn rate and what are the reasons for churn?
- Which features are used by the customers who signed up through cold outbound?
and more.
Let’s see what these dashboards look like in action.
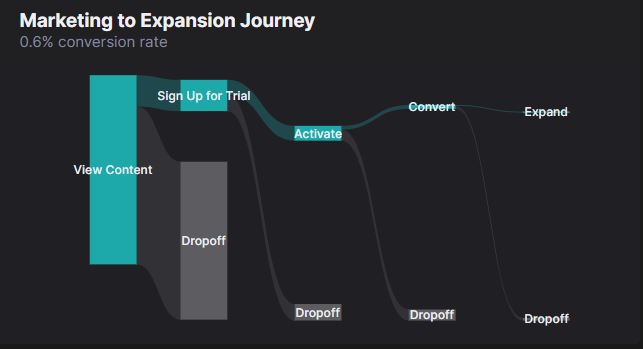
Here’s a sales funnel showing how many users drop off at each stage:

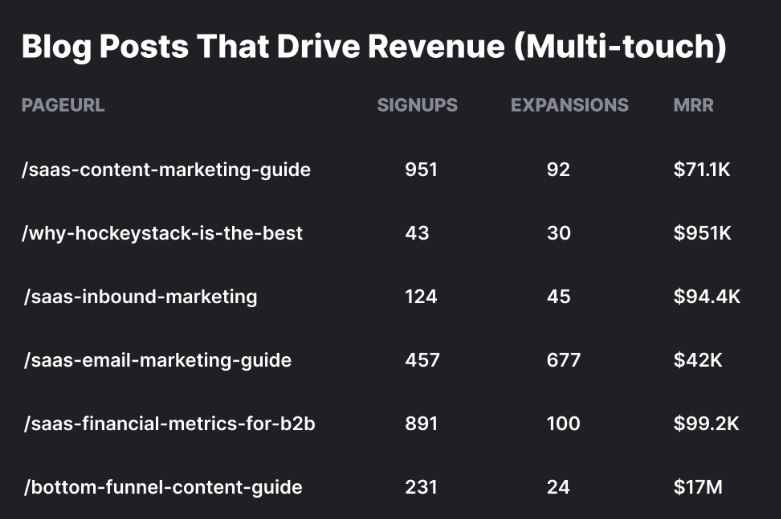
A report showing the top performing revenue drivers:
And a dashboard showing the expansion rate:
By providing answers to questions, HockeyStack allows SaaS businesses to get rid of fragmented data and start understanding what really affects their revenue.
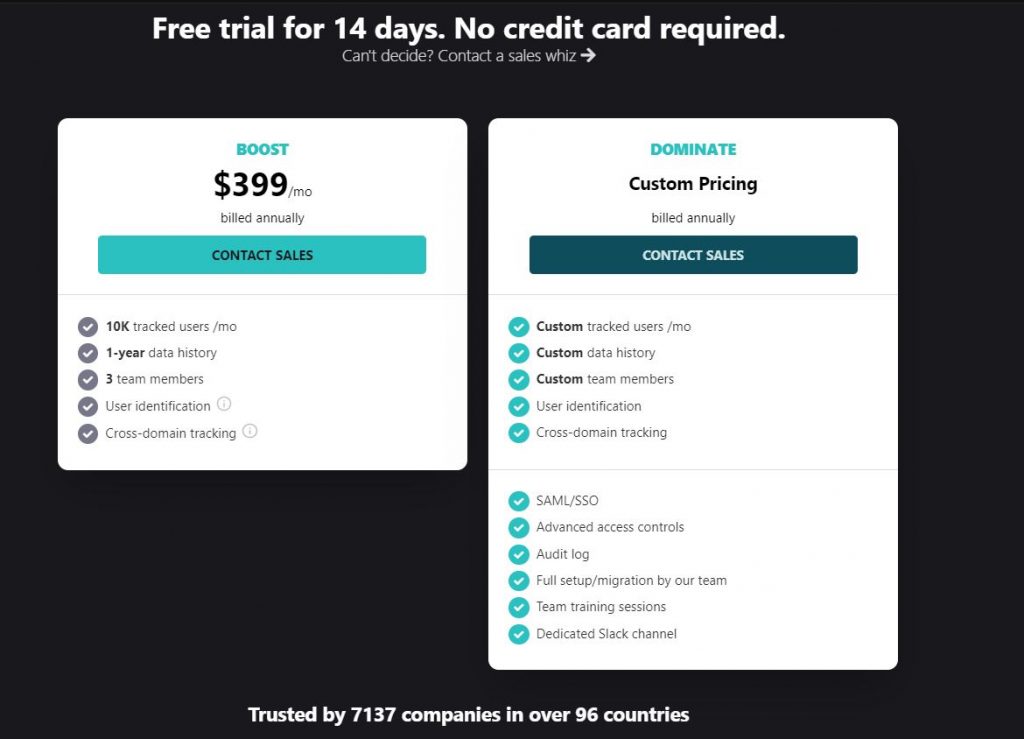
HockeyStack Pricing
HockeyStack has 2 plans, both of which have a 14-day trial with a 30-day refund guarantee.
You can check out the pricing page here.
HockeyStack Integrations
HockeyStack has integrations to plenty of CRMs, sales tools, and email marketing platforms include:
- Paddle
- Stripe
- Hubspot
- Mailchimp
- Pipedrive
- Intercom
- Chameleon
- Salesforce
- Zapier (coming soon)
You can view the full list of integrations here.
HockeyStack Summary
HockeyStack enables you to uncover unique insights that you wouldn’t be able to by using multiple tools as they cause you to have fragmented data. Here’s a quick summary of HockeyStack and what makes it unique:
- You can integrate with Stripe, Paddle, Hubspot and other platforms to build every single dashboard that you can think of, using all sales, marketing, revenue, and product metrics.
- You can create funnels, goals, and surveys, which are rare to get with other tools on this list.
- You don’t need any developers, tracking is cookieless, and the script is small, so it doesn’t increase your site loading time
Google Data Studio
Google Data Studio is a part of the wide-ranging Google services. The software was released in 2016 as a part of Google Analytics 360 Suite. As of this date, Google Data Studio has been a part of the Google Marketing Platform.
I would argue that this software is especially useful for retaining your already existing customers due to its integrations with other Google software and how this can be used for brand awareness.
If you are looking for Google Data Studio alternatives, check out our article!
Features
- Unites your data in one place
- Allows you to create engaging reports
- Improves your team cooperation by sharing information-sharing software
- Compatibility with other Google products
You can check out other integrations of Google Data Studio by checking out their integrations page.
Pros
1. Provides wide-ranging customization options
One of the most important of SaaS businesses is its tailor-made service to its customers. Improving your brand loyalty will result in an increase in user retention rate. Customization options of Google Data Studio not only improve your experience with the product but also enable creating more in-depth reports for your customers.
2. Integrates well with other Google products
Whether it is the search engine or getting where you want to, everybody uses Google products for one reason or another. As a SaaS business, it is important to maximize your integration with significant software. Google Data Studio integrates especially well with other Google products due to the fact that it is a part of Google as well.
3. Wide-ranging team sharing options
It is important for a company with different departments to get the necessary data to individuals who need it. Google Data Studio achieves this and goes further regarding group works by introducing options to track, email, and comment on common subjects with your fellow group members.
This advantage is especially important for relatively more prominent companies that employ multiple groups of people.
4. It’s completely free
An app being free is one thing; however, an app about data analysis being free is something completely different. Google Data Studio providing everything free not only allows you to keep track of your metrics without any cost but also enables you to get the basics of data analyzing without any monetary hassle.
Cons
1.Prone to Crashing
Unfortunately, Google Data Studio tends to crash, and this phenomenon has been observed by its users. Many reviewers claim that his problem is directly related to how much data Google Data Studio analyses, the more data it processes the more crashes users encounter.
Thus it can be concluded that this is generally a problem for companies with bigger user bases.
2. Importing data from other sources can be problematic
Google Data Studio provides multiple data integration options, however, not all of the given data integration options are done smoothly. It is recorded by the community that some certain data sources are prone to crashes more compared to the others. Although please that Google Data Studio has improved on this with the recent updates that it has released.
3. Steep learning curve
Although Google Data Studio provides a great opportunity to get familiar with the basics of data analyzing and storing, note that since it provides all the features with the free version it can be overwhelming at first.
Pricing
There is only one version of Google Data studio and it is completely free.
Reviews
Currently, Google Data Studio has a 4.4 out of 5 in Capterra and a 4.3 out of 5 in G2.
Overall, Google Data Studio has generally got good reviews from its users. Many users claim that Google Data Studio has been their first experience in this sector and was relatively simple to understand. I would argue that, as others claim, this has to do with Google Data Studio having similar to other Google Products since there is a certain number of users that claim there is a steep learning curve.
However, there are multiple shortcomings of Google Data Studio as well. According to its users, many users claim they need an intermediary plugin to integrate their data with Google Data Studio if they want to use their LinkedIn or Twitter data.
DashThis
According to Linkedin DashThis company was founded in 2014 in Quebec, Canada. The company has its headquarters in Quebec, Canada as well. The company currently employs 28 people.
DashThis allows you to keep track of your data and formularize your plans accordingly. You can easily follow your revenue, user activation rate, and other metrics that are important for your business.
Check out all DashThis alternatives!
Features
- Compatible with over 34 marketing tools.
- Allows sharing results as email, pdf and a link to improve your cooperation as a group
- It provides customization options like colour themes, custom domains and custom designs.
- 15-Day free trial
Integrations
- Youtube
- Moz
- Ginza Metrics
- WebCeo
You can access the full list of DashThis integrations by checking out their integrations page.
Pros:
1. Easy to look user interface.
Unlike Google Data Studio, DashThis understands the reason for simplicity. The personalization level of the DashThis allows your user experience to be as smooth as possible by putting the basics of the feature at the centre of your data analyzing process.
2. Affordable for a wide-ranging customer base.
DashThis inarguably offers the widest range of packages, whether pricing or the features provided are considered. Having these options allows companies that are new to SaaS businesses to try new packages according to their needs and find which features are most important for them.
3. Easy to create templates
DashThis templates not only vary regarding the information they provide but also depending on the style they provide the information with. They are also very simple to design, making it possible for anyone to create any template they want.
Cons:
1. Some missing integrations like Pinterest and Tripadvisor
Although DashThis offers multiple integrations, some important ones like Pinterest and TripAdvisor are not present. Although this would not be a problem since not every software can provide integration for every possible option, the lack of integration for these two tools seems to create a problem among the customer base.
2. Customizations are dependent on the payment you make.
DashThis has this unique method where any customization options you are provided is directly related to the package you pick. This situation is especially problematic when it is considered that DashThis is among the most expensive tools mentioned in this article.
3. Some data is adapted only after a day while dealing with new software.
DashThis can often take its time while analyzing and classifying your data. Although this is not the case for all the data analyzing processes, it is a common occurrence among users that utilize DashThis to experience delays in their data analyzing process.
Pricing
DashThis offers four unique packages. These are individual, professional, business, and the standard. Subscriptions can be paid on either a monthly or a yearly basis.

Reviews
According to Capterra, DashThis has a rating of 4.6 over 5 points and a 4.9 out of 5 on G2.
Some users claim that pricing is relatively higher compared to other products that they have utilized, which is a legit concern considering DashThis is one of the most expensive products reviewed in this article.
Whatagraph
Whatagraph is a company that is based in Amsterdam, Netherlands. It was founded in 2015. It has an operational base in Amsterdam, Netherlands, and currently employs around a hundred people.
Whatagraph aims to provide its users with multi-channel marketing data monitoring in real-time to reduce the effort needed by users to analyze their business patterns.
Check out all Whatagraph alternatives!
Features
- Allows multi-channel marketing data monitoring
- Allows you to add custom data
- Provides you with pre-made templates
Integrations
- Mailchimp
- Google Sheets
You can learn more about Whatagraph integrations by checking out their integration page.
Pros
1. Allows gathering metrics from different sources under one category
Whatagraph allows its users to not only track metrics but also group them according to their liking. This is especially important for seasonal businesses that expect a great amount of change in certain metrics and want to keep track of them.
2. Automation is efficient
The most important aspect of Whatagraph is how it enables automation by sending you automated emails and keeping track of your metrics. You can even create alerts that warn you of any important changes among your metrics.
Cons
1. Many bugs that are not solved since the beginning.
There are multiple bugs, some of them really problematic, that are still present within the software since its release. Lack of improvement in this regard is not assuring.
2. It takes a long time to create reports
Both due to interface and software problems, Whatagraph takes time while creating reports for you to inspect.
3. Data sources can be bugged and need readjusting
There is a tendency of Whatagraph to sometimes bug out. This not only halts your analyzing process but also causes you to reboot the entire software to process. It is a possibility that you can lose some of your processes if this happens. This is a bug that is present ever since the release of the software.
Pricing
Whatagraph offers three different packages to its customers. These are the professional, premium and the growth packages. Payments can be done in either United States Dollar or Euro while payment durations can either be annual or quarterly.
Reviews
According to Capterra, Whatagraph has a rating of 4.4 out of 5 and a 4.6 out of 5 according to the G2.
Most of the customers voice the fact that reports made by Whatagraph are visually interesting and easy to look at. This good presentation is also present with their user interface.
One good thing also stated by the reviewers is the number of integrations Whatagraph provides, this is especially important for companies that operate with multiple tools; however, there are also complaints that some specific integrations are not present.
Some customers also claim that there are features in Whatagraph that are not developed fully, but the customer service has provided necessary changes when they got into contact with them.
Databox
Databox is a company that is based in Boston, Massachusetts. It was founded in 2012 and employs around a hundred employees currently. The company has two operational bases, one in Boston and the other in Slovenia.
Databox allows you to keep track of your all metrics and utilize them according to your needs. Databox allows you to determine goals, create alerts and track your metrics.
Check out all Databox alternatives!
Features
- Allows the tracking of your metrics
- Allows you to receive information on metrics you regularly choose by sending them an e-mail or as notifications.
- Provides dashboard integrations
Integrations
- Google Play
- Xero
- SurveyMonkey
- GitHub
You can learn more about integrations provided by Databox by checking out their information web page.
Pros
1. Easy to set up
Databox not only offers important integrations but is also very easy to set up. There are short tutorials explaining how to integrate any data you want and a user-friendly interface makes the entire set-up process and the new data integration easier.
2. Highly Customizable
Databox allows you to pick your priorities and determine a plan depending on your aims, needs, and plan accordingly.
3. Easy to manage
Databox is very user-friendly software. Both its installation and use are very simple and can be utilized by a newcomer. I can easily suggest that Databox is among the most user-friendly software mentioned within this article.
Cons
1. Plans are limited
Although packages’ services change even within a package, many of the features are shared among all three packages. The main difference between the packages provided by Databox is how many data source connections and dashboards they allow.
2. Cancelling a subscription is hard
Pretty much like grow.com, it is hard to get out of any subscription you have with Databox. This process requires you to call the customer center multiple times and answer multiple support emails. Although making sure that there are no mistakes in an unsubscription process is good, many in the data analyzing community claim that Databox utilizes this method to deter people from unsubscribing from their services.
3. Price differences between packages are steep
Although a free version is provided, package prices are indeed high and there is a high steep, especially between the professional and the performer packages. Although this is a problem, the slider-style package choice reduces its importance.
Pricing
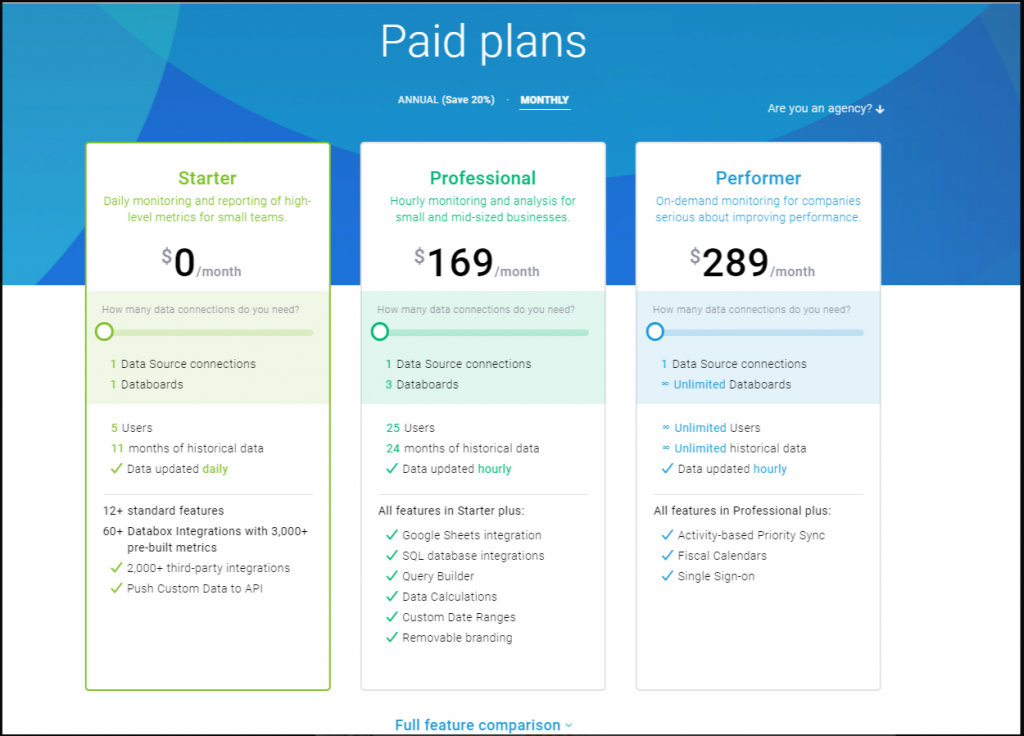
The pricing system of Databox is somewhat different from its competitors. It basically offers three different packages. These are called the Starter Package, the Professional Package, and the Performer package. While all packages have some base features, prices are dependent on how many data source connections and a dashboard you want.
Here is the list of plans with the least amount needed to be paid:
Reviews
Databox has a 4.7 rating out of five according to Capterra, and a 4.4 out of 5 in G2.
One of the essential points underlined by reviewers is that the user interface is both functional and aesthetic. It allows utilizing multiple layers of data and is simple and easy to look at. Databox combines the ease of using simple software with detailed and in-depth information.
Conclusion
In this article, I have analyzed some alternatives for users that are utilizing Klipflio. The software mentioned in the text is all very specialized and aimed at certain types of users.
FAQ
Klipflio is a dashboard platform that aims to classify your data and enable you to use it according to your needs, and increase efficiency.
Klipflio stores the data in Canada according to their privacy policy.


