Product Usage Analytics
In a recent survey of more than 1,000 people, close to 80% of respondents said they use analytics primarily to understand their product usage. They also stated that there is a good reason why they did this.
As it can be seen from the results of this survey, Product usage analytics is of great importance for many companies. There is a fundamental reason for this: Product usage data gives clear information about what users do and why they do in a way no other type of data can.
There are several ways to measure Product usage. If you want to learn more about Product Usage Analytics and how it is estimated, keep reading. This article will answer all the question marks in your mind.
What Is Product Usage Analytics?
Product usage is the analysis of product data to determine how your users interact with your product. Utilizing product usage data, you can decide which part of the product they use the most, which feature they get the most efficiency from, and which features they interact with the least. You can make pinpoint decisions with a strategy you follow based on the objective data you have acquired. As a result, your user engagement will increase with the right plan.
User experience is the basis for creating a better strategy with product usage analytics. According to your product usage data, you can develop new features that will improve your product or work on the features that are not adopted by your user base.
In this way, you can verify the factual data behind the changes to your product. You can use this metrics to have a higher user satisfaction rate. Additionally, you can more consistently predict what will be available for new products and features using product usage data.
Who Should Use Product Usage Analysis?
Almost any department in your company can use Product Usage Analytics to do a better job. For example, the product development team may base it on points you find most helpful to users. Likewise, they can make more pinpoint decisions to develop features that users have shown interest in. Another example is that the Sales and Marketing department can carry out advertising activities within the data obtained with the Product Usage Analytics framework. This way, they can create a more valuable customer relationship while increasing sales.
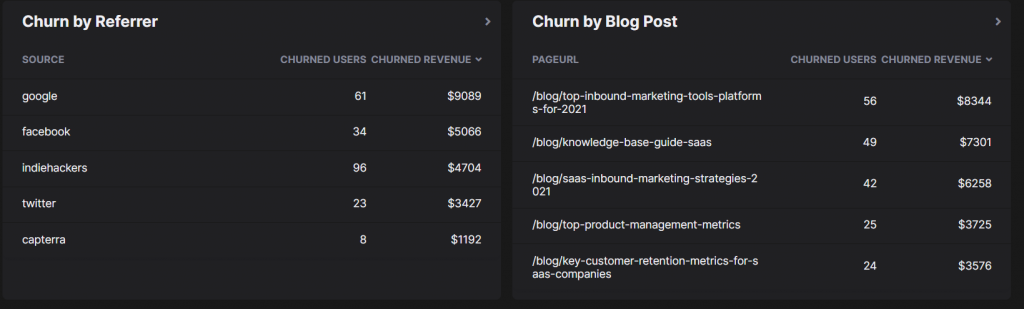
For example, marketing team can track product data & churn and connect them with marketing activities with HockeyStack to understand which sources/blog posts bring the most engaged customers.
How Do You Measure Product Usage?
In this section, I will go over some questions to answer & dashboards that will help you!
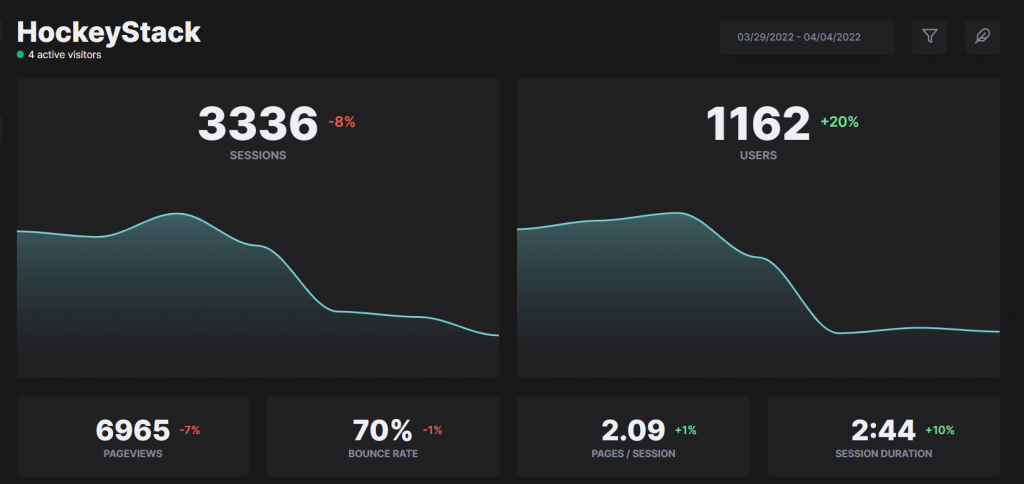
How actively do your users visit your website?
Especially if you are a SaaS company, it is imperative how actively your users interact with your site. If you have a high number of sessions per user, this indicates good traffic on your website.
According to a survey conducted by Littledata, the average number of sessions per user is 1.4. Also, if you have more than 1.6 sessions per user, it indicates that your website is in the top 20% of all websites, and if it is less than 1.2, then your website is in the worst 20% of all websites.
A high number of sessions indicates that your online content is interesting, while a low number means that your users often visit your website only once. It would be best to consider what you need to improve to increase your interaction in such a situation.
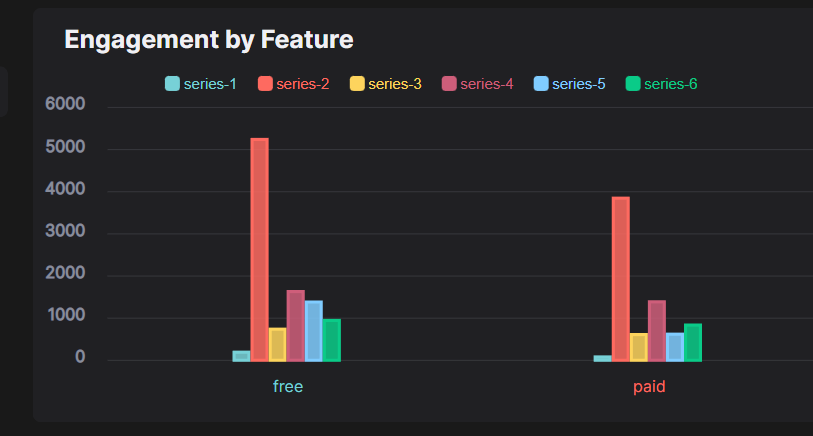
Which of your features are users more engaged with?
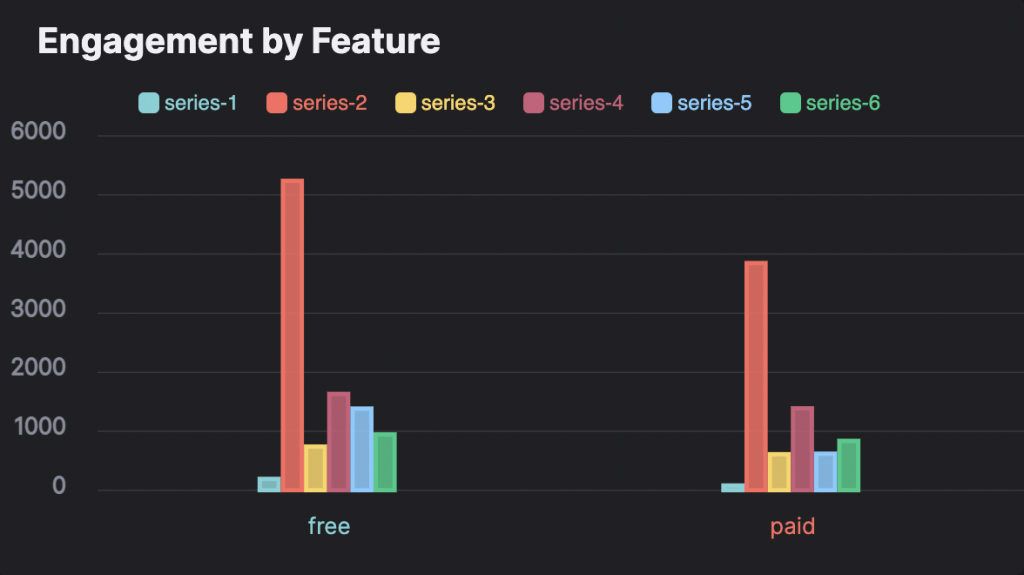
Your engagement rates need to pay attention to move your product forward and improve Product Usage analytics. A feature engagement rate indicates how active your users are interacting with a particular feature in its simplest definition. The higher your feature engagement rates, the more your product’s characteristics are valued and used by users.
Metrics
Stickiness

Measuring the stickiness ratio is better than relying on the DAU or the MAU alone because it is a holistic measurement used when talking about the company’s success. In its simplest terms, the Product Stickiness ratio is the ratio of DAU (Daily Active User) to MAU (Monthly Active User). DAU is the number of users interacting with your product during the day. MAU represents the total number of users who have used your product at least once in that month. For example, a Stickiness ratio of 40% indicates that forty out of every hundred people who use your product every month use the product at least once a day.
The stickiness ratio is very beneficial for Product Usage. For example, with these ratios, you can decide whether your company should create a different product or innovate on your existing product. By understanding the behavior of your users, you determine a roadmap accordingly. You can also divide your users into different segments according to this ratio. You can make the product use of your users a more personal experience with various marketing campaigns according to other parts.
Active users
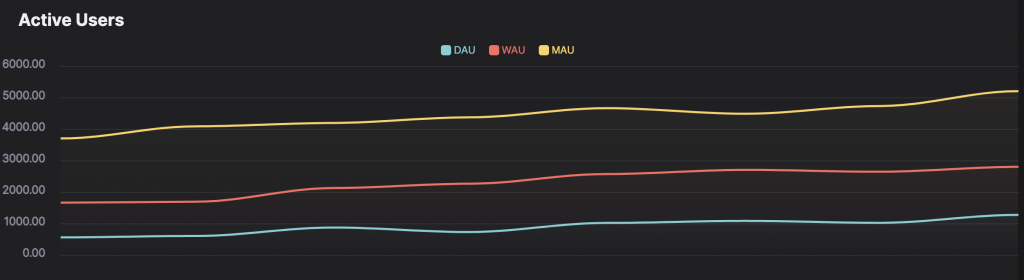
The Active User metric is a product engagement metric that gives the number of users who actively interacted with your website or product. You must determine the bird that a user must provide to be considered an active user. Users who fulfill the criteria you set are counted as active users. Active users can be categorized as DAU (Daily Active User), WAU (Weekly Active User), and MAU (Monthly Active User). As the name suggests, these categories depend on the period the metric is based.
Active Users formula is:
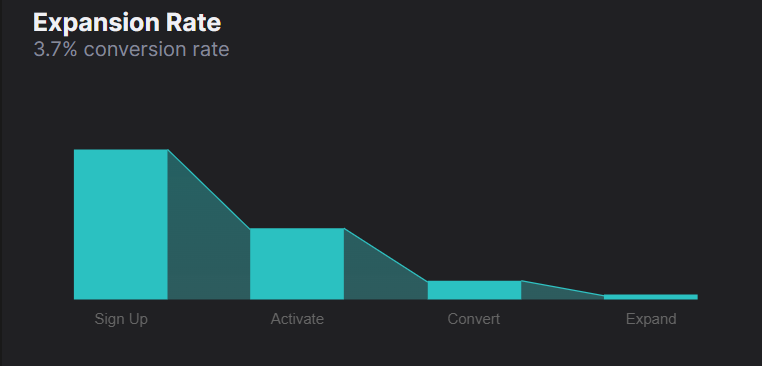
Product Activation Rate = (number of users who reached the activation milestone/ number of users who signed up) x 100
The number of active users is significant for Product Usage, primarily when you evaluate the use of your product’s features. The main reason for this is that you can see which part of the product users interact with more thanks to this metric. Thanks to this data, you can make your product more efficient. In addition, since the Stickiness metric is a metric that depends on active users, it would not be wrong to state that the Active User metric provides the convenience of the Stickiness metric.
Retention rate
Retention rate is the number of users who consistently use your website, product, or service. This metric is a critical success metric, mainly for SaaS companies and companies that operate with subscription-based pricing.
According to Bain & Company’s report, increasing your company’s retention rate by 5% increases your company’s profits by more than 25%. That’s why it’s so important to focus on improving your retention rates to profit more from your products.
Expansion MRR
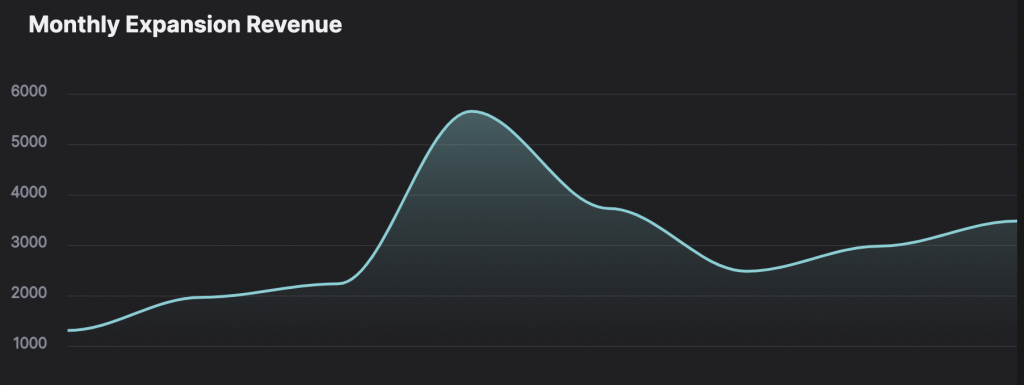
There are several ways to generate extra income from your current users. For example, you can perform cross-sells. Or you can bring new add-ons to your product. Or you can encourage your users to upgrade to a higher version. Expansion MRR (Expansion Monthly Recurring Revenue) is a metric you can use to measure the amount of additional revenue you get from your existing customers.
The best way to calculate your Expansion MRR is to compare your current users’ revenue at the end of this month with last month. You can determine whether your users have made a purchase other than the previous month’s purchases. The formula for Expansion MRR is as follows:
[(Expansion MRR at the end of the month – Expansion MRR at the beginning of the month) / Expansion MRR at the beginning of the month] x 100 = Expansion MRR percentage rate
Expansion MRR is highly correlated with customer satisfaction and Product Usage. To put it simply, Expansion MRR is an indicator of how satisfied your current users are with your product and how loyal they are to your company. If your users are happy with your product, they will make more extra purchases from you. Therefore, the better your Product usage analytics are, the higher your Expansion MRR will be.
Pro Tip:
HockeyStack gets your expansion MRR data from Stripe/Paddle and connect it with marketing, sales, and product usage data, !
What Is The Difference Between Marketing and Product Analytics?
Marketing Analytics is your analysis of data to measure the feedback from the users of your company’s marketing activities.
Product and marketing analytics set out to achieve the same thing in the company. However, the most fundamental difference between them is seen both in the names and definitions of the analytics. Marketing analytics deals with how your users access your website and become aware of your product. On the other hand, product analytics provides data analysis over your users’ interactions with your product.
In other words, marketing analytics deals with the beginning of the user process, while product analytics deals with the later stages of this process. So primarily, these two analytics are used by different departments. However, both marketing analytics and product analytics should be unified to better understand the whole customer journey so that you can answer questions like: Who are our most valuable customers and how did we acquire them?
Conclusion
Product usage analytics can seem complicated at first glance. However, as you understand the importance of this analytics and focus on metrics, it will help you draw a sustainable and objective roadmap to move your company to a much better spot. With this analytics, you will have the power to move your company to a much better point when you identify your product’s prominent and user-approved aspects and find ways to fix the remaining features.
FAQ
The main reason why Product Usage Analytics is so important is that you can have objective data about your users thanks to these analytics. You can use two methods to get information about your users’ interaction with the product: User surveys, or in other words, communicating with your customer and using product usage analytics. User surveys can provide you with essential information, especially in the early stages after a product’s launch. But user surveys are highly subjective as they interact with users one-on-one. On the contrary, your data with product usage analytics provides an objective picture of your customers’ product usage data.
There are many types of Product Analysis, but the five most important are Trend Analysis, Journey Analysis, Attribution Analysis, Cohort Analysis, and Retention Analysis. With Trend Analytics, you can determine which points of your product your users are trending over time. In this way, you can predict what kind of situation you will encounter in the future by comparing the use of your product’s features with the past. With Journey Analytics, you can track how your users reach their goals. So you can fine-tune the process.


