A Complete Guide To SaaS Product Analytics
Product analytics may sound like the latest buzzword in the SaaS space, but there’s plenty of utility in tracking the process that users follow to sign up for your product and how they interact with it.
In this article, I will talk about what product analytics is, who it is used by, why it is important for SaaS, and some tools that you might use to smoothen your product analytics process.
What is Product Analytics?
The term product analytics refers to the way your customers or prospects interact with your product. This will allow you to analyze the marketing aspect of your product. These sorts of analyses will allow you to reduce your churn rate, increase user activation and have a better user experience overall.
While product analysis is vital for any product-based company in 2022, this especially holds true for SaaS companies that need to map out their customer journey in order to come up with informed strategies to increase their reach.
Why Not Simplify Your Analytics?
Track key metrics, identify trends, and mitigate risks with greater visibility into your marketing, sales, and product data
Try HockeyStack Today
In addition to helping you identify the reasons behind certain trends in product usage, product analytics help you with comparing existing metrics and following your process. In this way, you will be able to figure out what sorts of tools and changes to your marketing strategy would prove useful for you.
Who Uses Product Analytics?
Here are some of the roles that can use product analytics
- Product Managers
- Marketers
- Engineers
- Analysts
- UX/UI Designers and Researchers
One common thing among these people is that they all deal with content-heavy products. Product analytics tools allow these users to deal with the excessive data they have to handle in their daily work life.
In addition to specific people that deal with product analytics, here are some of the sectors that mainly deal with product analytics :
- B2B
- Consumer tech
- E-commerce
- Fintech
- Media
These sectors are some of the most data-intensive sectors in the market. Thus, not using the right product analytics tool imperative for companies in these sectors but the frequency of analysis is also extremely important.
Why Is Product Analytics Important For SaaS?
According to multiple estimates, between 50 and 60 percent of people never return to a service provider if they have a bad experience with said provider. This means that around half of your user activation rate is at stake just if your customers are not satisfied with your product, let alone the external reasons.
For this reason, you have to market your product in such a way that it enables you to not only draw the highest number of customers but makes sure that your customers stay satisfied with your product. For this reason, analyzing important metrics with the help of a SaaS analytics software is vital for understanding how to achieve both.
In addition to all of these, you must consider that most SaaS businesses draw customers that are fluid, meaning their subscription or how they use the services you provide can change on a whim. This is why even the largest of SaaS companies like Netflix can see a drastic fall in their numbers if they fail to meet the expectations of their users.
Luckily, however, the opposite also holds true.
If you continue to provide excellent service, features that your prospects need, and market your product well, your SaaS can see a huge uptick in the number of users in a very short span of time. This is why it’s essential to use a SaaS analytics tool like HockeyStack to keep a close eye on your product’s key metrics and understand when you need to make changes to your marketing, product, or both.
So, in short, leveraging SaaS analytics software:
- Allows you to increase your user activation rate.
- Helps you to make sure your customers are satisfied with your product.
- Gives you a deeper understanding of the trends in your industry.
Key SaaS Product Analytics Metrics
In this section, I will talk about some important metrics you need to track to make the most of your analysis.
1. Conversion Rate
Conversion rate refers to the number of people that perform a certain action that’s part of your journey towards product adoption. This can be signing up for your newsletter, requesting a demo, or even starting a free trial of your product.
Conversion rate is vital for calculating how many people are actually interested in your product. If you are trying to figure out how engaged your potential visitors are with your product, this is the metric for you. You can calculate this metric more easily and accurately by using a SaaS analytics software. Utilizing a tool like HockeyStack will also enable you to compare this metric with other metrics listed in this article.
2. Customer Acquisition Cost
Your average customer acquisition cost is the average amount you spent to gain a new customer. The higher this number is, the more you spend on gaining a new customer. Now, this cost can include a number of smaller costs such as your expenses on PPC marketing or other forms of advertising etc. Naturally, you want this number to be as low as possible. Calculating your customer acquisition cost will enable you to decide whether you want to retain your already existing customers or want to reach new groups.
Naturally, this number fluctuates from industry to industry and from website to website. Thus, you need to calculate it often, most of the time either weekly or monthly, to get a better picture of how your product works.
3. Lifetime Value
Lifetime value (or average lifetime value) refers to the total value you get from a customer throughout their entire life journey. The higher this value is, the better.
You can consider the lifetime value as a success metric like conversion, meaning you can use this metric to calculate how successful your business is doing.
4. User Churn
User Churn, often referred to as User Churn Rate, refers to the number of customers that stop using your product. This metric is the opposite of your user activation rate. User churn is another metrics that can fluctuate often, meaning the value may change considerably depending on the period of time for which you are tracking. You will need a reliable tool that will not only help you track it frequently, but also track your data retroactively.
5. Active Users
Active users refer to the number of people that are using your product at any given moment. This metric can be considered a simplified version of your user activation rate. In addition to this comparison, the number of active users you have goes hand in hand with your user activation rate and is even strongly correlated to your customer acquisition costs.
As you can imagine from the simplistic nature of this metric’s name, you want your active users to be as high as possible. The more active users you have, the aware people are about your product and your brand in general. Having brand awareness for your product and having a customer base with brand loyalty is vital for your growth.
6. Net Promoter Score (NPS)
Your net promoter score calculates how loyal your customers are to your product and their general perception regarding the product. This term is directly correlated with your brand awareness and brand loyalty. An increase in your net promoter score will also go hand with an increase in the brand loyalty of your customers.
This means that an increase in your Net promoter score will also make it easier for you to retain your existing customers and even have them refer your product to their friends and family. If you are looking to increase your user activation rate, you should start by measuring and, eventually, working on improving your net promoter score.
As you might have deduced from the statements mentioned above, there is a strong connection between your net promoter score and user activation rate. This is why companies often look to view both of these metrics in tandem with the help of custom dashboards, allowing them to much the analysis much easier.
7. Bounce Rate
Bounce rate is a measure of the number of people who move on to another website without spending much time on your web pages. Naturally, you should want your bounce rate to be as low as possible. Although your ideal bounce rate depends on the type of industry you operate in and the type of website you have, the general rule is that an average good bounce rate is often between 25 and 40 percent, meaning you should strive for anything between or lower than these numbers.
Again, your bounce rate can be dynamic, meaning you need to keep a track of it often to identify any discrepancies early on. A tool like HockeyStack can send automated emails for you to constantly track your bounce rate. In this way, instead of constantly checking out and calculating your bounce rate, you will be able to automate the entire process.
8. Time Spent on Website
Another self-explanatory term, Time Spent on Website is an important metric to track as the longer a person spends on your website, the more possible it is for them to become activated users. Thus, you should strive to make your visitors spend as much time as possible on your website with the help of high quality content marketing tactics.
You can employ a number of other methods to increase the amount of time that people spend on your website as well such as adding interactive features to your website, optimize your advertising efforts, and finally A/B test different kinds of content and visuals to see what resonates most with your audience. Remember though, regardless of the method you employ, you need to make sure that what you are doing is working. Thus, it is vital for you to calculate how the methods you employ determine the average time spent on your website.
Tools
Now, you know what product analytics is and why it’s important, but which tools should you use to perform product analysis? Below, I will share the top SaaS analytics software that you can utilize for your product analytics complete with features and capabilities to help you make an informed decision for your SaaS business.
1. HockeyStack
HockeyStack is a no-code analytics & revenue attribution platform for SaaS. It tracks and unifies marketing, sales, product engagement, and subscription revenue data with no code, so SaaS businesses can easily answer questions such as:
“Marketing channels that yield the most revenue,” “Sales playbooks that bring the most engaged customers,” or “customer support team’s effect on expansion revenue, and more.
We do this by collecting all data retroactively from a script on the website, the payment provider, and the CRM. Users can then create reports without relying on technical skills.
You can check out pre-built product analytics report templates later in the article!
HockeyStack Pricing
HockeyStack has two different paid plans, both of which have a 14-day trial with a 30-day refund guarantee.
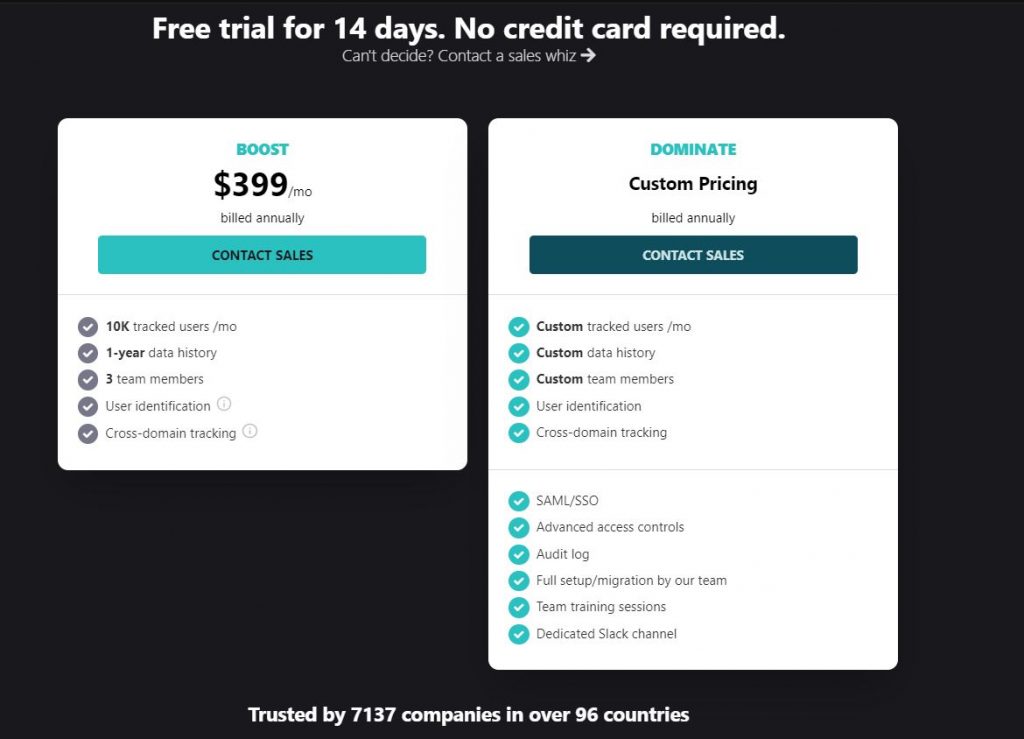
You can check out the pricing page here.
HockeyStack Integrations
- Paddle
- Stripe
- Hubspot
- Crisp Chat
- Mailchimp
- Intercom
- Pipedrive
- Chameleon
- Salesforce (coming soon)
- Zapier (coming soon)
HockeyStack Summary
The unique benefit of HockeyStack is its ability to unify your marketing, revenue, sales, and product data using no code. This allows you to uncover unique insights that you wouldn’t be able to by using multiple tools as they cause you to have fragmented data.
- You can integrate with Stripe, Paddle, Hubspot and other SaaS platforms to build every single dashboard that you can think of, using all sales, marketing, revenue, and product metrics.
- You can create funnels, goals, and surveys, which are rare to get with other tools on this list.
- You don’t need any developers, tracking is cookieless, and the script is small, so it doesn’t increase your site loading time.
2. Fullstory
Fullstory is an analytics company aimed at making your product analytics process easier and more efficient. According to Crunchbase, Fullstory was founded by Bruce Johnson, Joel Webber, and Scott Voigt in 2014 making it one of the oldest companies listed in this article.
According to their website, Fullstory provides its users with a general overview of their website and how they relate to one another.
Here are some of the features provided by Fullstory:
- Providing an overview of your website.
- Streamlining your data capture.
- Analyzing your DX data.
- Reviewing user sessions.
3. Indicative
Indicative was founded in 2014 in New York, United States. It was founded by Andrew Weinreich and Jeremy Levy. They claim that Indicative is directed at making comparisons between your individual metrics to understand the bigger picture. Although these claims are debatable, one must admit that Indicative brings fresh insight to the table.
Here are some of the features Indicative has:
- Multipath Funnel
- Track Journeys
- Segment your user base
- Create Dashboards
- Automated Reporting
4. June
June is a company founded by Enzo Avigo and Ferruccio Balestreri in 2020. This makes June one of the newest software tools in the industry. On Capterra, June has a rating of 5 out of 5; however, there are not many reviews, so one could argue that this score is not exactly reliable.
June markets itself as a tool for founders and project managers, and it specifically excels when it comes to marketing. Currently, June has a total of 16 Dashboards, however, even though this is seemingly pretty high, the way June interprets the existing data in the field is seriously lacking.
The main problem with June’s dashboards is not that they are not reliable, but the fact that there is a lack of interaction and comparisons between the different metrics. This is a great problem as you can imagine that a proper SaaS analytics process is dependent on making comparisons between individual metrics. Without proper comparisons between your metrics, there is no possibility of the proper interpretation of your metrics.
Here is a shortlist of some of the dashboards June has:
- User Retention
- Top Feature Users
- Active Users
- Activation
- New Users
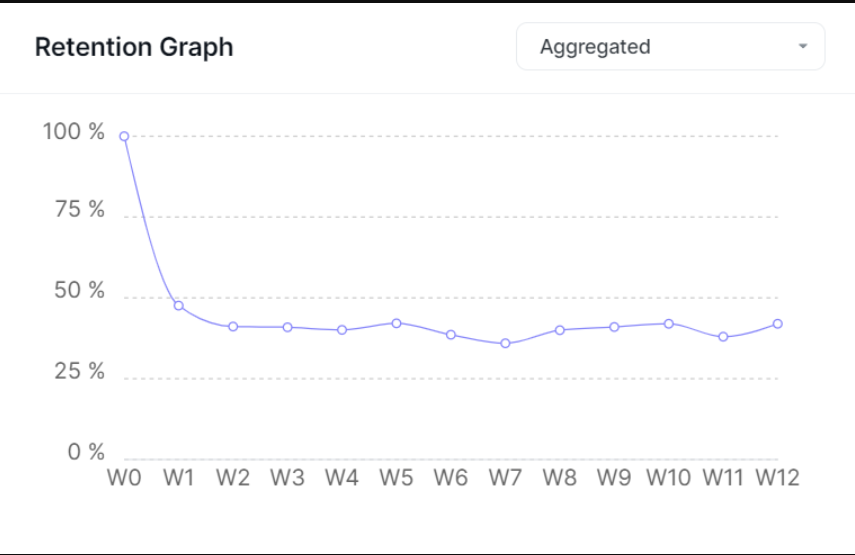
Here are some examples regarding how June presents its templates. The first one is about the popularity and frequency of your web pages:

This graph is about a given website’s user retention rate.
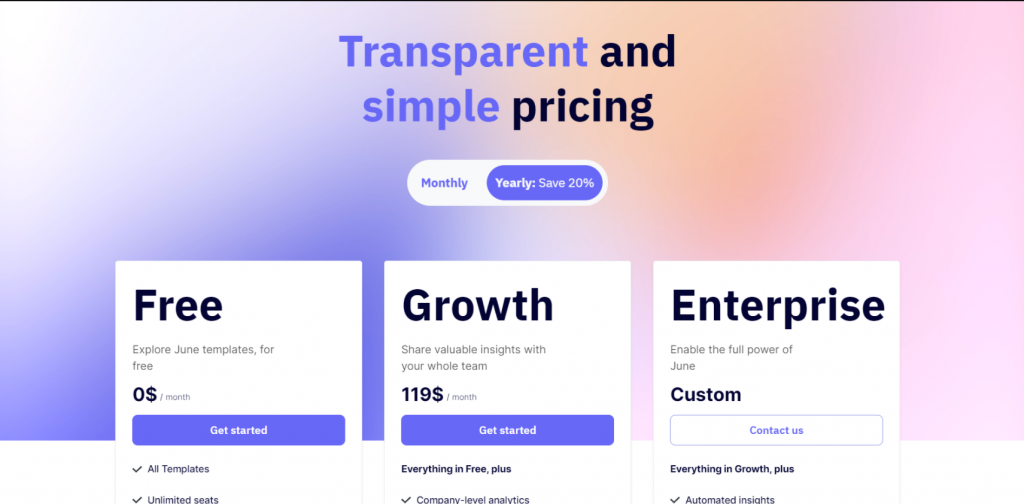
Pricing
June offers three different packages for its users. They are titled Free, Growth, and Enterprise. If you decide to opt for an annual subscription, you can get a 20% discount on your product.
There you have it: an introduction to product analytics, its importance in SaaS, and a list of the top SaaS analytics software that you should try to take your product analysis up a notch.
FAQ
A product analytics manager keeps an eye on the metrics that are important for a company, views them in tandem with each other to make comparisons, and figures out what should be done to increase the marketing quality of a company.
Product analytics helps product managers identify shortcomings and the most effective parts of a product marketing strategy. This information can then be used for optimization and getting improved results.
A product analyst creates strategies for companies to employ. They are vital for the marketing teams and marketing departments of a company.


