Oribi vs Google Analytics
SaaS companies need to analyze user engagement on their website and in products to find and fix UX issues, better allocate marketing budget, and grow revenue.
In this blog post, I will compare two analytics platforms that you can use to analyze website engagement: Oribi and Google Analytics.
Pro Tip:
If you are not satisfied with both tools, you can skip to the end of the article to see a better alternative 🙂
What is Oribi?
Although a small but very agile antelope species comes to mind when Oribi is mentioned, now we will talk about Oribi, a marketing analytics tool.
Oribi is an all-in-one Marketing Analytics tool founded in 2015. Oribi, like most analytics tools, provides features for creating visualized reports, analyzing and generating results.
Oribi may have just entered the market compared to its big competitors, but it has many different and new features for users. According to user comments, the best part of Oribi is that it automatically and easily brings you to your target without the need for knowledge and experience when analyzing, generating reports, or getting results.
Thanks to its simple and understandable interface, you can create the reports you want on a single page by showing the most important criteria.
It also has integrations with tools, such as Facebook, Hubspot, Klaviyo, etc
Check out all Oribi alternatives!
What is Google Analytics?
Google Analytics is a web analytics tool offered by Google that tracks and reports website traffic, currently as a platform inside the Google Marketing Platform.
Google launched the service in November 2005 after acquiring Urchin. Google Analytics is used to monitor website performance and collect visitor information.
By using Google Analytics, you can
- Identify the best sources of user traffic.
- Measure the success of marketing activities and campaigns, track goal completions (such as purchases, adding products to carts)
- Discover patterns and trends in user interaction and obtain other visitor information such as demographics.
Google Analytics includes features that can help users identify trends and patterns in how visitors interact with websites, such as:
- Data collecting
- Analysis
- Tracing
- Visualization
- Reporting
- İntegration with other applications.
Differences between Oribi and Google Analytics
Although both are marketing analytics tools that provide similar services, there are differences between them.
- Have a plainer and simpler interface
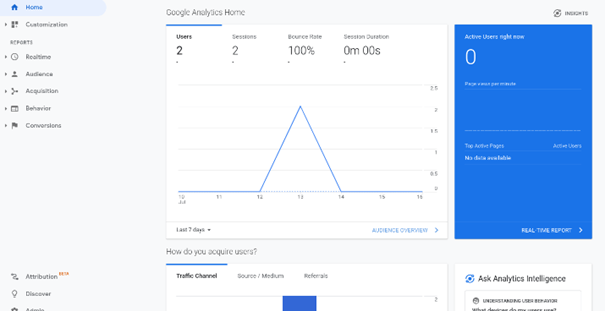
If you know one thing about Google Analytics, it’s the ugly interface it has.
Thanks to the simple and understandable interface of Oribi, you can create the reports you want by showing the most important metrics on a single page.
You don’t need to add segments to take control of a report individually. In Oribi, you can add your preferences to the system, prioritize reports according to your preferences, list and view them.
That does not mean Google Analytics is too complex to understand for everyone, but Oribi’s interface is much easier to use than Google Analytics’s interface.
2. Pricing
If you don’t need enterprise features, such as exporting 3,000,000 rows or using 200 custom dimensions, then you can use Google Analytics for free as long as you need.
On the other hand, Oribi’s lowest plan costs $540/month.
3. Oribi is no-code
To measure the number and details of a button click, you should be able to use Google Tag Manager well and load it from Tag Manager and send the data to Analytics. If you are using Oribi, you have a simpler way.
Oribi finds the clicked buttons on your website and shows them to you. You can create reports according to the button you want to track. In this way, you do not need to create a budget for a developer, and you make your work faster and simpler.
4. Step-by-step user journey
Boundaries in all areas of life prevent people from moving and lead them away from success. Limitations at work, especially in marketing, can be frustrating.
While you can only see forms that are in someone’s view in Google Analytics, Oribi allows you to access single visitor journeys to follow every step of their experience, understand specific behavior within funnels or attribution, and identify prospects by their email addresses.
5. User Specific Reporting
Oribi has better reporting capabilities than Google Analytics because you can design your own PDF reports with different colors and styles.
Similarities between Oribi and Google Analytics
Both apps have a score of over four, and they also have many similarities. In this blog post, we will touch on the similarities between Oribi and Google Analytics.
- Campaign Management
We start with a feature that both marketing analytics tools lack. Campaign management is the planning, execution, monitoring, and analysis of a marketing initiative; sometimes it focuses on a new product launch or an event. Campaigns normally include email, social media, surveys, print materials, giveaways, etc. targets potential buyers. It includes multiple pushes, all focusing on a similar topic or idea.
2. Sharing Reports
Converting and sharing data into different file types is as important as analysis. In Oribi, you can transport reports to PDF, share them through your account, or automate them to be created and sent repeatedly. Also with Google Analytics, you can send as a PDF or Excel spreadsheet right from your Google account, but you cannot design or automate them.
3. Subdomains & Ecosystem
When you add a domain to Oribi, you can choose to add it to an existing ecosystem or generate a new one. For example, your domain name is a website you want to monitor. Note, however, that you can also track subdomains with Oribi. Once you go beyond monitoring an area, an ecosystem can help you stay organized. In other words, an ecosystem is one or more related domains in Oribi. If you manage multiple domains and the Oribi ecosystem can help.

In addition, Google Analytics also provides a tracking service.
The Google Analytics Tracking tag allows you to upload a tracking code for Google Analytics. You can install it with Tag Manager without any problems.
| Oribi | Google Analytics | |
| Event Tracking | Automatic | Manual |
| Button Clicks As Events | Automatic | Manual |
| Funnel Tracking | ✓ | ✓ |
| User Journey Tracking | ✓ | ✓ |
Oribi Pricing
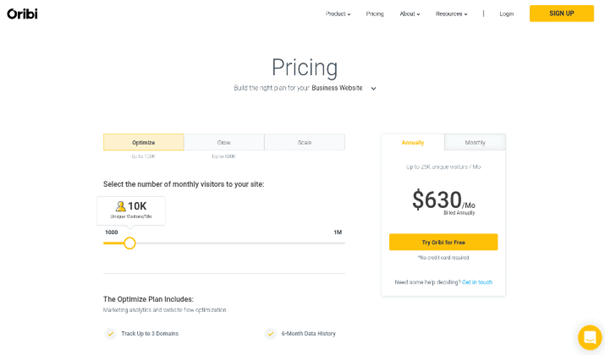
While Oribi is a useful analytics tool, it is pretty expensive. Of course, they have a free trial, but the lowest plan starts at $450/month, charged yearly.
Pricing is changing according to your need. whether you own an eCommerce website, own a business website, or are a marketing agency serving clients. It also depends on the number of visitors you are tracking per month.
It can be as high as $1755/month for a business website tracking up to 300,000 visitors/month.
Google Analytics Pricing
Google Analytics is totally free. There is also an enterprise solution, called Google Analytics 360, but it is notably pricey (around $150,000/year) and not necessary for the majority of businesses.
Oribi Reviews
Oribi’s overall rating on Capterra is 4.3
- “Do something with your data” said an anonymous commenter a less than six months.
Overall they make me feel like a partner who wants me to succeed in my profession
- “If knowledge is power ,Oribi is your weapon ” said another user and added;
The price is higher than the average, but Oribi gives users a lot of value for their money. Basically, any movement you can think of in Oribi is measured, sometimes in ways, you haven’t even imagined before. The analysis is as in-depth as it is easy to understand and incorporate. Reporting is not that responsive to customization, and you basically have to use what you have. As Google Analytics is a more popular application, it has links to many other applications, but this is not currently possible for Oribi.
- “Great product,” said Aviram G., Sales Manager
Throw all negativity out of your head and transfer information to your computer.

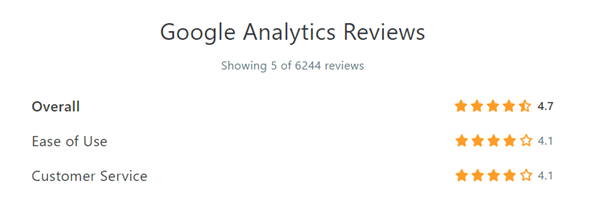
Google Analytics Reviews
Google Analytics overall score on Capterra is 4.7
“Overall I am very happy with using Google Analytics and would definitely recommend it to anyone who believes the digital presence of their website is important to their business.”
“It helps me better understand what kind of content I should add to my blog and will rank better with readers.”
It’s easy to get it set up and running, but once you start reading up there are a lot more capabilities than just being able to see your traffic. I use it for visitor behavior, demographics, and to see what pages are growing in views over time. However, it can be quite complicated to get it all to work if you want more in-depth data. As soon as you start wanting more information, you’ll need a tag manager and that’s a whole other beast.
Top Factors to Consider Before Choosing One
- Pricing
If you don’t have a big budget for tools, then you probably won’t use Oribi. However, using Google Analytics costs $0.
2. Funnel Tracking
Funnels allow you to guide users to the desired result. However, it can be difficult to set up your funnel properly – sometimes an extra, unnecessary page, for example, can cause users to leave the funnel without completing the desired conversion.
Tracking your users’ funnel and analyzing their journey will help you understand the current situation of your SaaS marketing funnel so that you can know what to work on next.
3. Guidance and Support
It’s always nice to feel a helping hand on your shoulder. A good guidance and support team is essential for getting help from experts in the field, finding answers to your questions, and more throughout your business life journey.
With Oribi Analytics, you can stay in touch 24/7 with a support team that answers your questions.
On the other hand, Google Analytics does not provide any guidance service for you.
A Better Alternative
If you don’t like the complexity of both tools and don’t want to spend hundreds of hours setting up your events, you have HockeyStack!
HockeyStack is an end-to-end analytics tool for SaaS companies. It unifies marketing, revenue, sales, and product data into one dashboard with no code so that you can understand what really drives revenue at your SaaS. It’s completely no code, and it doesn’t require any setup.
HockeyStack has one-click integrations with HubSpot, Stripe, and Paddle so that you can connect your existing data and answer questions, such as:
- What is the average LTV of a blog post?
- Which marketing channel brings the most engaged users?
- What is the demo close rate of my blog posts?
- What is the average churn rate of users who signed up for a blog post?
- What are the common sales objections of users who signed up from my ad campaigns, blog posts, or top-of-the-funnel content?
and many more.
Start using HockeyStack for free!
Conclusion
Overall, both of these marketing analytics tools can be great for tracking, planning, executing, monitoring, or reporting your data.
However, both tools have their disadvantages. Oribi’s plans are not suitable for everyone and it lacks revenue analytics. On the other hand, Google Analytics requires a ton of time to set up and is hard to use on a daily basis.
Create a free HockeyStack account to get access to no-code analytics that will unify all your data so that you can uncover invaluable insights!
FAQ
Oribi was founded in Tel Aviv.
To set up Oribi, you need to copy your tracking code into your website’s head tag and complete the process in your Oribi dashboard.
If you don’t need an enterprise solution, Google Analytics is free.


