ChartMogul vs Baremetrics: One Is Better For 2022
To have a complete, accurate view of all the activities in your organization, you must measure the outcomes and monitor the data. If you do not keep track of the outcomes, it will be more difficult to draw inferences where errors have occurred. It will take a long time to get rid of them. This delay may represent a significant risk to your business and your revenue. It is critical to understand where you are in relation to your competition. It is much easier to get an advantage over them if you have insight into their strategy and outcomes.
Tracking numerous data connected to visits and customers, refunds, other finances, and market situations has recently been easier owing to SaaS metrics tracking products on the market today that you may use. ChartMogul and Baremetrics are two popular SaaS revenue analytics tools, which can save you time.
Although both tools are quite valuable, they have advantages and disadvantages of their own. In this article, you will discover knowledge to assist you to decide which one to utilize for your business.
If you are also considering Profitwell, you can check out Profitwell alternatives!
Pro Tip:
If you are not satisfied with both tools, you can skip to the end of the article to see a better alternative
What are ChartMogul’s Advantages?
ChartMogul’s primary features include allowing subscription business model clients to monitor their firm’s profitability, providing necessary insights into their subscribers’ activities and habits, and easy interfacing with the invoicing systems that they are currently using.
Check out ChartMogul alternatives!
Capable of doing complicated, segmented analysis
Analyzing revenue and sales metrics, such as MRR, LTV, and Churn Rate in isolation is never adequate for expanding organizations. They offer sophisticated segmentation tools that allow you to go further and answer questions like;
- What is the attrition rate for SMB versus Enterprise customers?
- What is our ARPA by business region?
- How is our MRR broken down by industry?
Capable of managing all of your revenue data on a single platform
Many SaaS companies have their subscription data spread across many billing systems, making it difficult to acquire reliable, consolidated revenue numbers.
ChartMogul combines billing data from several sources and makes it visible and available to everyone in your business. It can integrate with many apps and tools. This allows businesses to send invoices and bills to their subscribers while also making customer and subscription information easily accessible through the payment management systems of their choice.
As a result, it safeguards their technological investments and enables them to achieve smooth system compatibility.
| Baremetrics | ChartMogul | |
| Stripe | ✓ | ✓ |
| Zapier | X | ✓ |
| Shopify | X | ✓ |
| HubSpot CRM | X | ✓ |
Capable of providing necessary feedback
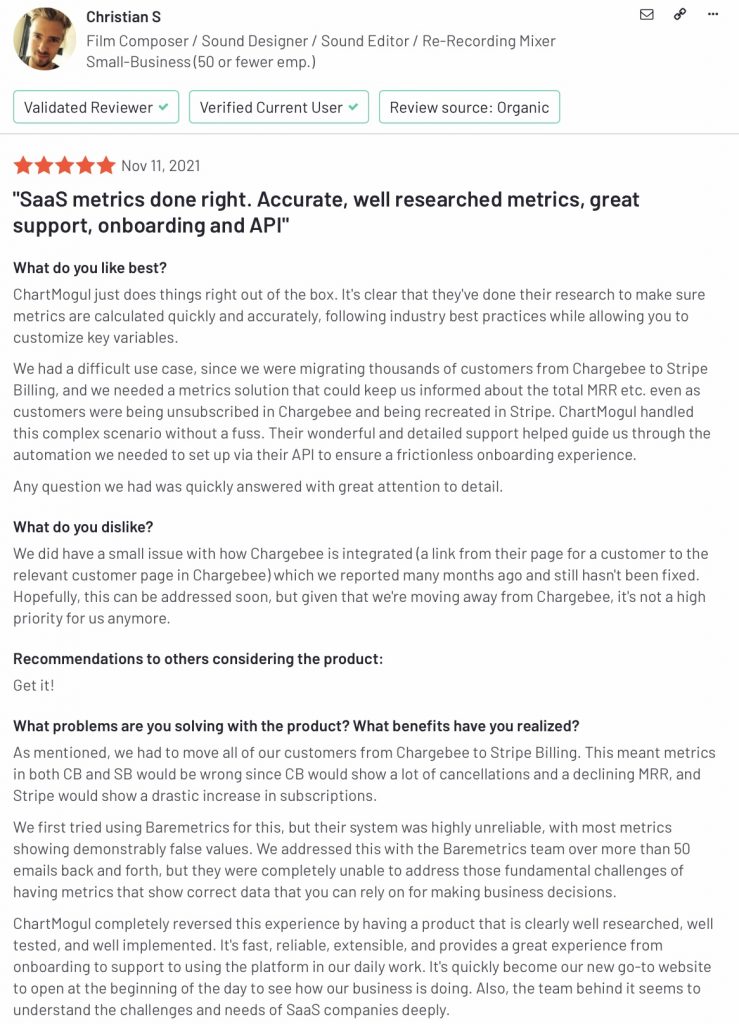
According to user reviews, ChartMogul offers a support crew that is practically skilled in everything ChartMogul and SaaS-related.
They provide a strong help center with many articles addressing practically any query or use case that may come from using ChartMogul, as well as plenty of additional ideas. They also give a dedicated Customer Success Manager to help you with your onboarding process and train your coworkers. The CSM will upload your billing data, metadata, trials, and leads to the platform so that you may begin analyzing them.
Reviews
What are Baremetrics’ Advantages?
Baremetrics delivers metrics, forecasting, analytics, insights, and engagement solutions for teams who use Stripe, Braintree, Chargify, Recurly, and other payment processors. They attempt to deliver critical business metrics and data such as MRR, LTV, and Churn Rate.
Check out all Baremetrics alternatives!
Capable of recovering lost income from rejected payments with a full-featured dunning system
If your company is losing money each month due to unsuccessful payments, Baremetrics can help. A low flat cost based on your MRR can offer you many of the services you require to decrease rejected payments and recover lost income.
With customizable email campaigns, in-app reminders and paywalls, credit card collection forms, and in-depth analytics to track everything along the way, Recover delivers a mix of tools to help you prevent missed payments. If the recovered revenue does not cover the cost of your complete Baremetrics account, they will credit you the following month.
See to learn more about Dunning Services.
Capable of combating churn with Cancellation Insights
With Baremetrics, you can identify why consumers cancel and how much money you’re losing as a result of those reasons, and then send automatic emails to entice them back. You may also personalize every branding piece, choose your own reasons, and gain important information directly during the cancellation process using their drop-in form. You may also utilize an in-email survey to automatically email users who cancel.
Pro Tip:
If you want to create a churn survey to better understand why your users churn, you can use our free survey tool!
Capable of accurately Forecasting your cash flow
The Baremetrics Forecast Module gives future statistics on cash and payables, monthly recurring revenue, and customers, which aids in protecting your company’s cash flow. Revenue growth, active subscriptions, and consumers will be shown via the Cash Flow Data.
This is accomplished by downloading the data’s CSV file on a monthly, weekly, or daily basis. You may also get straight numerical figures of the Monthly Recurring Revenue Data and Customer Data, which will help you understand the condition of your business at the right moment.
See here to read the ultimate guide for critical product management metrics.
| Baremetrics | ChartMogul | |
| Forecasting | ✓ | X |
| Scheduled / Automated Reports | ✓ | X |
| Automated Dashboard | ✓ | X |
| Cancellation Insights | ✓ | X |
Reviews
What are ChartMogul’s Disadvantages?
Clunky UX
Even though ChartMogul provides a plethora of relevant data for your business, some people have mentioned that there are some unpleasant minor parts of UX (where charts move when the mouse scrolls over them).
Filtering is basic
There isn’t a “OR” option (currently ChartMogul only has multiple filters as “AND”). Even if you want to use the “AND” filter, it is not clear how to pick multiple items.
Buggy Integrations
It does not always integrate properly in both directions. Bugs can occur especially when the data that has already been pushed to ChartMogul is updated.
Currency Problems
Currency changes occur from time to time. Although ChartMogul can easily convert your payment currency into your operational currency, it does not yet enable leveraging this currency data to demonstrate how swings in these conversion rates effect changes in your key metrics over time.
API is limited
There are several features that are already feasible, such as running filtered searches using the dashboard but are not yet provided in the customer-facing API.
Reviews
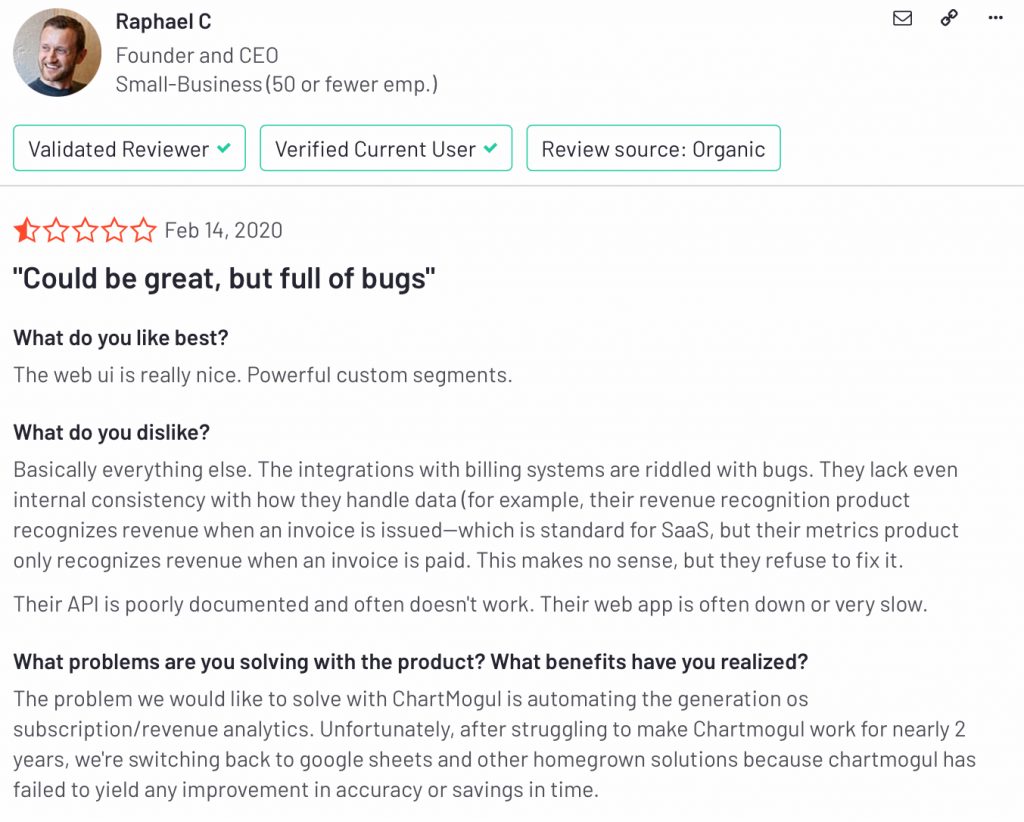
What are Baremetrics’ Disadvantages?
Despite the fact that Baremetrics delivers numerous useful insights for your SaaS, its price options are a little on the expensive side, leaving many clients out. See to learn more about Baremetrics’ pricing options,features and its alternatives.
Better performance needs a vast volume of data. However, even if you supply that vast quantity of data, erroneous numerical representations and computations of active consumers may appear, as expressed by user complaints.
Access to acquiring information from Stripe has lately been limited, and another event that has recently appeared is the integrated segmenting function, which is quite sticky.
It does not support multiple users or teams, and there are currently no mobile-based applications available.
Reviews
ChartMogul vs Baremetrics: Pricing
While Baremetrics doesn’t have a free plan available, ChartMogul is completely free up to $10K MRR. However, after the free plan, ChartMogul is more expensive for the majority of businesses as Baremetrics has a feature-based pricing structure.
A Better Alternative: HockeyStack
HockeyStack is an end-to-end analytics tool for SaaS companies. It unifies marketing, revenue, sales, and product data into one dashboard with no code so that you can understand what really drives revenue at your SaaS. It’s completely no code, and it doesn’t require any setup.
HockeyStack’s Features
HockeyStack offers these features with no code:
- Step-by-step user journey
- Custom dashboards
- Funnels and goals
- Insights
- Surveys
- Revenue analytics
- Segments
and more
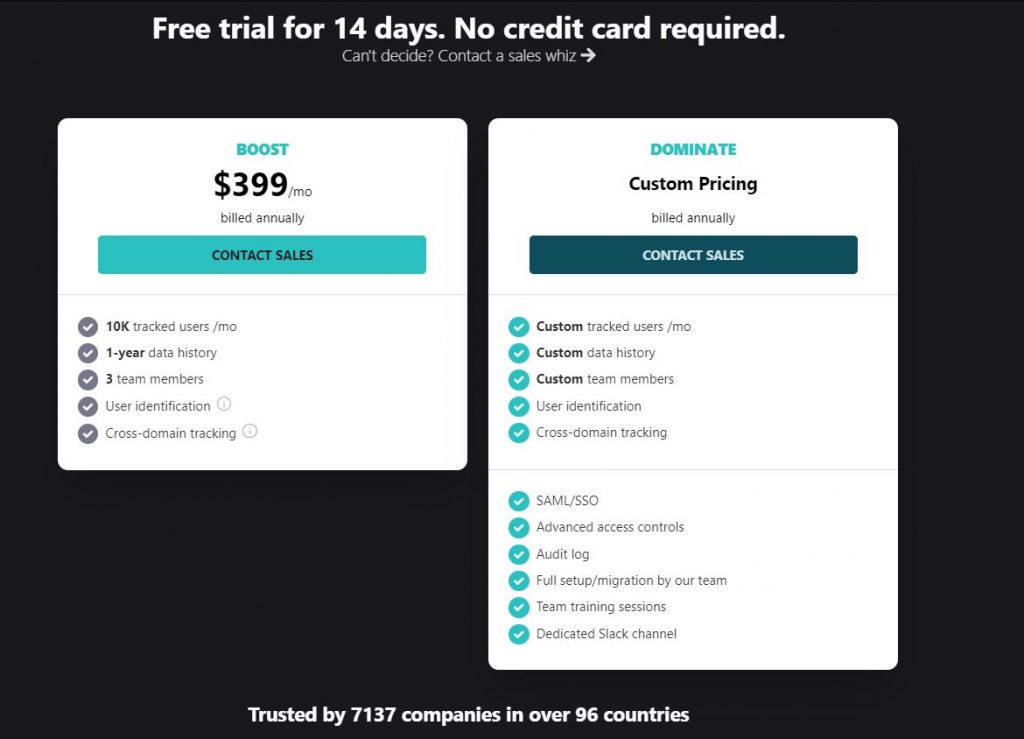
HockeyStack Pricing
HockeyStack has two pricing plans, both of which have a 14-day trial with a 30-day refund guarantee.
You can check out the pricing page here.
HockeyStack Integrations
- Paddle
- Stripe
- Hubspot
- Salesforce (coming soon)
- Zapier (coming soon)
HockeyStack Pros and Cons
I might be biased, but this is an objective evaluation of HockeyStack’s pros and cons 🙂
HockeyStack Pros
The unique benefit of HockeyStack is its ability to unify your marketing, revenue, sales, and product data using no code. This allows you to uncover unique insights that you wouldn’t be able to by using multiple tools as they cause you to have fragmented data.
- You can integrate with Stripe, Paddle, and Hubspot and build every single dashboard that you can think of, using all sales, marketing, revenue, and product metrics.
- You can create funnels, goals, and surveys, which are rare to get with other tools on this list.
- You don’t need any developers, tracking is cookieless, and the script is small, so it doesn’t increase your site loading time.
HockeyStack Cons
HockeyStack generally lacks reporting features as it’s not focused on agencies and other reporting-based businesses.
- HockeyStack doesn’t have weekly e-mail reports
- The tool lacks some integrations, such as Salesforce, Mailchimp, and Zapier (which are on the roadmap).
Conclusion
Tracking numerous metrics connected to visits and customers, refunds, other finances, and market circumstances has recently been easier owing to SaaS metrics tracking technologies on the market today that you may use to save a significant amount of time. Both Baremetrics and ChartMogul serve a similar goal yet have distinct characteristics.
If you want to unify your data to unlock insights that your data warehouse or Segment cannot provide, such as such as the LTV of a campaign, or the churn rate of each marketing channel with no code, create a free HockeyStack account now. No CC required.
Baremetrics relies on third-party suppliers and hosting partners to supply the storage necessary to run the Service. Although you have complete control over your data, you should be aware that it may be kept on third-party servers and sent across third-party networks.
Baremetrics provides an extra premium, automated dunning management product – Recover – to help you recover your leaky money and customers. Such services are not provided by ChartMogul. Furthermore, Baremetrics has a Forecasting tool for metric prediction, which ChartMogul does not. Only Baremetrics provides email notifications and email reports on a daily/weekly/monthly basis. ChartMogul, on the other hand, exclusively delivers in-app alerts.


